
Abstract
Research examining the consequences of the public’s confidence in the scientific community has primarily focused on the natural or medical sciences. It is not clear whether the public’s confidence in the scientific community has implications for research and practice in the social sciences. To begin examining this question, this study assesses whether survey respondents’ confidence in the scientific community is associated with their demeanor during the survey interview. This is consequential because respondent demeanor itself has been associated with survey refusal and nonresponse to items within surveys. Analysis of the 2004–2016 General Social Survey finds that individuals expressing more confidence in the scientific community are rated as having more positive demeanors by interviewers. Respondents’ confidence in other types of institutions does not show the same association, suggesting that confidence in the scientific community is uniquely associated with respondents’ demeanor during the interview. These findings suggest that the public’s confidence in science could have implications for at least survey-based social science research.
The public’s confidence in the scientific community is a topic that garners interest from multiple audiences. For some scholars, this topic serves as the setting for questions about the nature of authority and the production of accepted knowledge (e.g. Gauchat, 2011; Sturgis and Allum, 2004). For many scientists, though, the public’s confidence in science is often seen through a practical lens, as it is believed that if the public lacks confidence in science then it will be more difficult to conduct research, teach students, and communicate with the public (e.g. Gruen and Grabel, 2006).
This assumption is not unfounded. Research has shown that individuals expressing higher levels of confidence in science and scientists are more likely to listen to scientific experts’ advice (Bleich et al., 2007), accept the conclusions of scientific research (Hmielowski et al., 2014; Malka et al., 2009), support scientific research that is seen as controversial (Lee et al., 2005; Liu and Priest, 2009), support increased funding for scientific research (Besley, 2016), and are more likely to participate in research studies (Shavers et al., 2001).
Almost all of this research, though, has been conducted in the context of the natural or medical sciences. Do social scientists have professional reasons to be invested in the public’s confidence in the scientific community? Of course, many social scientists want the same practical outcomes that drive other scientists to be interested in the public’s confidence in science. Yet, it is not clear that the public’s confidence in the scientific community leads to the same positive outcomes for social scientists that have been demonstrated in the context of the natural and medical sciences.
This study begins to address this question by examining how a respondent’s self-reported confidence in the scientific community is associated with his or her demeanor toward participating in a social science survey. Participation in surveys represents one of the more prominent ways in which someone might interact with social science. If an individual’s confidence in the scientific community is significantly associated with his or her receptiveness toward a survey interview, then this would serve as evidence that the public’s confidence in scientists is relevant for at least one aspect of social scientists’ research and practice. The potential consequences of respondent demeanor go beyond the enjoyment of the interviewer, as research has shown that individuals perceived to have more negative demeanors tend to have higher rates of refusal to survey requests (Smith, 1984) and higher rates of nonresponse to specific items within a survey (Kim et al., 2012).
Public confidence in the scientific community
Although research has demonstrated patterns and trends in the public’s confidence in the scientific community (Bak, 2001; Etzioni and Nunn, 1974; Gauchat, 2012), what is less clear is what an individual is actually thinking about when reporting his or her confidence in the scientific community. As Pion and Lipsey (1981) noted in one of the earlier analyses of public attitudes about science, “[i]t is not even clear what the public includes under the label ‘science and technology’ or which particular sciences they think of (chemistry, physics?)” (p. 314). More recently, Gauchat (2012: 182) notes that one limitation of measures of public confidence in the scientific community is the issue of “how the public interprets the ‘scientific community’.”
One possibility is to directly ask the general public who or what they think is scientific. Surveys that have asked US adults to rate how scientific different fields are have shown that medicine receives the highest rating of being “very scientific,” with 80% of US adults assigning that rating. Physics and biology follow close behind at 69% and 67% of US adults rating them as very scientific, respectively (National Science Board, 2014). Comparatively few US adults rate social science fields as very scientific. For instance, 15% of US adults rate economics as very scientific, while 9% rate sociology as very scientific.
While such findings are interesting, they do not actually offer the best examination of how the public’s confidence in science might impact social science research, education, and outreach. First, it is possible that survey respondents are simply reflecting how these fields are taught and presented to the average person in the United States. That is, fields like biology and physics are often explicitly labeled as “science classes” starting early in the educational process, while many social science fields are not presented at all unless an individual attends college (Schibeci, 1986).
More importantly, while such ratings might tell us that the social sciences are perceived as further away from the scientific community’s core than physics or biology, they do not tell us whether the social sciences are so far from that center that the public’s confidence in the scientific community has no relevance for research and practice. What is needed is a way to test whether an individual’s confidence in the scientific community impacts how he or she interacts with social science research and practice.
Finding such a test is challenging. The social sciences generally lack the clearly defined, well-known findings or claims whose acceptance can be measured in the general public in the same way as, say, the public’s views on vaccines, evolution, or climate change. One possibility might be to examine whether an individual’s confidence in the scientific community influences his or her willingness to participate in social science research. As a parallel, research has shown that an individual’s confidence in scientists is positively related to his or her willingness to participate in medical research (Bombard et al., 2014; Shavers et al., 2002).
The most likely situation in which an individual in the general population would be asked to participate in social science research is as a survey respondent. The question becomes, then, does an individual’s confidence in the scientific community affect his or her willingness to respond to a survey? The obvious obstacle to answering this question is the difficulty in knowing an individual’s confidence in the scientific community before requesting and acquiring his or her participation in a survey. An individual’s confidence in the scientific community is, after all, usually measured through a question on the survey.
An alternative might present itself in the variation found within individuals who do participate in the survey. That is, not all respondents are equally engaged, cooperative, or friendly even if they ultimately make the decision to participate. If respondents reporting higher levels of confidence in science are more engaged, cooperative, or friendly, then this could serve as a test of whether the public’s confidence in science has implications for social science research and practice. These implications would extend beyond simply friendlier or smoother experiences for survey interviewers, as studies have shown respondents’ overall perceived cooperativeness and friendliness to be associated with the rate of nonresponse to questions within the survey itself (Kim et al., 2012). Such nonresponse, in turn, reduces the quality of the data that is produced from the survey.
Survey respondent demeanor
Some past research has examined the demeanor of respondents during a survey interview. Many of these studies have focused on the associations between religion and respondent demeanor as a case study of religion’s influence on prosocial behavior (Morgan, 1983). Examining a survey of black Americans, Ellison (1992) found that individuals reporting higher levels of religious devotion, as measured by frequency of prayer, Bible study, and religious media consumption, were rated by interviewers as more enjoyable to interview. Such individuals were also rated by the interviewers as less suspicious toward the interview. Brennan and London (2001) found very similar results in their analysis of interviewer ratings of respondent cooperativeness in the General Social Surveys (GSS). Religion has not always been found to have positive associations with respondent demeanor, though. Sherkat (2007) found that individuals believing the Bible is the literal word of God are rated as less cooperative by survey interviewers.
Although focused on the role of religion, these studies have highlighted other seemingly consistent factors shaping respondent’s perceived cooperativeness. Non-white respondents, for example, tend to be rated as less cooperative than white respondents by interviewers (Brennan and London, 2001; Sherkat, 2007). Some of these patterns could be a function of the interviewer’s own biases more than the respondent’s actual cooperativeness. Leal and Hess (1999) found that survey interviewers rated black and poorer individuals as less informed about and less understanding of survey questions about politics even after controlling for respondents’ scores on a scale of objective knowledge about politics. Other research has argued that, while race and social class differences in cooperativeness might partially be a function of interviewer biases, they are also a function of actual underlying differences (Dohrenwend and Dohrenwend, 1968). For instance, research has shown that individuals who experience social exclusion, like many minorities and the poor do, will offer less help and cooperation to those around them in the future (Twenge et al., 2007).
Past research on respondents’ attitudes toward the interview has also highlighted the potential influence of psychological factors. For instance, Ellison’s (1992) analysis showed that some of the positive influence of religion on respondent friendliness was mediated by the respondent’s score on a self-esteem measure. Other research linking psychological measures to prosocial behaviors, of which survey participation could be considered, suggests that measures like a respondent’s general level of trust in people (Wang and Graddy, 2008) or happiness (Lyubomirsky et al., 2005), might also influence his or her demeanor toward a survey interview.
Hypotheses
While research has pointed to a number of factors that influence a respondent’s demeanor during a survey interview, none have considered the respondent’s confidence in science. Since surveys are often conducted by social scientists or in the context of social science research, a respondent’s confidence in the scientific community could positively shape his or her demeanor during the interview in the same way that other research has shown confidence in the scientific community positively influencing individual’s interactions with the scientific community. The primary hypothesis under consideration in this study, then, is the following:
Hypothesis 1: A survey respondent’s self-reported confidence in the scientific community will be positively related to his or her demeanor toward the survey interview.
Even if this first hypothesis is supported, a potential question concerns whether it is confidence specifically in the scientific community that is influencing the survey respondent’s demeanor toward the interview or whether his or her confidence in the scientific community is simply reflecting a confidence in institutions more broadly. If confidence in the scientific community is uniquely influencing a respondent’s attitude toward the interview, then we should expect that his or her confidence in other institutions should not have the same influence. With this in mind, a second hypothesis is offered,
Hypothesis 2: A survey respondent’s self-reported confidence in social institutions and groups other than the scientific community will not be significantly related to his or her demeanor toward the survey interview.
Data & measurement
The data used to examine the hypotheses specified earlier come from the pooled 2004–2016 GSS (Smith et al., 2017). Conducted biennially by the National Opinion Research Center and primarily funded by the National Science Foundation, the GSS is a nationally representative repeated cross-sectional survey of non-institutionalized US adults that first began in 1972. The GSS is used widely by sociologists, political scientists, and other social scientists. Interviews are primarily conducted in-person and last one and a half hours on average with response rates around 70% in recent editions. These data are weighted to adjust for the sampling design of the GSS and area nonresponse patterns. 1
The measure representing the respondent’s demeanor during the interview has been included in every edition of the GSS since 1973. The analysis presented here only utilizes the 2004 through 2016 editions of the GSS, however, as it is in 2004 that the GSS began to document (or at least make available) identification codes representing each interviewer. Because the outcome measure is based on the interviewer’s rating of the respondent’s demeanor, it is important to account for potential interviewer effects on these ratings. We describe below how the analysis accounts for these effects.
Outcome measure
The outcome of interest for this study comes from a question on the General Social Survey that is answered by the interviewer rather than the respondent. Specifically, interviewers are asked “In general, what was the respondent’s attitude toward the interview?” In answering this question, the interviewer selects one of four options: (1) Friendly and interested, (2) Cooperative but not particularly interested, (3) Impatient and restless, or (4) Hostile. This subjective evaluation on the part of the interviewer is likely influenced by factors such as the respondent’s tone, facial expressions, body language, and other variables for which we do not have direct measures. It is also likely influenced by the characteristics of the interviewer, which is accounted for below by including interviewer effects in the analysis.
Very few respondents are coded as being hostile. Of the 10,588 respondents in the 2004 through 2016 GSS, only 14 (0.13%) were assigned to this category. Given its extreme rarity, this category is collapsed into the impatient and restless code, and the categories are reverse coded so that higher values represent more positive demeanors. The final coding, then, is (1) Impatient and restless or hostile, (2) Cooperative but not particularly interested, and (3) Friendly and interested.
Primary predictors
The GSS has consistently included a question asking respondents about their confidence in a variety of institutions.
2
This question is worded,
I am going to name some institutions in this country. As far as the people running these institutions are concerned, would you say you have a great deal of confidence, only some confidence, or hardly any confidence at all in them?
Respondents can state that they have (1) A great deal (of confidence), (2) Only some (confidence), or (3) Hardly any (confidence). One of the institutions offered for this question is the “scientific community.” This item is used here to as the primary predictor in assessing the Hypothesis 1. Responses are reverse coded so that higher scores represent higher levels of confidence.
Respondents’ confidence in other institutions must also be examined in relation to their effects on respondent cooperation to assess Hypothesis 2. While the GSS asks respondents about their confidence in a number of different institutions, two are focused on here: confidence in the press and confidence in education. These are chosen as the comparisons because both have potential associations with survey research and\or the scientific community. Many people, for instance, might associate the scientific community with colleges and universities (i.e. institutions of education). The press is often associated with polling, which to the general public might be indistinguishable from academic survey research. Finding the hypothesized null effect of confidence in these institutions would provide a persuasive contrast with the hypothesized significant effect of confidence in the scientific community on survey respondent cooperation.
Controls
There are other factors that could shape a respondent’s demeanor toward the interview and also be associated with their confidence in the scientific community. These other factors must be accounted for to properly assess the unique effect of confidence in the scientific community.
As reviewed earlier, a number of studies have found associations between a respondent’s religion and his or her attitude toward a survey interview. Other studies have found links between religion and attitudes toward science (e.g. Gauchat, 2011). Given these findings, a series of indicators are used to assess the respondent’s religious tradition. The categories represent the following traditions: (1) Evangelical Protestant, (2) Mainline Protestant, (3) Black Protestant, (4) Catholic, (5) Jewish, (6) Other Religion, (7) None\Unaffiliated. These indicators are coded using a common classification of the GSS’ religious and denominational affiliation measures (Steensland et al., 2000). 3 In the analysis below, the Evangelical Protestant category serves as the reference group. Also included is a measure representing the respondent’s answer to the question, “About how often do you pray?” Responses were reverse coded from the original GSS order to: (1) Never, (2) Less than once a week, (3) Once a week, (4) Several times a week, (5) Once a day, and (6) Several times a day. Based on past research (Morgan, 1983), it is expected that prayer frequency will have a positive association with respondent friendliness and cooperation. The last religion-related measure represents the respondent’s answer to the question, “Which of these statements comes closest to describing your feelings about the Bible?” Responses are coded as (1) The Bible is the actual word of God and is to be taken literally, word for word, (2) The Bible is the inspired word of God but not everything in it should be taken literally, word for word, (3) The Bible is an ancient book of fables, legends, history, and moral precepts recorded by man. Respondents could also volunteer a response of “other.” Since a non-trivial proportion (1.7% in the years examined here) of respondents offer this other response, it is treated as a distinct category in the analysis. Based on past research (Sherkat, 2007), though, it is expected that respondents choosing the inspired word and book of fables response will be more cooperative and friendly than those choosing the literal word response.
Past research has also suggested links between individuals’ trust in others, their personal happiness, and their confidence in institutions like the scientific community (Bartolini et al., 2013). Trust in others also plays a role in research subjects’ demeanor (Shavers et al., 2002), and it also seems likely that an individual’s general happiness could influence their demeanor when interacting with researchers. Given this, several measures are included to account for respondent’s general trust and psychological state. One measure is included representing an individual’s response to the question, “Generally speaking, would you say that most people can be trusted or that you can’t be too careful in dealing with people?” Potential responses were (1) Most people can be trusted and (2) Can’t be too careful. Respondents could also volunteer the response of “Other/Depends.” A sizable proportion (5.22% in the years examined here) of respondents volunteer such a response, so this category is kept in the analysis as a distinct response. Another measure is included representing the respondent’s self-reported general happiness. Specifically, the question asked, “Taken all together, how would you say things are these days—would you say that you are very happy, pretty happy, or not too happy?” In the analysis this measure is reverse coded so that the responses are (1) not too happy, (2) pretty happy, and (3) very happy.
Research has suggested that psychological characteristics like agreeableness, openness to experience, and extraversion vary across and can be shaped by regional contexts and cultures (Plaut et al., 2002). There are also known regional differences in public confidence in science, particularly with individuals in the South expressing less confidence (Gauchat, 2012). To account for these patterns, indicators representing the respondent’s region of residence are included in the analysis. These indicators correspond to the nine Census divisions: (1) New England, (2) Middle Atlantic, (3) East North Central, (4) West North Central, (5) South Atlantic, (6) East South Central, (7) West South Central, (8) Mountain, and (9) Pacific.
Several other socio-demographic measures are included that past research has shown to be connected to both respondent demeanor and attitudes about science. Respondent education, for example, has been shown to be positively related to survey cooperation (Sherkat, 2007) and confidence in science (Gauchat, 2012). Given this, a measure representing the respondent’s highest educational degree is included. The categories for this measure are (0) Less than a high school degree, (1) High school degree, (2) Associate’s/Junior college degree, (3) Bachelor’s degree, (4) Graduate degree. Racial minorities have been found to be rated as less cooperative in survey interviews (Brennan and London, 2001; Dohrenwend and Dohrenwend, 1968), and research has also shown that non-white individuals express less confidence in the scientific community (Gauchat, 2012). As a result, indicators representing the respondent’s race are included in the analysis. The question asked, “What race do you consider yourself?” with responses of (1) White, (2) Black, and (3) Other. The White category serves as the reference group in the analysis, and it is expected that the other two categories will be negatively associated with positive demeanor in the survey interview. The respondent’s sex and age are also included as controls, as both have been linked to confidence in science (Gauchat, 2012) and respondent demeanor. Sex is coded as (0) Male and (1) Female. Age is measured continuously from 18 to 89, with 89 representing 89 and older. The analysis accounts for any time trend in survey respondent cooperation by including a measure representing the year of the GSS survey each respondent is included in. This is treated as a continuous measure coded as 2004 subtracted from the survey year (i.e. 2004 = 0).
Finally, because the outcome of interest (i.e. respondent demeanor) is assigned by the survey interviewer and interviewers completed more than one interview, there could be interviewer effects in ratings of respondent demeanor. Some of these interviewer effects could relate to factors that the GSS documents, such as interviewer age, sex, race, and experience. However, some of these interviewer effects could be related to unmeasured factors, such as the interviewer’s religion, job satisfaction, or personality. To account for the role of both measured and unmeasured interviewer differences the analysis includes interviewer fixed effects. In effect, then, the analysis examines the hypotheses within each interviewer’s assignment of his or her respondents’ demeanor. A total of 224 interviewers produced the 10,588 interviews examined in this analysis.
Missing data
The 2004–2016 GSS includes a total of 10,588 respondents. As is typical, there are missing data on many of the measures included in the analysis. The greatest rate of missing data is found in the religious tradition measure (N = 646, 6.1%) and the confidence in the scientific community measure (N = 475, 4.4%). All of the other measures’ missing data proportions are below 2%. Complete case analysis, or listwise deletion of cases with missing values, can introduce biases (Graham, 2009). To avoid this, multiple imputation using chained equations (m = 10) is used to make use of the full 10,588 cases. 4
Analytic strategy
As with past studies (e.g. Brennan and London, 2001), the analysis treats interviewers’ ratings of respondent cooperativeness as ordinal in nature. Specifically, ordered logistic regression models are utilized. The associations are presented in the form of odds ratios, so that those above 1 represent an increase in the odds of a respondent being rated as having a more positive demeanor (i.e. friendly, cooperative) and those below 1 represent a decrease in the odds of a respondent being rated as having a positive demeanor.
Results
Table 1 shows descriptive statistics for all the measures used in the analysis. As seen in this table, the large majority (80.40%) of respondents are rated by interviewers as friendly and interested in the survey interview. Another 16.04% of respondents are rated as cooperative but not particularly interested, while 3.54% are rated as impatient and restless or hostile toward the interview. There are, of course, selection effects at work in these distributions. That is, potential respondents who are hostile will rarely participate in the interview at all. Those individuals who actually become respondents will tend to be drawn from those who will likely be rated as at least cooperative if not friendly and interested. Examining the three confidence in institutions measures, we see that the scientific community receives higher ratings of confidence (mean = 2.34) by the public than education (2.10) and the press (1.64).
Descriptive statistics.
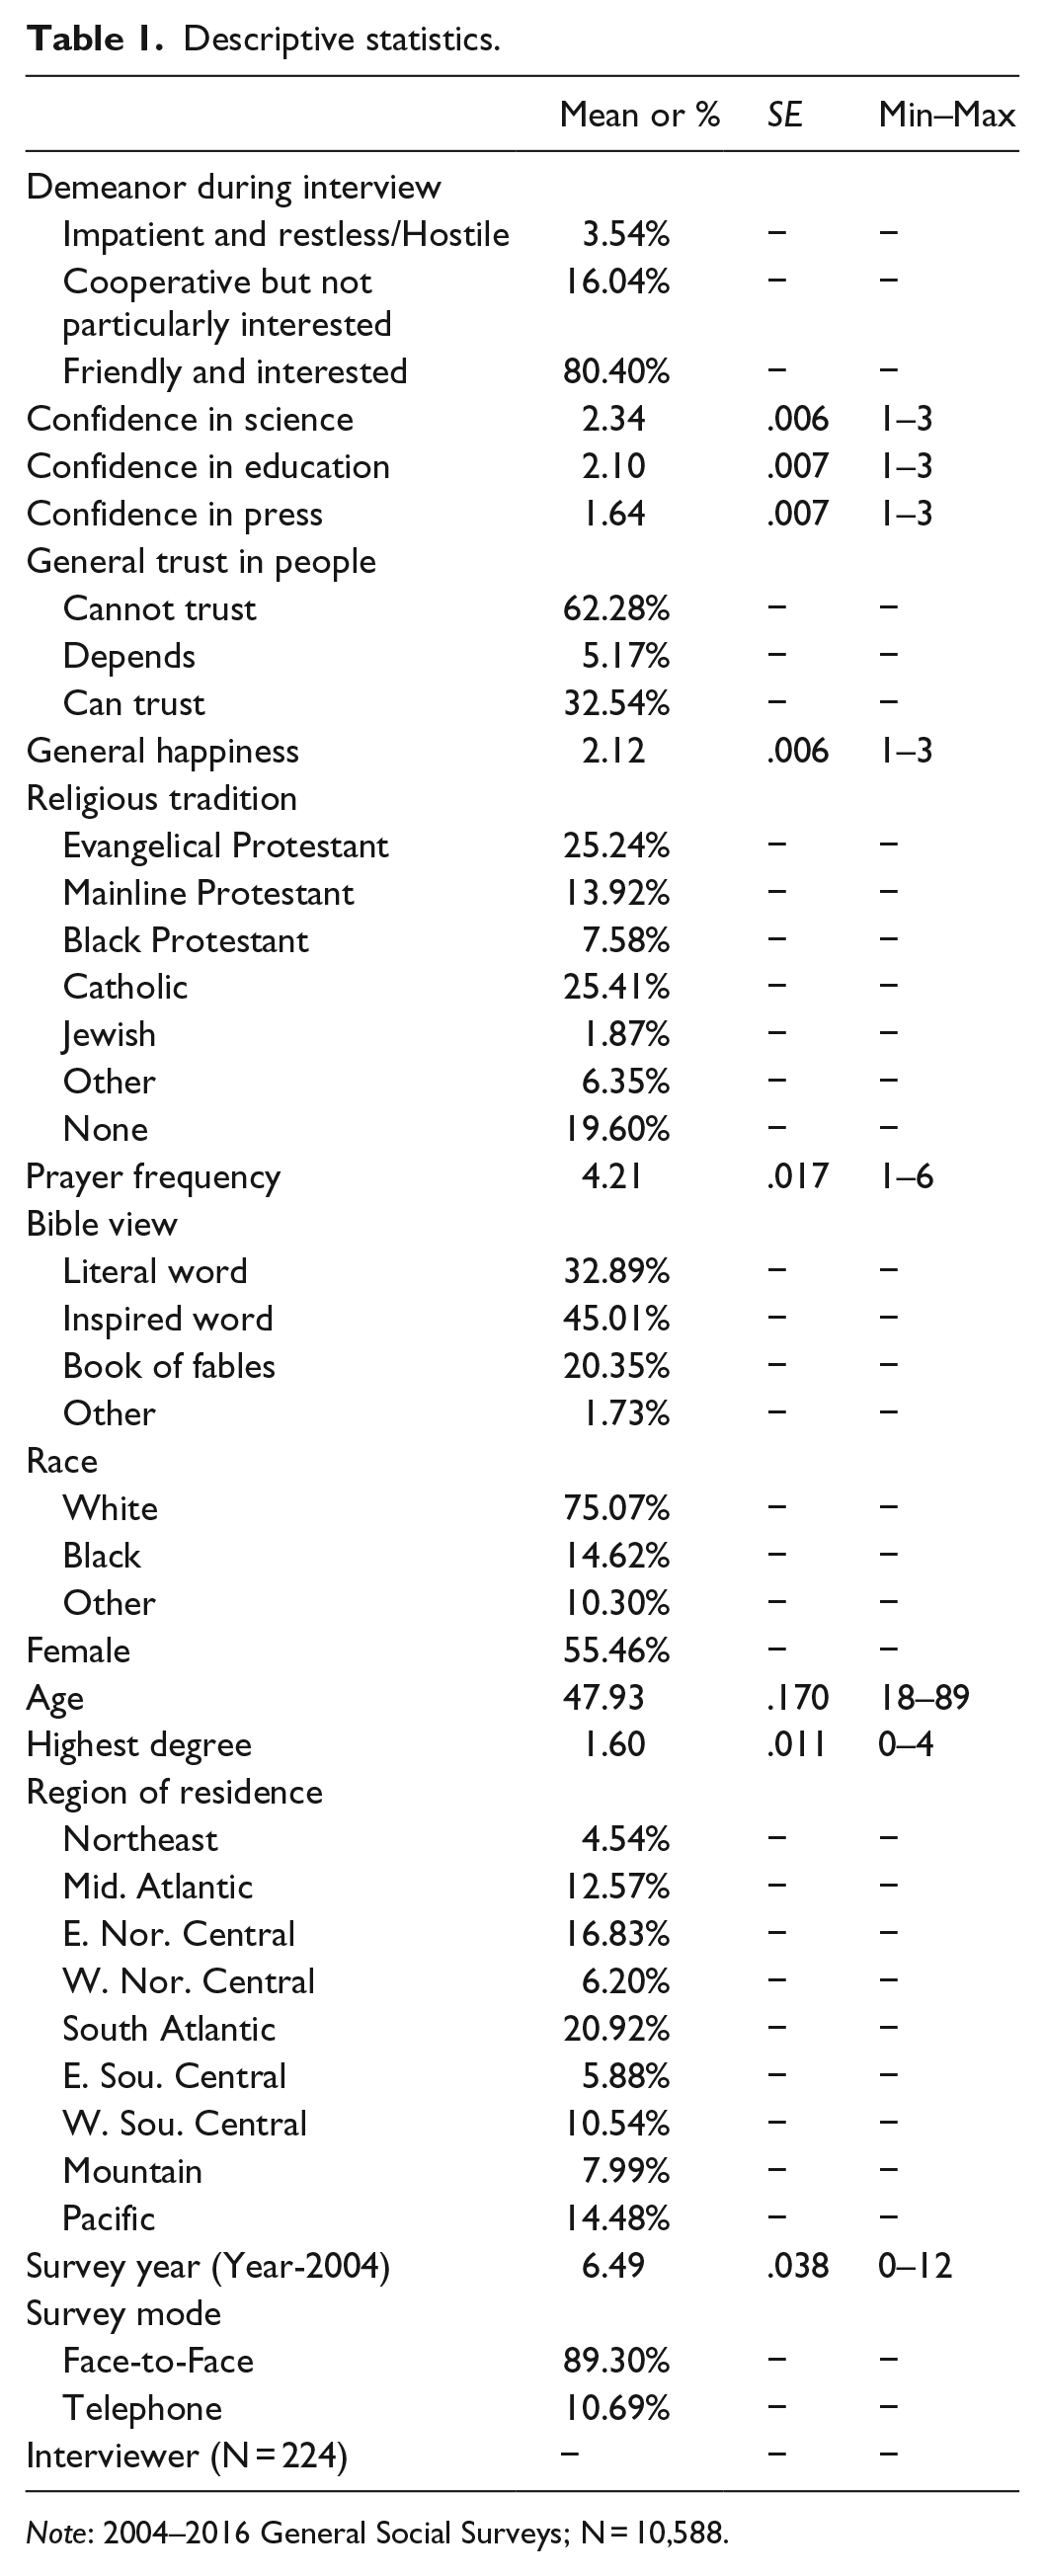
Note: 2004–2016 General Social Surveys; N = 10,588.
Confidence in scientific community and respondent demeanor
Is a respondent’s confidence in the scientific community positively associated with his or her attitude or demeanor during the survey interview? To being examining Hypothesis 1, Table 2 presents the unadjusted ratings of respondent demeanor by his or her confidence in the scientific community. As seen in this table, 84.75% of respondents reporting a great deal of confidence in the scientific community are rated as being friendly and interested during the interview. This compares to 78.22% of those respondents reporting only some confidence in the scientific community and 70.73% of those respondents saying they have hardly any confidence in the scientific community. The 95% confidence intervals for each of these percentages do not overlap, indicating that these gaps are statistically significant. But is this association between respondent demeanor and his or her confidence in the scientific community independent of other factors, such as education, religion, or generalized trust? To address this question Table 3 presents a multivariate analysis controlling for all the measures described earlier.
Unadjusted ratings of respondent demeanor by confidence in scientific community.
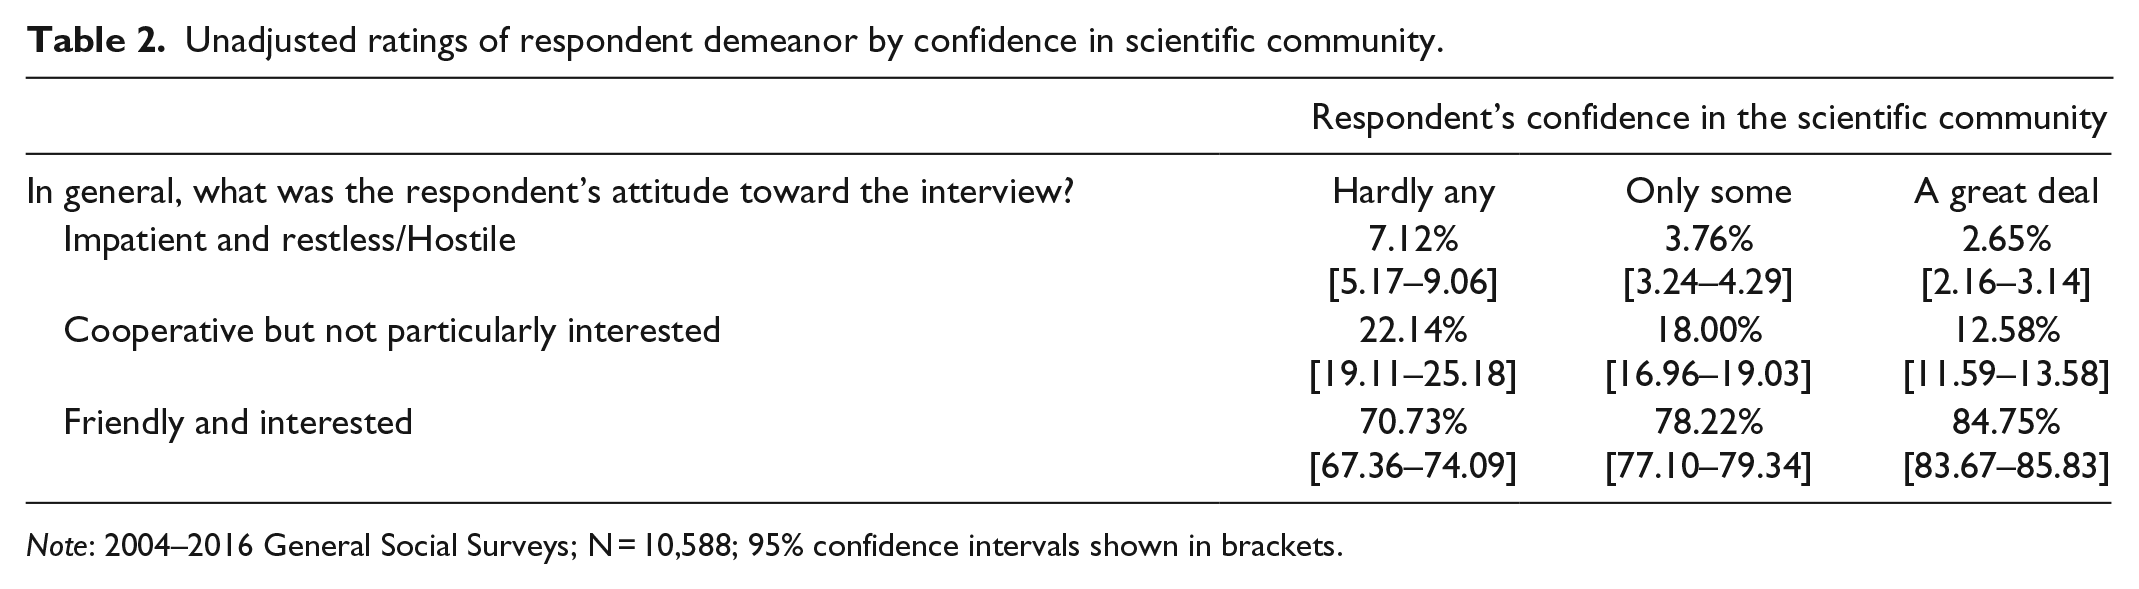
Note: 2004–2016 General Social Surveys; N = 10,588; 95% confidence intervals shown in brackets.
Ordered logistic regression examining confidence in scientific community’s association with survey respondent’s demeanor during survey interview.
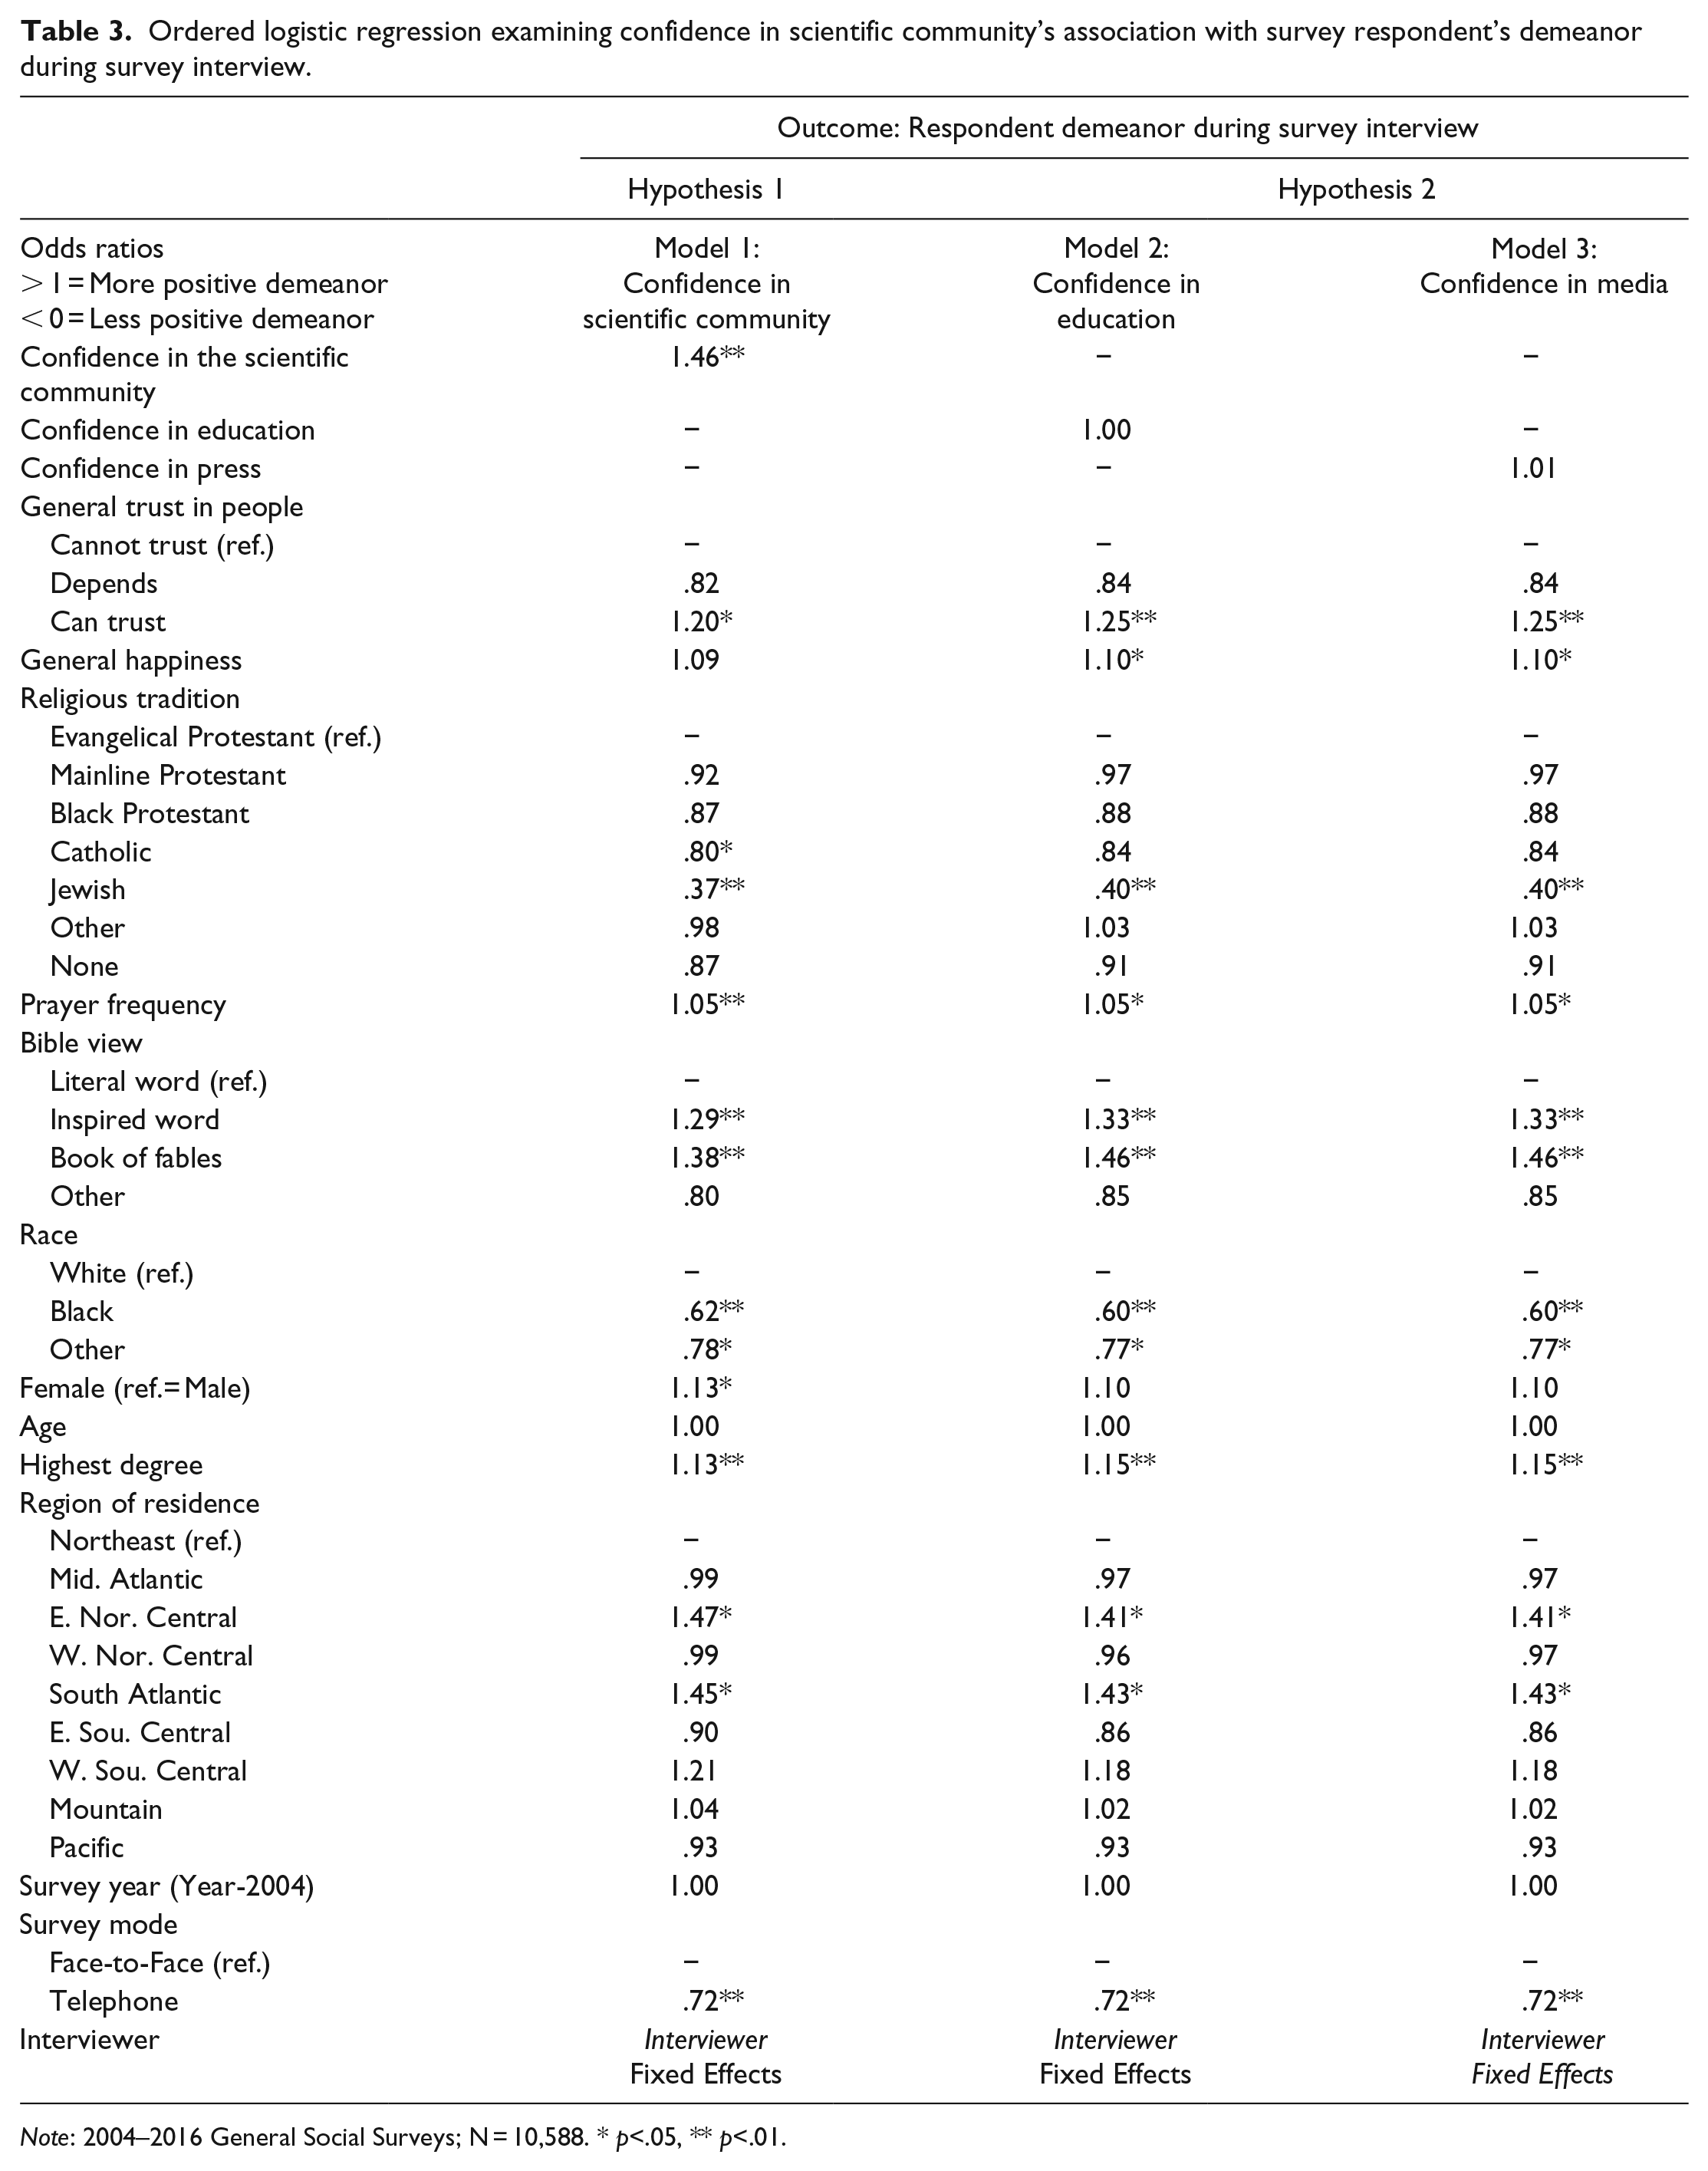
Note: 2004–2016 General Social Surveys; N = 10,588. * p<.05, ** p<.01.
Model 1 in Table 3 presents the results from an ordered logistic regression analysis predicting the respondent’s demeanor as a function of his or her confidence in the scientific community. The results are shown in the form of odds ratios, so that ratios above 1 represent an increase in the odds of having a more positive demeanor while ratios below 1 represent a decrease in the odds of having a more positive demeanor. Of most interest, we find that a respondent’s confidence in the scientific community is associated with a more positive demeanor, as rated by the interviewer, net of the respondent’s education, demographics, trust others, and other characteristics. This provides support for Hypothesis 1.
Looking at the other results found in Model 1, we find that those respondents reporting generalized trust in people have increased odds of being rated as having a positive demeanor compared to those saying that people cannot be trusted. Generalized happiness, however, is not significantly associated with respondent demeanor. As with past research, the analysis finds that non-Whites tend to be rated as having less positive demeanors as compared to Whites. Also, women are rated as having more positive demeanors as compared to men. The analysis does not show any significant age differences. Higher levels of education, though, are significantly associated with a more positive demeanor. This corresponds to the findings of previous studies.
Examining the religion-related measures, which much of the past research on respondent demeanor has focused on, the analysis shows a positive association between prayer and more positive demeanor. It also shows that respondents who are not biblical literalists are rated more positively compared to biblical literalists. Both of these findings were expected based on past research (Morgan, 1983; Sherkat, 2007). The analysis also finds that, compared to Evangelical Protestants, Catholic, and Jewish respondents have lower odds of being rated as friendly and interested in the survey interview net of. It is not clear exactly what could be driving these differences.
Looking at the regional indicators, we see that respondents in the East North Central and South Atlantic states have higher odds of being rated as having a positive demeanor as compared to respondents in the Northeast states. No significant survey year associations are found. However, respondents interviewed over the phone have a significantly lower likelihood of being rated as friendly and interested relative to the base outcome. This is what was expected given the findings of past studies (Holbrook et al., 2003; Irvine et al., 2012).
To summarize the primary finding of interest, Figure 1 presents predicted probabilities for a respondent being rated as friendly and interested by their confidence in the scientific community based on model 1 while holding other measures constant. We can see in this figure again that those expressing hardly any confidence in the scientific community are significantly less likely to be rated as friendly and interested by interviewers than those expressing a great deal of confidence in the scientific community.
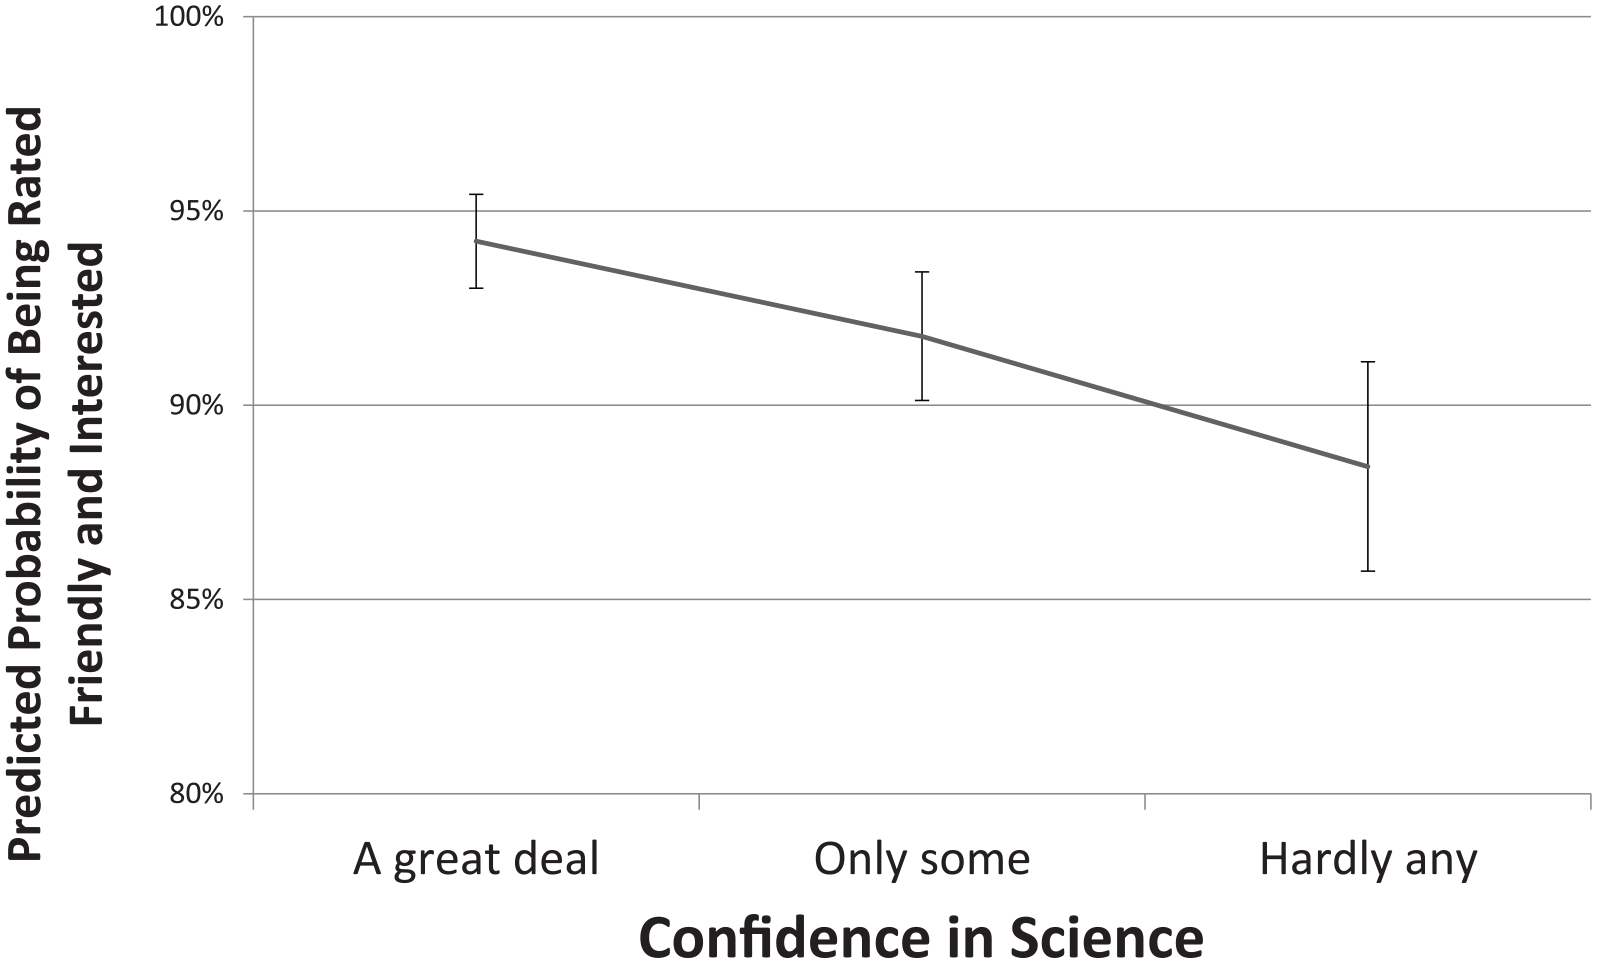
Predicted probability of survey respondent being rated as friendly and interested by interviewer by respondent confidence in scientific community.
Confidence in science or confidence in institutions?
The analysis so far supports the hypothesis that an individual’s confidence in the scientific community shapes his or her attitude toward a survey interview. But what if these science-specific findings are simply a proxy for an individual’s more general confidence in social institutions? To consider this possibility, analyses were conducted to assess whether a respondent’s confidence in other institutions were associated with his or her demeanor toward the survey interview.
Models 2 and 3 in Table 3 present the results for the respondent’s confidence in the education and confidence in the press. Both tables show that neither of these other forms of institutional confidence have a significant association with the respondent’s attitude toward the survey interview. This is, of course, in contrast to the significant association found for the respondent’s confidence in the scientific community in Model 1. This suggests that the link between a respondent’s confidence in the scientific community and his or her demeanor during the interview is not simply some byproduct of overall confidence in institutions. Rather, confidence in the scientific community appears to be uniquely driving respondents’ demeanor during the survey interview. This supports Hypothesis 2.
Alternative specifications and robustness checks
Although research such as this often presents a single final set of results, there are always numerous alternative models that have and can be examined (Young, 2009). To address some of this model uncertainty, I briefly describe some of the alternative specifications and checks that were examined. First, while education and the press were chosen as institutional comparisons for Hypothesis 2 due to their potential connections to survey research and the scientific community, analyses considering other institutions were also conducted. These included the respondent’s confidence in organized religion, banks and financial institutions, major companies, and the executive branch of the federal government. None of these other measures of confidence shows the associations seen with the confidence in the scientific community measure. Finally, analyses were conducted that extended the period of observation back to 1984 by excluding the interviewer identification measure that was not available until 2004. These models supported the same conclusion regarding the association between respondent’s confidence in the scientific community and his or her demeanor during the survey interview.
Discussion
Much of social scientists’ research relies on garnering the cooperation of individuals to participate as research subjects. That participation often comes in the form of a survey interview. Given the dependency of research on this cooperation, it is no surprise that significant efforts have been taken to understand and increase that cooperation (Slauson-Blevins and Johnson, 2016; Watanabe et al., 2017). These efforts include improving the incentives offered respondents (Mercer et al., 2015), improving the mechanics of survey administration and aesthetics of survey instruments (Dillman, 1978, 1991; Smyth et al., 2014), and improving interviewers’ skills at requesting cooperation (Maynard et al., 2010). It is also no surprise that the trend of individuals increasingly refusing to participate in surveys is of such concern to social scientists (Curtin et al., 2005; Meyer et al., 2015; Presser and McCulloch, 2011).
This study’s findings provide insight into a previously unexamined influence on individuals’ willingness to cooperate in survey research. In discussing the reasons why individuals do or do not want to cooperate in a survey, Brick and Williams (2013) argue that individuals are often
unaware of the cognitive processes that lead to many decisions. They might give lack of interest or lack of time simply to end the discussion . . . if we want to know the real reasons for nonresponse, we must find other ways of studying underlying motivations. (p. 54)
This study shows that one of those underlying motivations is the individual’s confidence in the scientific community and scientific enterprise.
Of course, there are limitations to this study. While we were able to measure an individual’s perceived demeanor or attitude during the survey interview, all of the individuals in these data were ultimately respondents. We cannot say whether confidence in the scientific community affects actual refusals to participate. As noted earlier, this is difficult to accomplish as it would require knowing a respondent’s confidence in the scientific community before asking about participation in the survey. However, past studies have indicated that a respondent’s demeanor is indicative of his or her likelihood of refusing a survey request (Smith, 1984). Future research could also examine how confidence in science’s influence on respondent demeanor might depend on the nature of the survey. The General Social Survey is a relatively intensive survey conducted in-person with a long history and is sponsored by the National Science Foundation. All of this might provide the GSS an aura of scientific-ness that some surveys may not have, thereby heightening the importance of a respondent’s confidence in science.
Beyond its implications for survey research, these findings also have implications for understanding the nature of the scientific community. The boundary defining scientist from non-scientist (or lesser scientist) has long been discussed (Gieryn, 1983). The findings presented here do not tell us whether social scientists are, on their surface, perceived to be part of the scientific community (and other data would suggest that the public does not in fact perceive this). Yet, the findings do show that one of the core methods of many social sciences, survey research, is affected by an individual’s confidence in the scientific community. While individuals might not say that social sciences are “very scientific,” they do seem to connect the process of participating in a survey interview to the scientific enterprise and the scientific community.
Footnotes
Acknowledgements
The author thanks Joseph Baker, Roger Finke, and David Johnson for their feedback on earlier versions of this article.
Declaration of conflicting interests
The author(s) declared no potential conflicts of interest with respect to the research, authorship, and/or publication of this article.
Funding
The author(s) received no financial support for the research, authorship, and/or publication of this article.