
Abstract
Random digit dialing (RDD) telephone sampling, although experiencing declining response rates, remains one of the most accurate and cost-effective data collection methods for generating national population-based estimates. Such methods, however, are inefficient when sampling hard-to-reach populations because the costs of recruiting sufficient sample sizes to produce reliable estimates tend to be cost prohibitive. The authors implemented a novel respondent-driven sampling (RDS) approach to oversample cigarette smokers and lesbian, gay, bisexual, and transgender (LGBT) people. The new methodology selects RDS referrals or seeds from a probability-based RDD sampling frame and treats the social networks as clusters in the weighting and analysis, thus eliminating the intricate assumptions of RDS. The authors refer to this approach as RDD+RDS. In 2016 and 2017, a telephone survey was conducted on tobacco-related topics with a national sample of 4,208 U.S. adults, as well as 756 referral-based respondents. The RDD+RDS estimates were comparable with stand-alone RDD estimates, suggesting that the addition of RDS responses from social networks improved the precision of the estimates without introducing significant bias. The authors also conducted an experiment to determine whether the number of recruits would vary on the basis of how the RDS recruitment question specified the recruitment population (closeness of relationship, time since last contact, and LGBT vs. tobacco user), and significant differences were found in the number of referrals provided on the basis of question wording. The RDD+RDS sampling approach, as an adaptation of standard RDD methodology, is a practical tool for survey methodologists that provides an efficient strategy for oversampling rare or elusive populations.
Keywords
Design-based methods for probability samples in general, and telephone samples in particular, have dominated population-based estimates for half a century (Groves 2011). Ever since telephone coverage surpassed 90 percent in the late 1960s, researchers have chosen random digit dialing (RDD) methodology as one of the most accurate and cost-effective approaches for generating national population-based estimates. Yet RDD methods tend to be inefficient when oversampling rare or elusive populations, because the costs of recruiting sufficient sample sizes to produce reliable estimates far exceed most research budgets. Moreover, marginalized subgroups may underreport their status if there is associated stigma or illegal behavior (Tourangeau, Rips, and Rasinski 2000), leading to even larger recruitment efforts and greater costs.
Over the years, researchers have recruited elusive or hard-to-sample populations using a variety of sampling methods. These include screening methods, disproportionate sampling, multiplicity sampling, use of multiple frames, and network sampling (Flores-Cervantes and Kalton 2008; Kalsbeek 2003; Kalsbeek et al. 2007; Kalton and Anderson 1986; McCormick and Zheng 2014; Thompson 2014; Tourangeau et al. 2014). Respondent-driven sampling (RDS), an example of network sampling, exploits chain referrals over social networks when a sampling frame does not exist (Heckathorn 1997, 2002; Heckathorn, Broadhead, and Sergeyev 2001; Heckathorn and Jeffri 2001; Heckathorn and Magnani 2004; Salganik and Heckathorn 2004). In RDS, respondents’ social relationships provide a method to identify other members of a target population. The initial pool of respondents, called seeds, refer individuals from the target population, who refer others, and so on, thus yielding chains of referrals. The number of targets in each network is adjusted for network size, to reduce the impact of large networks (Filteau, Agans, and Zeng 2017). RDS has been used to survey many hard-to-survey populations, including lesbian, gay, bisexual, and transgender (LGBT) individuals and tobacco users (Arfken, Abu-Ras, and Ahmed 2015; Baggett et al. 2016; Jarvis et al. 2008; Lippert 2017; Mason et al. 2015; Sadasivam et al. 2013; Shariati et al. 2017; Stubera, Galea, and Link 2008); it is suitable for our research endeavor, but with some important modifications.
Traditional RDS procedures typically depend on an initial convenience sample for which selection probabilities are not readily ascertainable. Through repeated waves of face-to-face data collection, the RDS sample expands and reduces its dependence on the initial convenience sample via large sample Markov chain convergence arguments (i.e., equilibrium). Participants recruited after equilibrium is achieved are considered independent of the initial seeds; participants recruited before convergence are excluded. In practice, researchers often assume convergence too soon and exclude only the seeds (Salganik 2006; Volz and Heckathorn 2008). Critics argue that RDS assumptions often go untested, resulting in biased estimates (Gile and Handcock 2010; Gile, Johnston, and Salganik 2015; McCreesh et al. 2012; Tomas and Gile 2011). Gile and Handcock (2015) argued that the bias due to the nonprobabilistic seeds can be reduced by assuming and estimating a random graph model for the network, but correct specification of a network model can be difficult. To avoid these problems, it would be preferable to retain a probabilistic framework by sampling the seeds from a known design.
A novel application of RDS, one that circumvents the limitations mentioned above, is to recruit the target population from a probability-based framework. In our approach, seeds only need to be connected to the target population through social networks; they do not have to belong to the target population as in traditional RDS (Heckathorn 1997). With seeds from a probability sample, RDS assumptions are relaxed. Lee et al. (2011) were among the first to successfully adapt RDS to an RDD methodology and recruit an ethnically diverse sample of respondents at reduced costs; however, their approach was confined to traditional RDS estimation procedures. In our approach, the only criteria needed to be satisfied are that (1) referrers must be able to estimate their network sizes (i.e., the number of target members they know and can refer to the study), and (2) referral reciprocity must be maintained (i.e., the probability that A recruits B is equal to that of B recruiting A). We also assume the social networks are independent, which is a reasonable assumption given that respondents are recruited from national RDD sampling frames. We coin the term “RDD+RDS” to describe supplementing RDD surveys with RDS-type referrals. Many vulnerable groups that have previously been recruited using RDS alone, such as LGBT individuals and tobacco users, could be recruited using a probability-based RDD+RDS approach.
The Present Study
As part of the U.S. Food and Drug Administration and National Institutes of Health support of 14 Tobacco Centers of Regulatory Science, which funds tobacco regulatory science research, our Center for Regulatory Research on Tobacco Communication conducted a nationally representative survey of U.S. adults. The topics included tobacco use, awareness of harmful cigarette chemicals, and exposure to antitobacco messaging (Boynton et al. 2016). Although overall cigarette smoking rates have dropped over the past 10 years, from 20.9 percent in 2005 to 15.1 percent in 2015 (Jamal et al. 2016), such reductions have been much slower in certain vulnerable populations. For example, people without a high school education still smoke at a high rate (25.5 percent in 2005 vs. 24.2 percent in 2015), as do people living in poverty (29.9 percent vs. 26.1 percent) and the LGBT population (2005 missing, 20.6 percent in 2015). Our survey aimed to produce sample sizes greater than 500 for LGBT people and individuals with less than a high school education, greater than 1,000 for current cigarette smokers, and greater than 1,000 for people living below the federal poverty level as defined in the Federal Register (U.S. Department of Health and Human Services 2017). Budget restrictions, however, capped data recruitment at 5,000 individuals, which meant that if we solely used RDD, we would likely fail to meet our target sample size of 1,000 cigarette smokers (assuming that 15.1 percent was the current cigarette smoking rate; 5,000 × .151 = 755) and a target sample of 500 LGBT respondents (assuming that 2.3 percent was the estimated LGBT population rate; 5,000 × .023 = 115) (Ward et al. 2014).
Another challenge for the present study was that the largest LGBT populations resided in the West (e.g., Oregon, California, Nevada, Washington), in the Northeast (e.g., Massachusetts, Vermont, New Hampshire), and in the District of Columbia (Gates 2017). However, the highest cigarette smoking rates were in the South, in such states as West Virginia, Kentucky, Arkansas, Tennessee, Louisiana, and Mississippi (Behavioral Risk Factor Surveillance System 2016). To obtain adequate samples of cigarette smokers, which was more important to the main mission of the project, we decided to oversample low-income, high-cigarette-smoking areas. Consequently, oversampling in these regions ran counter to our goal of reaching LGBT respondents. Therefore, we adapted the RDD+RDS methodology to recruit additional cigarette smokers and, more important, LGBT people.
Method
Sampling and Recruitment
We constructed a cross-sectional sample of adults living in the United States, including Alaska and Hawaii, with oversampling in counties with the highest cigarette smoking rates (Behavioral Risk Factor Surveillance System 2012) and lowest median income levels (Claritas 2014). We implemented two independent and nonoverlapping RDD cellular and landline telephone frames, covering approximately 96 percent of U.S. households (Blumberg and Luke 2017). Cellular numbers were oversampled to increase the participation of young adults (18–25 years of age). To be eligible, the telephone number needed to reach a household with an English- or Spanish-speaking adult (ages 18 and older). Given the older demographics of the landline frame, adults older than 65 were sampled at a lower rate than younger age groups.
Given the novelty of the RDD+RDS approach, no standard method exists for asking referrers to estimate their network compositions and sizes. Consequently, we wanted to explore whether type of friend (friend, good friend, or close friend) and time period in which the person last saw the friend (past 30, 60, or 90 days) affected the number of people referred and then, once referred, the number of people who actually completed the survey. Respondents who self-identified as LGBT were always asked to refer LGBT friends; otherwise, participants were randomly assigned to refer friends who used tobacco products (34 percent of the time) or friends who identified as LGBT (66 percent of the time). Referrals were allowed to make referrals to additional friends, just not back to the people who referred them. We used a two-part question, in which the first part served as a primer: Please think about all the [INSERT TYPE] friends you have seen in the past [INSERT TIME PERIOD] days. Think only about the ones who you could contact and who could contact you. How many would you say you have seen? Feel free to take a minute.
For the tobacco condition, respondents were asked, Now out of those [INSERT # OF FRIENDS & TYPE] friends, how many would you say smoke or use tobacco products? (NUMBER BETWEEN 0-99)
For the LGBT condition, respondents were read the following: I’ll use the term LGBT to refer to lesbian, gay, bisexual, and transgender people. Because so many people in the LGBT community smoke and we want to work on that, we are trying to talk to as many LGBTs as possible. So out of those [INSERT # OF FRIENDS & TYPE] friends, how many would you say are lesbian, gay, bisexual or transgender also referred to as LGBT? (NUMBER BETWEEN 0-99)
Under both referral conditions, respondents could nominate up to three friends and were paid an additional $10 for each referral who completed the survey. Source of referral contact (i.e., the referrer’s first name) was mentioned to a contact if allowed by the referrer to enhance study credibility and recruitment efforts; otherwise, the referral call was treated as a cold call or like any other random number. Interviewers were blind to referral condition (LGBT or tobacco user), and referrals needed to self-identify as LGBT or cigarette smokers to be identified as such in our sample. For confidentiality purposes, we did not identify referrals as belonging to the tobacco-user or LGBT group. We also checked the file for duplicate telephone numbers to make sure no one completed the survey more than once. All respondents were offered $40 for participation in the survey to increase response rates and offset any cell phone charges they might incur.
Survey Measures
In the interest of comparing our findings with previous survey results, most of the survey measures and procedures deployed here mirror those used in a prior investigation (Boynton et al. 2016). We made minor changes to some measures to keep them current. For example, we updated income levels used to determine poverty status according to 2016 poverty guidelines (U.S. Department of Health and Human Services 2016). On the basis of recommendations from the Williams Institute, we also changed our measure of sex by replacing it with a measure of sex assigned on the original birth certificate and added a measure of current gender identity (GenIUSS Group 2014). These changes allowed us to identify transgender people, who are especially vulnerable to tobacco use but often invisible in survey research. Sexual identity was ascertained by asking respondents to self-identify as (1) straight or heterosexual, (2) gay or lesbian, (3) bisexual, or (4) other (to be specified).
Data Collection
The telephone survey was fielded August 15, 2016, through May 3, 2017, with an average interview length of 26 min. Interviews were conducted in CATI Version 4.8 (Statistics Netherlands, Voorburg/Heerlen, the Netherlands) and were actively managed Saturday through Thursday between the hours of 9 a.m. and 9 p.m. All interviewers completed general and study-specific training before calling telephone numbers in the sample and were monitored twice every two weeks. Numbers were called a minimum of six (cell phone) or eight (landline) times and given at least one weekend, evening, and daytime attempt before being closed out. The weighted response rate (RR4) was 38.7 percent (AAPOR 2016) and comparable with the 2013 to 2014 National Adult Tobacco Survey (CDC 2017) at 36.1 percent. The sample yielded 4,964 interviews, including 756 referrals. Minus the referrals, we used 121,225 telephone numbers, with 2,669 refusals (eligible but no interview), 73,067 ineligibles (e.g., nonworking numbers, businesses, institutions), and 41,281 unknown cases for which eligibility could not be ascertained (e.g., ring, no answers; pick-up/hang-ups; incomplete screeners). Informed consent was read to the respondents and recorded verbally prior to the interview. The University of North Carolina at Chapel Hill institutional review board approved the study protocol (IRB #13-2779).
Sampling Weights and Adjustments
We produced two national data sets: (1) adult RDD only (n = 4,208) and (2) RDD plus referrals via modified RDS (n = 4,964). Given that RDD+RDS is a new procedure, we compared the two weighted samples to ensure comparability between the two approaches. Because RDD methodology produces unbiased estimators (Kish 1965), we can infer that similar or comparable RDD+RDS estimates are unbiased as well.
Following the three-step procedure proposed by Kalsbeek and Agans (2008), we computed base weights using the sampling rate for telephone numbers per stratum, adjusting for the number of potential respondents and number of phone lines, as well as any undersampling of older adults. Strata were based on the oversampling strategy (county smoking rate by median income level); sample sizes less than 10 were collapsed with similar strata to avoid unstable cell sizes during analysis. Following procedures outlined by Selvaraj et al. (2016), referral base weights were multiplied by the base weight of the person who referred them, which was also adjusted by selection probabilities for the referrals given (see equation 1):

where wiRDS is the adjusted base weight for an RDS participant, wiR is the base weight for the person who referred that participant (whether RDD or RDS), Ri represents the number of referrals the referrer provided, and ni represents the network size of the referrer. Ri adjusts chance of selection (1/Ri is the sampling probability), and ni is divided to adjust the multiplicity of reaching the referral from a person’s network. Finally, RDS base weights were cumulative: the base weight for each RDS participant was the weight of the person who referred them multiplied by the Ri/ni adjustment. This completed step 1. Differential household-level nonresponse was adjusted using the inverse of the stratum-specific household-level response rate as the adjustment factor. Nonresponse weights were trimmed using a procedure developed by Potter (1988) (step 2). The third step calibrated the nonresponse-adjusted household weight to the American Community Survey (ACS) (ACS 2011–2015) by implementing an SAS raking macro (Izrael, Battaglia, and Frankel 2009) on the following variables: census region, age (18–24, 25–44, 45–64, and 65 or older), education (high school or less, some college, or bachelor’s degree and above), sex, ethnicity (Hispanic vs. non-Hispanic), phone type (cell vs. landline) as defined by Blumberg and Luke (2017), and regional and LGBT cigarette smoking rates (Jamal et al. 2016). The last adjustment (LGBT smoking rate) was needed only for the RDD+RDS data set to control for the LGBT oversampling. Final weights were normalized to the total sample size so as not to artificially inflate the degrees of freedom in our analyses (Flores-Cervantes and Kalton 2008).
RDD+RDS Inference
Accounting for the nonindependence of the referral chains in the weighting process requires certain assumptions. Suppose the original population consists of N subjects with attributes Y1, . . ., YN. We recast an RDS design (K waves) into a cluster sampling design in an “expanded” population. In this expanded population, there are chained clusters of size K, and each cluster is a distinct chain (i1, i2, . . ., iK), where each ij is in the social network of ij−1, denoted by N(ij−1). Furthermore, in this expanded population, associated with each chain, the new attributes for the cluster are

where
We assume the symmetry of the network, that is,

For the jth term in this summation, using the symmetry assumption, we have


Hence, the total summation of the new attributes is the same as the total summation of Y values.
With the expanded population and new attributes, the RDD+RDS design can be treated as multistage cluster sampling to select a chain from this expanded population. In the first stage, each cluster consists of all chains with the same initial seed i1, so we are sampling a cluster based on p(i1). Within each cluster, all chains are grouped into subclusters with the same second unit i2 in the chain, from which we take a subcluster with sampling probability p(i2|i1). In turn, we continue to sample further subclusters until only unit iK is at the end. In other words, RDD+RDS design is a multistage cluster sampling design on the expanded population, and sampling probability at jth-level cluster is given by p(i1)p(i2|i2) . . . p( ij |ij–1). With this equivalence, we then apply standard survey package procedures for cluster sample designs for our inference to estimate the population total of new attributes, which is the same as the total of original attributes in the original population based on equation 7.
Statistical Analyses
Our analyses took the sample design feature into account and were computed using the survey procedures in SAS Version 9.4 (SAS Institute, Cary, North Carolina). Weighted sample means and proportions with 95 percent confidence intervals were provided unless otherwise specified. We used an additional cluster statement to account for nonindependence of referrals (756 friends). We compared weighted estimates with the five-year ACS estimates (ACS 2011–2015). The ACS served as a good benchmark because the sample size is large (more than 3.5 million households enrolled each year), the response rate is high (more than 90 percent), and the margins of error are small (±0.1).
To examine the results of our experiment, we conducted a 3 × 3 × 2 between-subjects analysis of variance on participant referrals looking for differences in the three friend types, three time periods, and two types of referrals manipulated in the RDS recruitment. The dependent variables of interest were the number of tobacco users or LGBT individuals the respondent referred to the study and, more important, the number of people who completed the survey once they were referred by a friend. Post hoc comparisons of least squared means used Scheffé test.
Results
Basic Adult Demographics
Sample size comparisons between RDD and RDD+RDS demonstrated that our oversampling approach was successful (see Table 1). In RDD, the recruitment of respondents with less than a high school education (n = 468), living below poverty (n = 834), LGBT individuals (n = 192), and smokers (n = 973) fell below our recruitment goals. In contrast, RDD+RDS met all our recruitment goals: respondents with less than a high school education (n = 536), living below poverty (n = 1,007), LGBT individuals (n = 520), and cigarette smokers (n = 1,325). Oversampling in low-income and high-cigarette-smoking areas, however, resulted in overrepresentation in the South census region, where roughly 62 percent of respondents resided.
RDD and RDD+RDS Adult Demographic Characteristics Compared with U.S. National Estimates
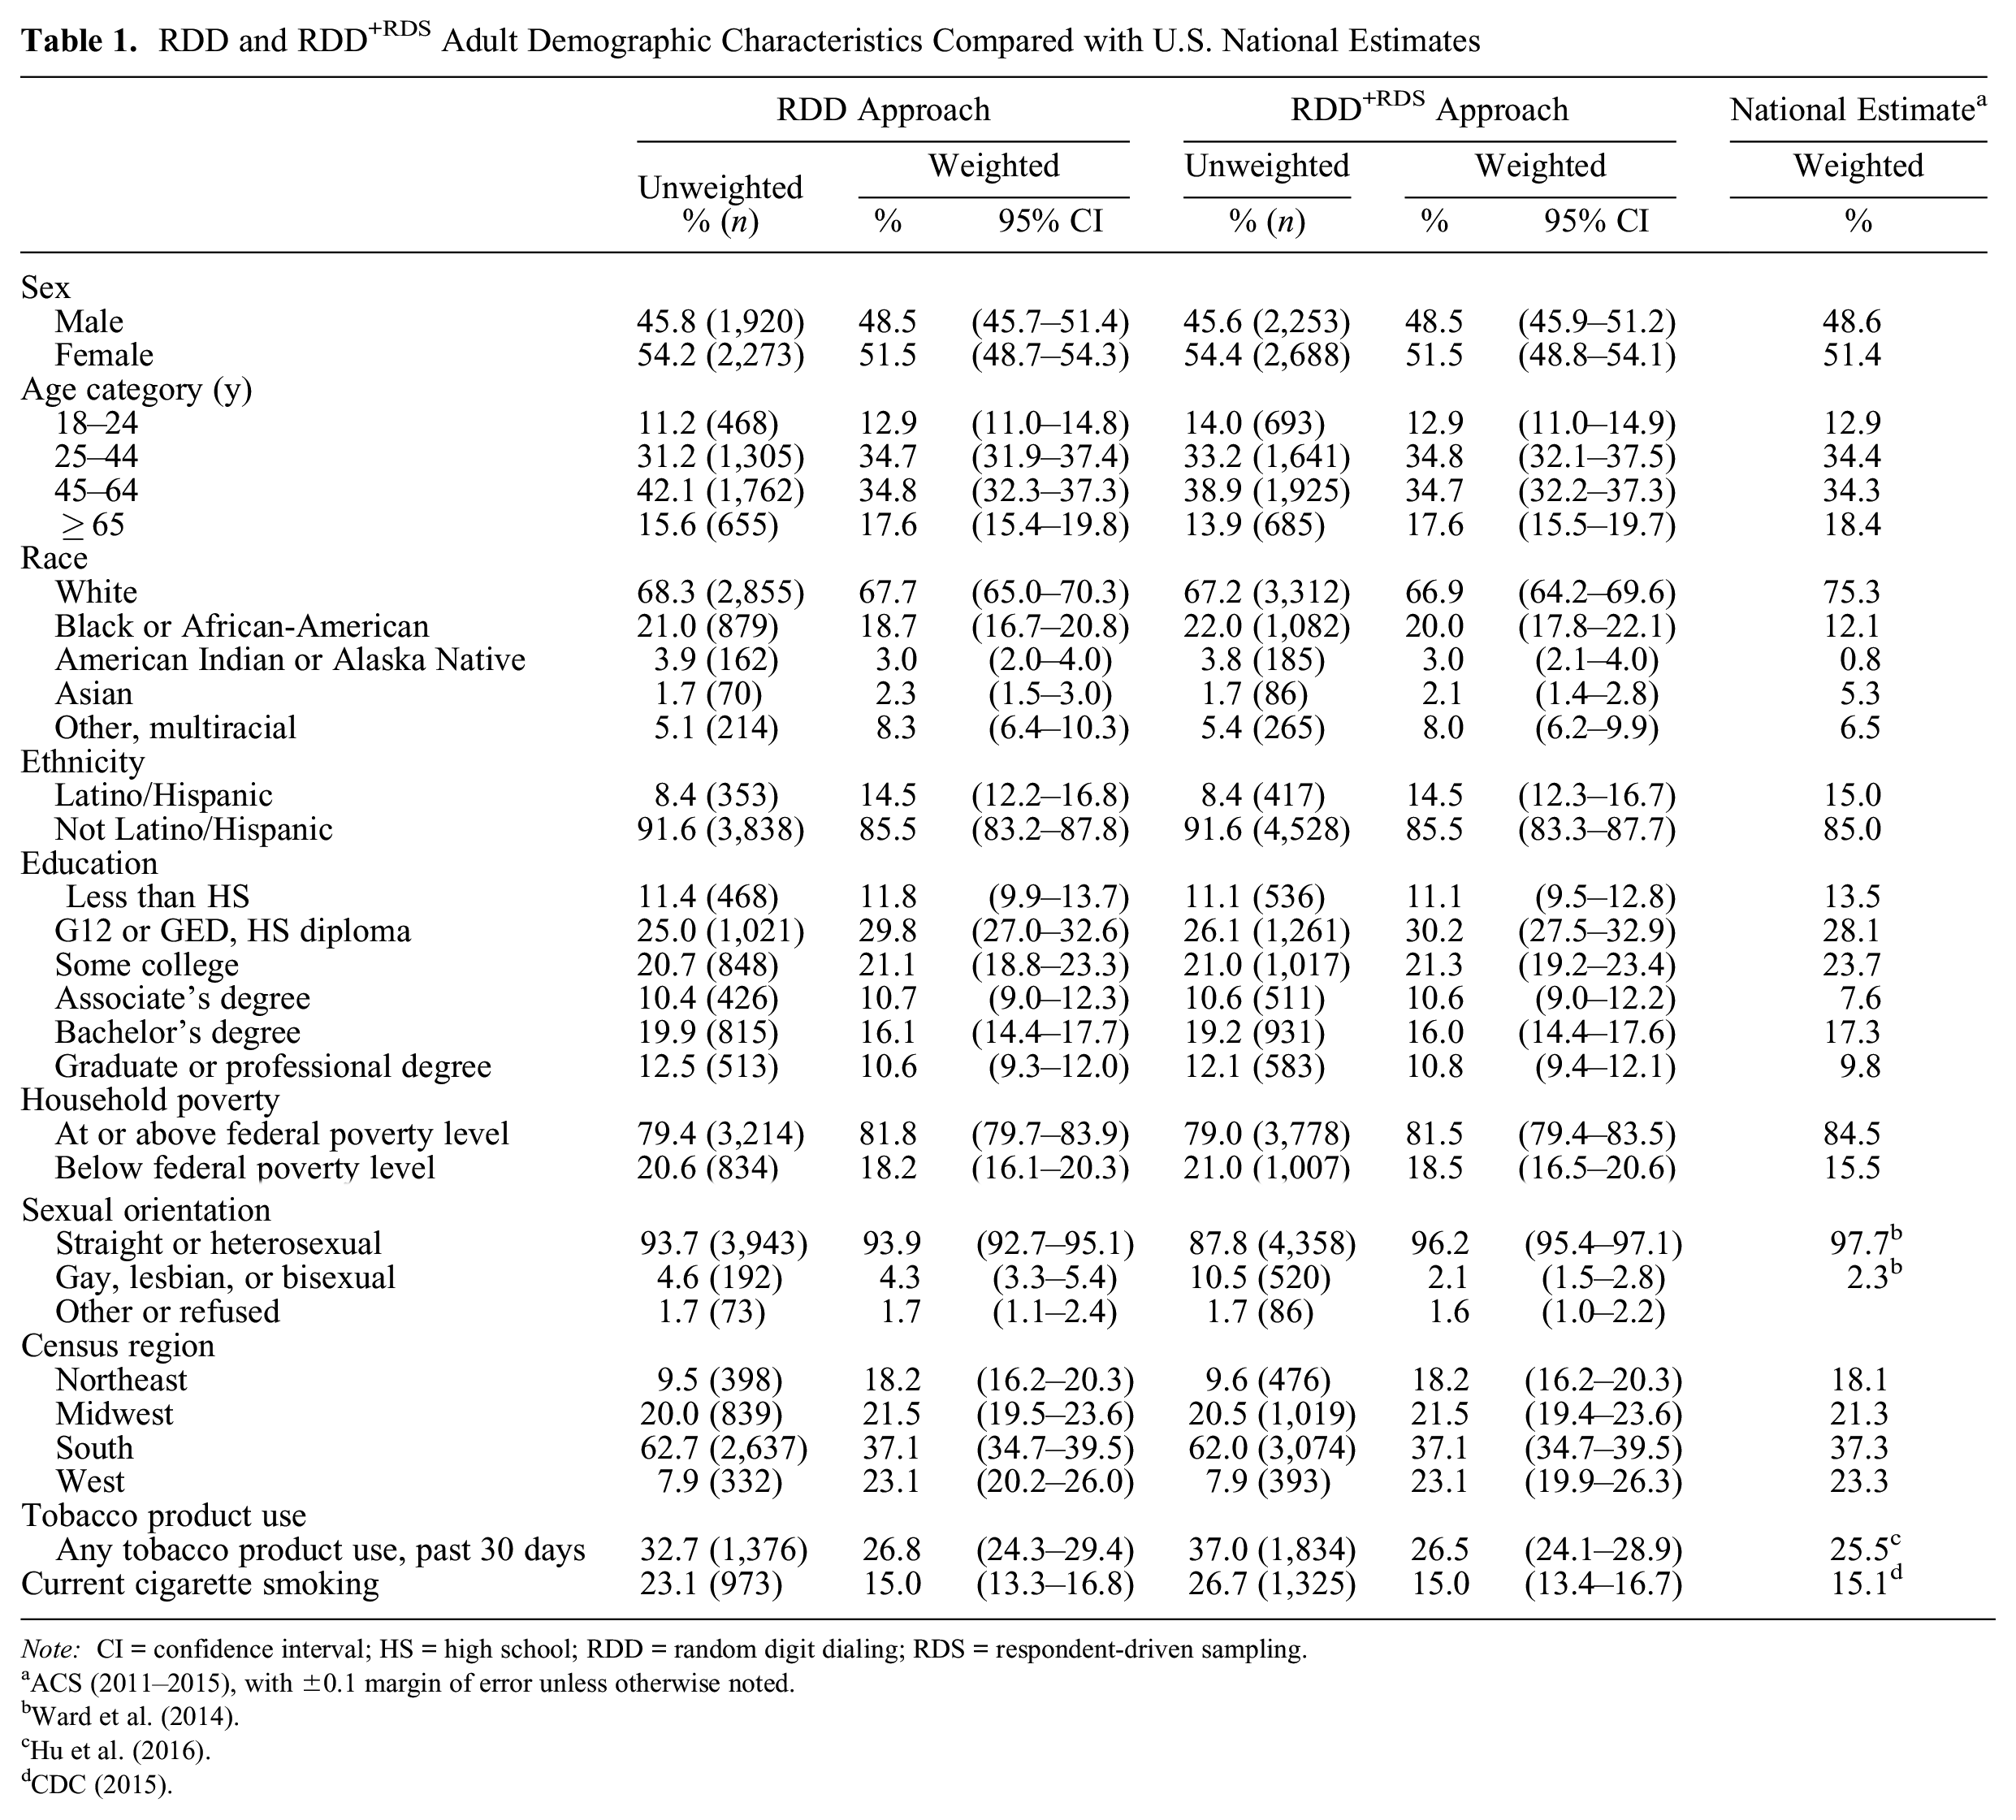
Note: CI = confidence interval; HS = high school; RDD = random digit dialing; RDS = respondent-driven sampling.
ACS (2011–2015), with ±0.1 margin of error unless otherwise noted.
Examination of the weighted estimates, compared with a national standard, demonstrated that sex, age, ethnicity, census region, and current cigarette smoking status were adequately adjusted using the weighting process (ACS 2011–2015; CDC 2015; Hu et al. 2016; Ward et al. 2014). When comparing RDD and RDD+RDS with national estimates, our sampling approaches yielded some underrepresentation of white respondents (RDD 67.7 and RDD+RDS 66.9 vs. national estimate 75.3), Asian respondents (2.3 and 2.1 vs. 5.3), less than high school education (11.8 and 11.1 vs. 13.5) and some college (21.1 and 21.3 vs. 23.7), with overrepresentation of African-American (18.7 and 20.0 vs. 12.1) and American Indian/Alaska Native (3.0 and 3.0 vs. 0.8) respondents.
Cigarette Smoking Estimates
The Centers for Disease Control and Prevention annually uses data from the National Health Interview Survey (NHIS) to estimate current cigarette smoking among adults, stratified by several key demographic characteristics. In 2015, the NHIS conducted 33,672 face-to-face interviews with adults older than 18 and obtained a 55.2 percent response rate (Jamal et al. 2016). We used NHIS estimates to evaluate the precision of our estimates and the equivalency of RDD and RDD+RDS estimates. If RDD and RDD+RDS estimates were similar (i.e., within confidence bounds), we considered them equivalent. In Table 2, most RDD minus RDD+RDS point estimates were within 1 percentage point, with the exception of African-American (1.2 percent), American Indian/Alaskan Native (1.9 percent), and multiracial (1.1 percent) respondents. Therefore, we considered estimates from the RDD and RDD+RDS to be equivalent. When comparing the RDD+RDS estimates with the 2015 NHIS estimates, 15 of 26 estimates were within the national margin of error, 9 of the other national point estimates were within the confidence levels produced by our study, and 2 estimates eluded both surveys, which could be accounted for by chance alone.
Percentage of Adult Smokers by Selected Demographic Characteristics Compared with U.S. National Cigarette Smoking Estimates
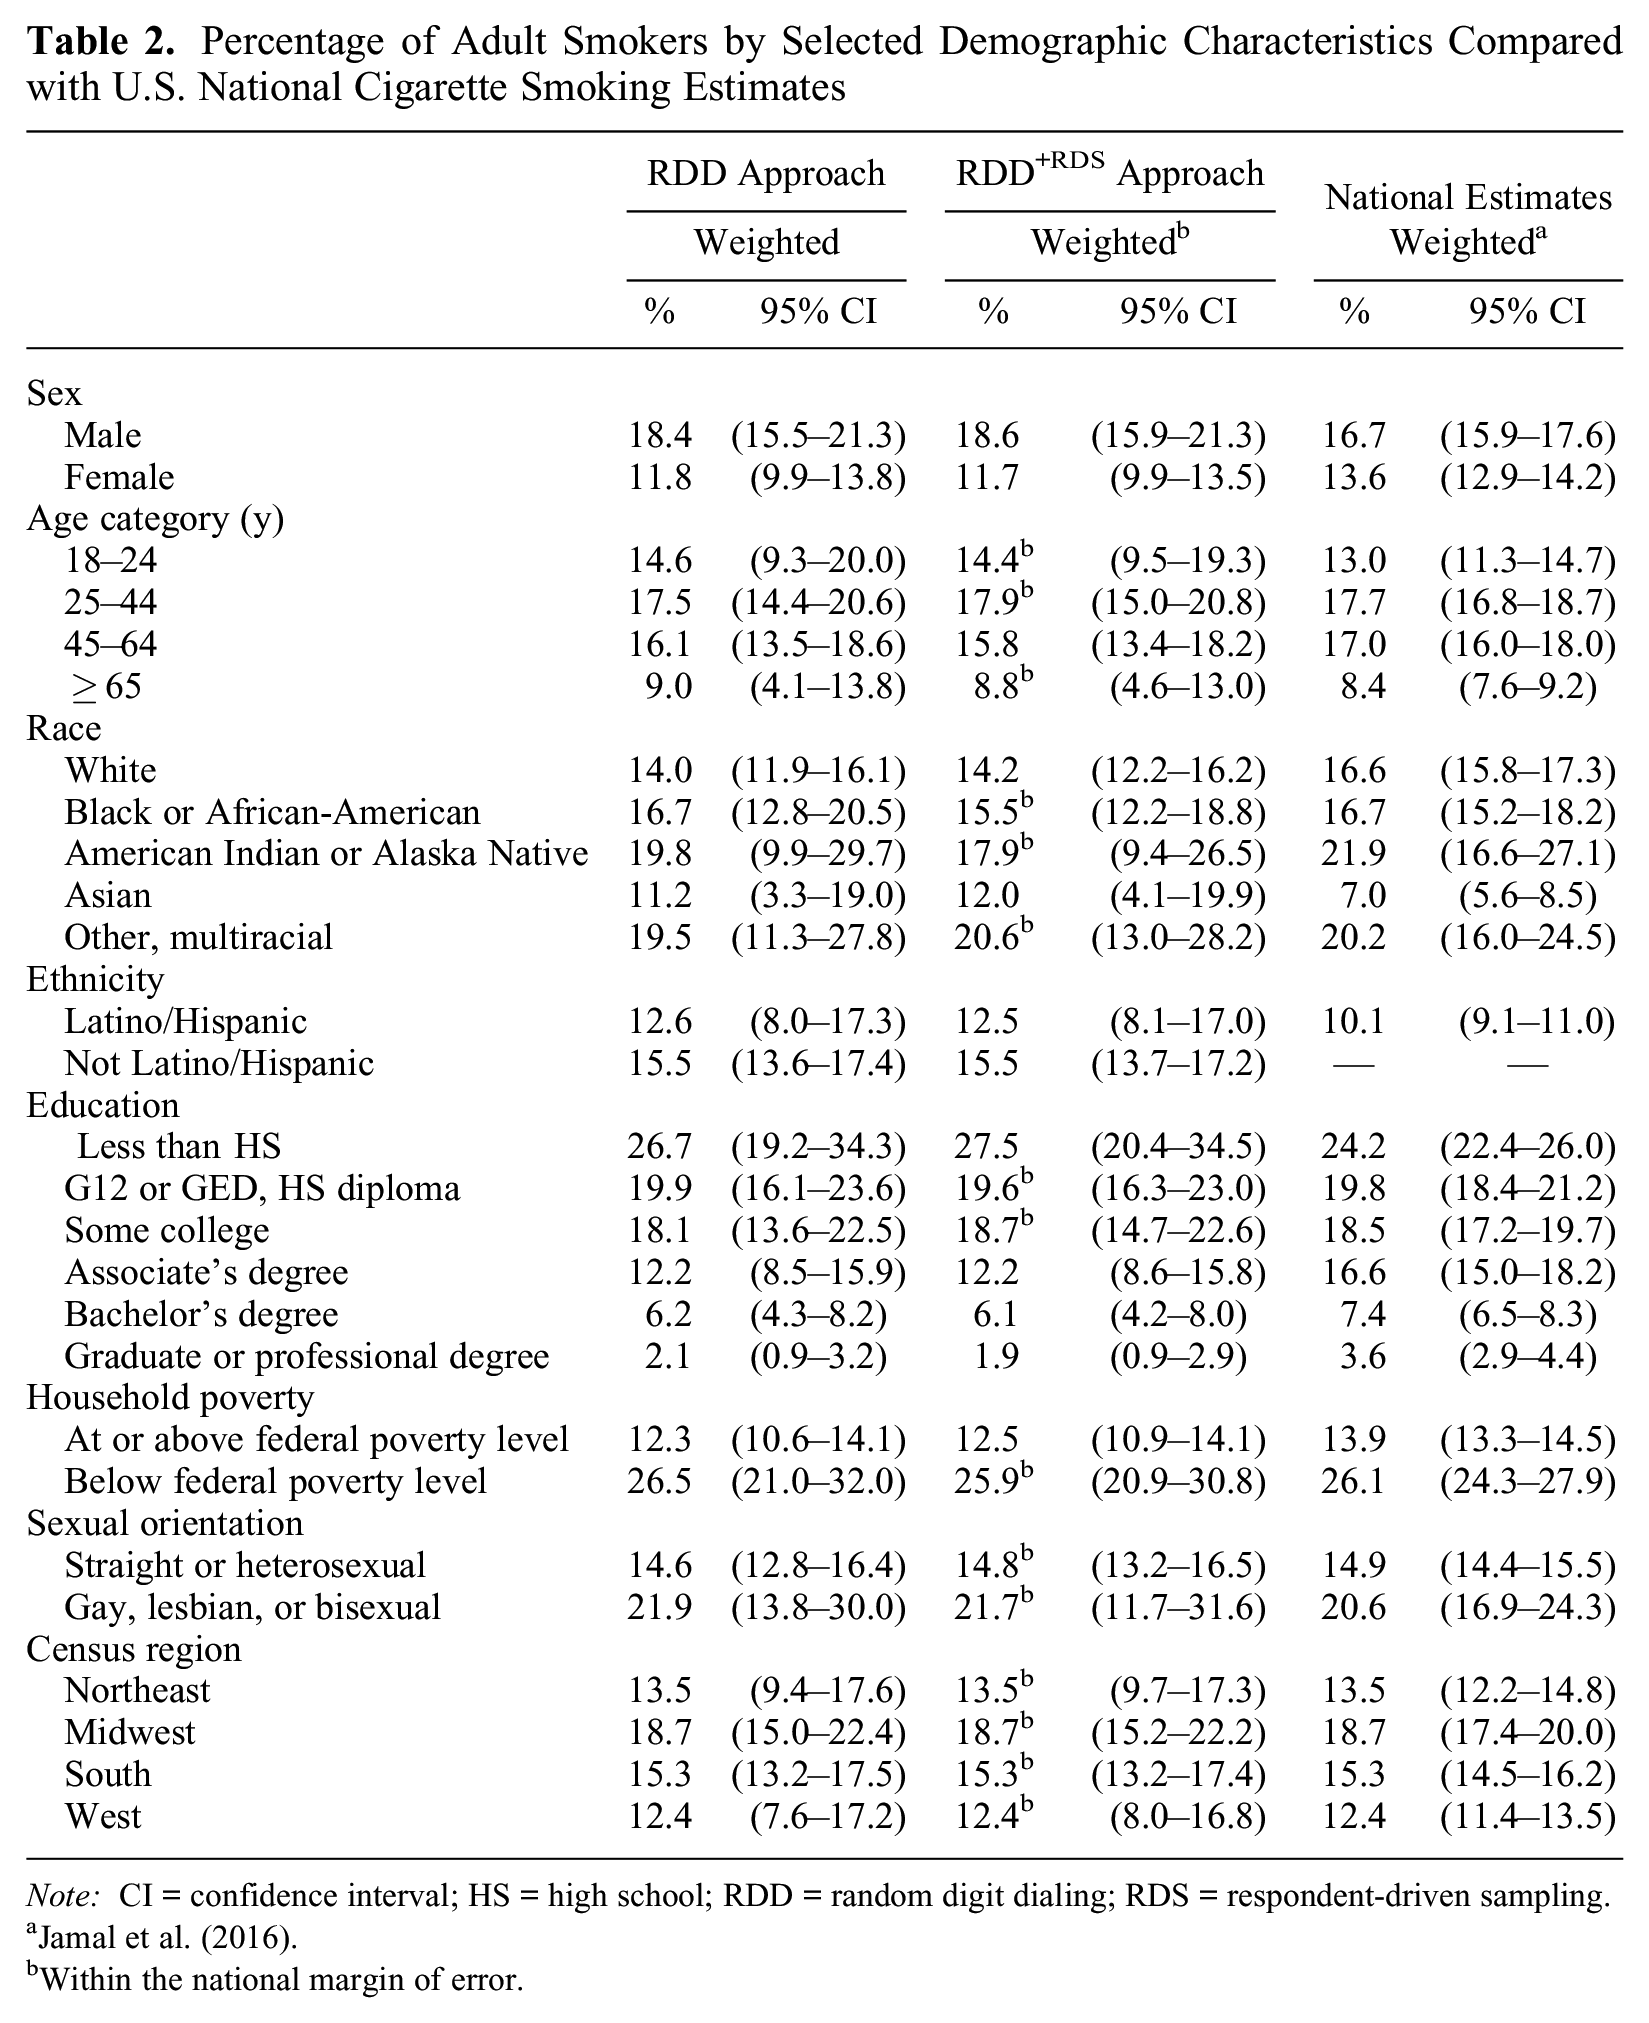
Note: CI = confidence interval; HS = high school; RDD = random digit dialing; RDS = respondent-driven sampling.
Within the national margin of error.
RDS Experiment
The RDS experiment affected the number of referrals, overall F(17, 3,800) = 10.25, p < .01. Type of friend had a main effect on referrals, F(2, 3,800) = 9.20, p < 0.01. The mean number of referrals for friend (2.72, S.D. = 0.14), good friend (2.05, S.D. = 0.12), and close friend (1.92, S.D. = 0.14) showed that friend resulted in more referrals than either good friend or close friend (p < .05 for both); good friend and close friend did not differ significantly. Time period also had a main effect on referrals, F(2, 3,800) = 3.49, p < .05. The mean number of referrals over a 30-day period (1.97, S.D. = 0.15), a 60-day period (2.22, S.D. = 0.14), and a 90-day period (2.51, S.D. = 0.14) differed only for the 90-day condition (p < .05). Therefore, asking for friends over a 90-day recall period produced the most referrals. Finally, the request for LGBT referrals yielded far fewer referrals (1.27, S.D. = 0.09) than did the tobacco-use referral (3.20, S.D. = 0.14), F(1, 3,800) = 136.25, p < .01. None of the interactions were statistically significant.
The RDS experiment also affected the number of interviews completed once referred, F(17, 3,800) = 3.10, p < .01. Specifically, LGBT referrals (M = 2.10, S.D. = 0.06) were more productive than tobacco-user referrals (M = 1.54, S.D. = 0.09), F(1, 3,800) = 29.27, p < .01. In other words, once referred, LGBT individuals were more likely to complete the survey than were tobacco users. No other main effects or interactions were statistically significant.
As a simple measure of cost efficiency, the overall yield from the RDD frames was about 4 percent (4,208 of 121,277), whereas the RDS rate was 43 percent (756 of 1,775). It took, on average, 28.8 call attempts from the RDD frames to yield a completed interview but only 2.35 calls to make an RDS complete.
Discussion
We implemented an innovative RDS methodology in a cross-sectional telephone survey with successful oversampling of special subgroups. Key survey estimates and response rates mirrored rates observed in much larger and more costly government-sponsored household surveys, indicating that our sampling strategy and survey estimates were generally on par with credible national surveys, with a significant cost savings. As noted, simple random sampling (SRS) of landline and cellular frames would have been cost prohibitive in achieving our research goals. Consequently, the RDD+RDS methodology proved to be an important recruitment strategy for several key groups, including cigarette smokers, LGBT individuals, young adults, people living in poverty, and individuals with less than a high school education. Side-by-side comparisons demonstrated that RDD+RDS estimates were comparable with stand-alone RDD estimates, suggesting that the addition of RDS improved the precision of estimates without adding significant bias.
We contend that adaptation of probability-based chain referrals in RDD telephone surveys, as demonstrated here, is a practical tool for survey methodologists that provides a cost-saving strategy for oversampling rare or elusive populations. Our approach avoids the major obstacles of RDS estimation because seeds were selected at random with a known probability distribution that eliminates the biases induced by convenience sampling. Furthermore, seeds do not have to be from the target population, thus expanding the overall referral base.
Our approach also extends beyond the modifications made by Lee et al. (2011), who supplemented an RDD landline sample with an RDS sample by selectively asking landline respondents for three referrals who met the eligibility criteria of the study. Their analysis was conducted using the Respondent-Driven Sampling Analysis Tool (RDSAT) (Volz et al. 2007), and standard RDS procedures were followed. In our study, referrals were probability based and linked to respondents, but we did not choose a subsample by which to implement RDS, nor were we constrained by RDS inference procedures. Specifically, our RDD+RDS sample design dispenses with the requirements of traditional RDS as well as the need to use special RDS software. As Selvaraj et al. (2016) acknowledged, RDSAT’s major limitation is that individualized weights must be generated for each variable in the estimation process, and regression analysis is not always possible. We adopted their approach by creating a single normalized weight for each referral on the basis of the seed’s probability of selection, as well as the number of people within the referral’s social network. We also applied the rationale of treating the seeds and all referrals that spawn from them as a within-household type of cluster sample design. Analysis of RDD+RDS data, including regression coefficients, can be conducted using standard statistical software, such as SAS PROC SURVEY, which accommodates complex survey designs and the clustering effect of the referral process. Our results show that RDD+RDS estimates are on par with RDD and national estimates but with increased precision due to the larger sample sizes generated in the RDD+RDS approach.
We also investigated different approaches for recruiting referrals. We used a two-part question in the survey, in which the first part served as a primer and got respondents to think more along the lines of referral reciprocity (i.e., the probability that A recruits B is equal to that of B recruiting A). This is where we also manipulated type of friend and recall period. The second part asked for a specific referral (tobacco user or LGBT) within those constraints. This type of framing produced more referrals for friends (vs. good friends or close friends) seen over the past 90 days (vs. shorter time periods), across both referral conditions (smoker and LGBT only), which is expected. Once referred, however, type of friend and time period did not matter. The only finding evident here was type of referral: LGBT referrals completed more surveys than did tobacco referrals, even though the latter yielded many more referrals. Unfortunately, we cannot recommend any special referral wording. This finding, however, was a bit surprising because we thought we would obtain greater compliance within closer networks (i.e., good/close friends most recently seen). That is, we expected closer relationships to yield more completed surveys once referred, because trust should have been stronger in those relationships. That did not happen. Perhaps a more fruitful avenue to explore, instead of referral wording, might be the number of referrals referrers are allowed to make. The standard has been to limit referrals to three to reduce the effect of any one seed on the RDS estimates or the effects of the ICC on precision. It would be important to know, given the randomness and independence of the seeds in our approach, if such a restriction is still warranted. Future research should explore the effect of limiting (vs. expanding) the number of referrals used in an RDD+RDS sampling approach.
Limitations
When subgroups constitute a relatively small percentage of the total population and telephone costs for screening the population are prohibitive, disproportionate sampling can boost the overall efficiency of the sampling frame, as shown here. However, oversampling has some important statistical implications. Disproportionality in the sample implies that selection probabilities, and thus the sample weights, will vary among respondents. Variable weights will increase the variance in estimates and lower their precision (Kalsbeek et al. 2007). Survey researchers often test the relative impact of disproportionate designs before drawing the sample. Kish (1965) proposed a simple model to determine the multiplicative effect of variable weights on the variance of estimates:
In our study, the amount of oversampling conducted to increase the number of smokers had a large effect on the estimates as measured by the design effect (Deff), where the design-based variance is in the numerator and the hypothetical SRS variance is in the denominator. Although we surveyed 1,325 cigarette smokers, the current cigarette smoking estimate (15.1 percent ± 1.63 percent) had a Deff of 2.67, which is equivalent to an SRS of 496 (1,325/2.67) smokers. Unfortunately, this also influenced our LGBT estimate (2.1 ± 0.97), where Deff = 3.81 (520/3.81 = 136). However, access to more than 1,000 cigarette smokers and 500 LGBT individuals provided a valuable resource for follow-up surveys. SRS would have only produced a sample size of 635 smokers and 98 LGBT respondents, with a resulting sample size of 4,208. Consequently, oversampling should be carefully considered within the context of the research objectives. When population-based estimates and subgroup comparisons are a top priority, too much oversampling can drastically reduce the precision around estimates, resulting in unstable point estimates with wide confidence intervals. When follow-up with key subgroups is required for subsequent research and sufficient sample sizes are needed, as is the case in our study, oversampling becomes an important tool. The use of RDD+RDS procedures, we contend, is a convenient approach to oversampling, but careful attention should be paid to the sample design effect or, more specifically, Meff. Future work should also explore the design impact of RDD+RDS sampling in an SRS design, without the extensive oversampling done here in high-cigarette-smoking and low-income counties. If done in that fashion, we contend that Deff should be more aligned with oversampling typically seen within households.
Finally, we advise whenever implementing the RDD+RDS approach that researchers compare some outcome measures with national estimates to examine bias on a study-by-study basis. In this study, Centers for Disease Control and Prevention smoking estimates were our “gold standard,” and both RDD-only and RDD+RDS estimates were very close to those national estimates. However, we needed to control for regional and LGBT smoking status in the weights because we oversampled smokers and LGBT individuals in the South. Given this type of control, other nonsmoking estimates may still be affected. If the precision for our nonsmoking estimates increase given the additional sample size of RDD+RDS and the RDD versus RDD+RDS estimates significantly differ, bias may exist and those estimates should be interpreted with caution.
Conclusions
Use of the RDD+RDS methodology led to appreciable gains in sample size and allowed us to achieve adequate sample sizes in several vulnerable subpopulations that were important to this line of research but beyond our budgetary limits. SRS of 500 LGBT individuals at the population rate of 2.3 percent, for example, could have easily increased the overall sample size up to a factor of 5.2. Consequently, the data collection budget would also have increased 5-fold to accommodate a much larger sample size (n≈ 21,882), which was not feasible for this project. The RDD+RDS approach introduced here is an important methodological advancement not only for population-based researchers studying rare populations but also for investigators working with limited research dollars who need an economical and efficient mechanism for oversampling important subgroups. This approach opens the oversampling window to any population for which there are definable social networks.
Footnotes
Funding
Research reported in this publication was supported by grant P50CA180907 from the National Cancer Institute and the U.S. Food and Drug Administration Center for Tobacco Products. The content is solely the responsibility of the authors and does not necessarily represent the official views of the National Institutes of Health or the Food and Drug Administration.