
Abstract
There is evidence that both quantitative and qualitative data in the National Health Service have been underexploited. Although the quantitative data derived from the Friends and Family Test are well understood and reported, the qualitative data are not so easily analysed nor is it easy to use to make quality improvements. There are methods from other domains that can be used to improve both reporting and utilisation of data. This article will discuss the logical and conceptual issues of combining the two methods, which when used together can lead to a deeper understanding of patient feedback and facilitate quality improvement without requiring advanced skills, thus making it suitable for lay staff and patient groups to use. Card Sorts and control charts, which are separately well-established techniques of analysis, were used together to analyse data from the Friends and Family Test in a general practitioner surgery in a small rural town in England with a patient population of approximately 8000. The use of the methodology showed that the two techniques used together resulted in a more powerful method, which was both easy to use and faster than traditional methods such as discourse analysis, and was easily incorporated into quality improvement discussions. This methodology is easy to use and requires little or no knowledge of statistical analysis, which makes it an ideal way for lay people, such as Patient Participation Groups or administrative staff, to monitor and act upon patient feedback, relieving general practitioners of the burden of analysing patient feedback.
Keywords
Background
The Friends and Family Test (FFT) was introduced across the United Kingdom by the National Health Service (NHS) as a way of measuring and understanding how patients feel about the medical services they are receiving (Department of Health, 2014). The primary aims are to gather useful feedback from people, to identify areas for improvement, and to inform current and prospective patients about the current patients’ experiences.
The main question on the survey, mandated by NHS England (NHSE), asks, ‘We would like you to think about your recent experiences of our service. How likely are you to recommend our GP practice to friends and family if they needed similar care or treatment?’ There are six tick boxes: Extremely Likely, Likely, Neither likely nor unlikely, Unlikely, Extremely unlikely and Don’t know. These quantitative data are reported to NHSE monthly and can be used locally at the discretion of the practice. There is an additional space headed ‘Please could you explain your answer’. These qualitative data are for the use of the practice and are not reported to NHSE. Practices can include at least one follow-up question to enable people to provide more detailed feedback. Patients may tick the box ‘Please tick this box if you DO NOT wish your comments to be made public’ (NHSE, 2015). There is guidance from NHSE on how to collect and submit data (NHSE, 2014).
However, measuring patient experience does not lead to change without putting effort into acquiring a deeper understanding of the patient experience (Carter et al., 2016). There is evidence that both quantitative and qualitative data in the NHS have been underexploited (DeCourcy et al., 2012), with the qualitative data from free-text questions being much harder to collect, analyse and report. Two of the difficulties found when analysing qualitative free text using traditional methods, such as content or protocol analysis, are the time needed to do the analysis (Burton et al., 1990) and the high degree of skill required to learn the methods which are more commonly found in the social sciences. Neither time nor analytical skills are in abundance in general practitioner (GP) surgeries.
Effort was put into making sure that the FFT was embedded into all health settings including primary care practice, but less effort was put into understanding and using the data (Coulter et al., 2014). In June 2018, NHSE set up a Friends and Family Development Project in order to address this issue. A survey conducted by the working group found that 69% of respondents either did not use or made little use of the FFT for improvement (personal communication).
This article will explain a novel yet simple methodology that combines two well-known and validated methods from other domains, which in combination can provide a more powerful and yet simple way for primary care practices and their Patient Participation Groups (PPGs) to use to systematically analyse the FFT qualitative data.
Methodology
The two methods
The two methods illustrated in this article are card sorts and control charts. Although card sorts have been used extensively in computing, they are not as frequently used in the medical domain. Control charts are more frequently used, in particular in hospitals, to track changes, but to the author’s knowledge their use has never been combined with the use of card sorts in order to analyse and track free-text feedback.
Card sorts
Card sorting is a well-developed method often used in computing for knowledge elicitation (Rugg and McGeorge, 1997). A set of cards with objects or concepts on them is given to the participant to sort into categories. In a closed sort the criteria can be specified, while in an open sort the participants can choose their own criteria. There are several different ways in which the results can be analysed.
Control charts
The control chart is one of the tools used in Statistical Process Control (SPC). It was developed in the 1920s by Walter Shewhart to improve industrial manufacturing (Shewhart, 1926) and has been refined for use in healthcare settings (Woodall et al., 2006). SPC is not just a methodology; according to Carey it is also a philosophy and a strategy used for the ongoing improvement of systems, processes and outcomes (Carey and Stake, 2003). Control charts can visualise and analyse the performance of a process, differentiating between normal and expected variation (noise), and errors or alarms which indicate a change to the system that should be investigated (signal). They can be used to track broad system performance, for example, the satisfaction reported by patients over time in a GP practice, or a much narrower system such as monitoring the response to an increased dose of a drug in an individual patient. By tracking variation over time with a control chart, the difference between signal and noise can be shown, allowing signals to be followed up and investigated, and avoiding investigating what is just natural variation or noise.
Card sorts and control charts together
What follows is an outline of the methodology. See the supplementary file for more step-by-step details on how to perform card sorts and prepare control charts.
Although the FFT quantitative data had been reported to NHSE every month and the management read all the free text and acted where necessary, the free text was not systematically analysed or reported. There was no method for analysing the free text, reporting it over time, or using it to make quality improvement. In addition, the themes from the free-text question were not being used to inform the wider patient population about current patient experience. The following question was raised: Is there a better way of systematically capturing, analysing and acting on patient feedback?
A member of the PPG offered to develop a systematic method to help the practice analyse the free text and present the data in an understandable way. As traditional content analysis requires skill, it was decided to explore the use of card sorts to analyse the data as this could be performed by lay people with only the most basic training needed. It is usual when using card sorts for the research team to develop the statements on the cards; however, in this case the cards were populated with the free-text feedback from the patients themselves using the patients’ actual wording in order to capture the patients’ voice as accurately as possible. Once the cards were prepared, a closed card sort was used to sort the free-text responses from the official NHS question into four categories known as the four Cs:
Compliments
Comments
Concerns
Complaints
Trials were done with a variety of people including PPG members, staff and academic experts experienced in card sorts. Any difficulties were noted and the subsequent format was adjusted. For example, the free-text box for the NHS mandated question is prefaced with ‘Please could you explain your answer’. Some people just wrote the name of a clinician, so it became clear that how likely they were to recommend the practice needed to be included on the card; if they ticked they were extremely likely to recommend the practice, then it was taken as a compliment, but if they were extremely unlikely to recommend the practice, it was assumed that this was a complaint.
It was also found that although compliments and comments were self-explanatory, the difference between a concern and a complaint was not. After multiple card sorts it was decided that a concern was general or non-specific, for example, ‘there is sometimes a long wait in the waiting room’ and a complaint was specific, timely, or an unresolved problem, for example, ‘I had to wait one hour in the waiting room today and this is the third time this has happened’.
One month was chosen to be a control month, when several people were asked to sort the cards in order to examine variation between people. Little variation was found between people, so the subsequent months were sorted by a minimum of two people, preferably more when possible, to allow for the control of any bias, in particular confirmation bias (Gilovich et al., 2002), which can result in giving undue emphasis on data that support a particular point of view reached before the data have been fully analysed.
All of them found card sorting quick, easy and enjoyable. One PPG member commented, ‘It was somewhat difficult to sort at first, but it was much easier and faster once we defined the four Cs. It was surprising how consistently different people sorted the cards’ (PPG member, aged 21).
Although the use of the quantitative data to prepare control charts was straightforward, initially, there was no clear way of converting the qualitative data into control charts until it was realised that the data categorised into the four Cs using the closed card sort could easily be used to populate a control chart. The data were entered in an Excel spreadsheet and control charts were calculated for each of the four categories. Although these were helpful, for the purposes of reporting to the practice how the patients were feeling about it, the data were combined into either positive or negative and two charts were produced.
NHSE encourages practices to add their own questions to the FFT, and the second question formulated by the PPG was as follows: ‘What is the one thing that would enhance your experience of the service provided by [insert surgery name here]?’ As the replies did not map neatly onto the four Cs, it was decided to use an open sort. Over time, trends emerged which were entered into a spreadsheet.
Control charts for quantitative data
The quantitative results for 2015 and 2016 for the NHSE mandated question were entered in a spreadsheet. The raw numbers were turned into percentages to allow for monthly variation. The instructions from Wheeler’s (1993) book, Understanding Variation: The Key to Managing Chaos, were followed. Instructions can also be found on the Internet and in the supplementary file. XmR charts were prepared in Excel for each quantitative situation, that is, one each for ‘extremely likely to recommend’, ‘likely to recommend’, ‘unlikely to recommend’ and ‘extremely unlikely’ to recommend. The spreadsheet was set up so that the chart was automatically produced when new data were added, with columns for each area of the chart (see Table 1 as example). This allowed for rapid updating once the initial spreadsheet was set up. In addition, a control chart was prepared for the number of returns each month.
Example from spreadsheet used to calculate the control chart.
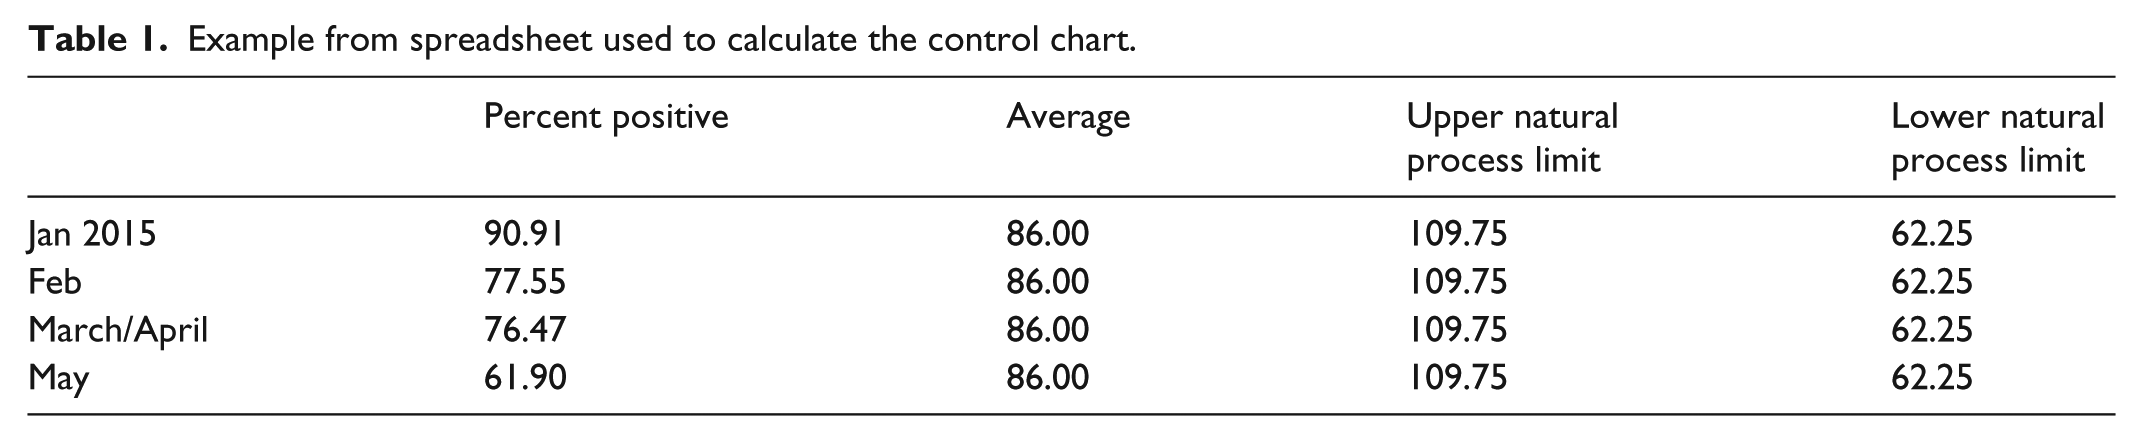
It was decided to combine the data from both ‘extremely likely’ and ‘likely’ into one chart. The same was done for ‘unlikely’ and ‘extremely unlikely’. Because so few people ticked ‘don’t know’ or ‘neither likely or unlikely’, it was decided that these charts would not be useful at this time.
Results
Control charts – quantitative data
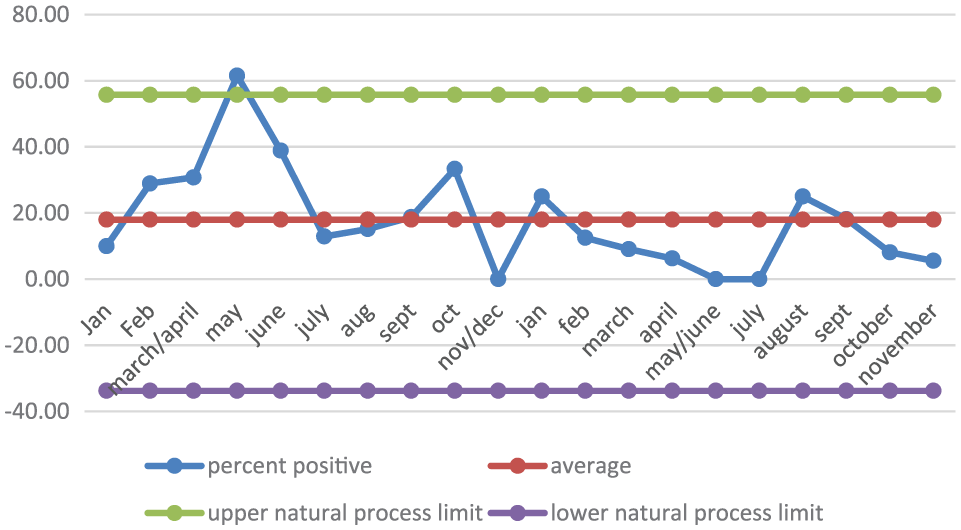
The combined chart for ‘likely to recommend’ clearly showed that the numbers were below average between March and October 2015, but were not outside the lower natural process limit. The figures appeared to improve from November to February 2016, but there are clear dips in March and November 2016 (Figure 1). This is reflected in the combined chart for ‘unlikely to recommend’, where we see a spike in the numbers of people not wanting to recommend the surgery in the same months (Figure 2).
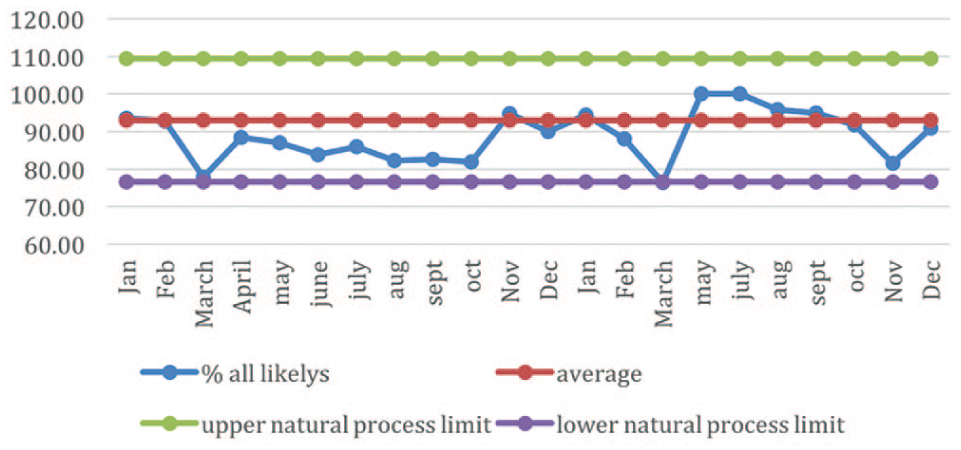
Control chart for ‘extremely likely to recommend’ and ‘likely to recommend’ combined. This shows clearly the dip in the number of people likely to recommend the surgery in March and November 2016, which coincides with two GPs leaving the surgery.
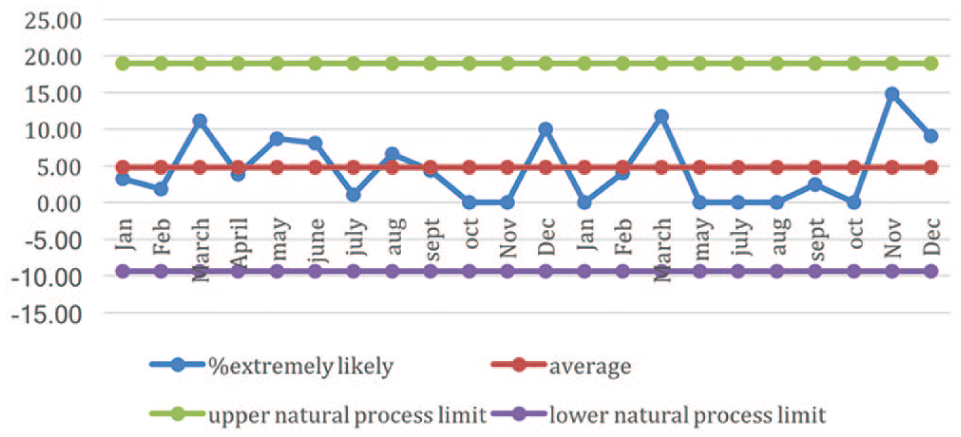
This shows the combined control chart for ‘unlikely to recommend’ and ‘extremely unlikely to recommend’. There is an increase in March and November, again coinciding with GPs leaving the surgery, but all data points are still within the process limits, and in most months there are no negative returns. The lower limits could be set to zero as it is not possible to have a negative number of returns.
After discussion between the PPG and the Practice Manager about what might have caused these dips, it was noted that there were GP resignations in the two corresponding months.
Control charts – qualitative data
Although people were less likely to recommend the surgery in the 2 months that were affected by the resignation of GPs, this was not reflected in the free-text comments (Figure 3). The free-text comments were often either partly or wholly positive even if patients also had a negative comment or were unlikely to recommend the surgery (Figure 4). This reflected feedback that the PPG received directly from the patients that, although the resignation of GPs affected how the patients felt about the surgery, they were still generally happy with the surgery. This confirmed that it was natural variation rather than a serious problem that needed to be addressed.
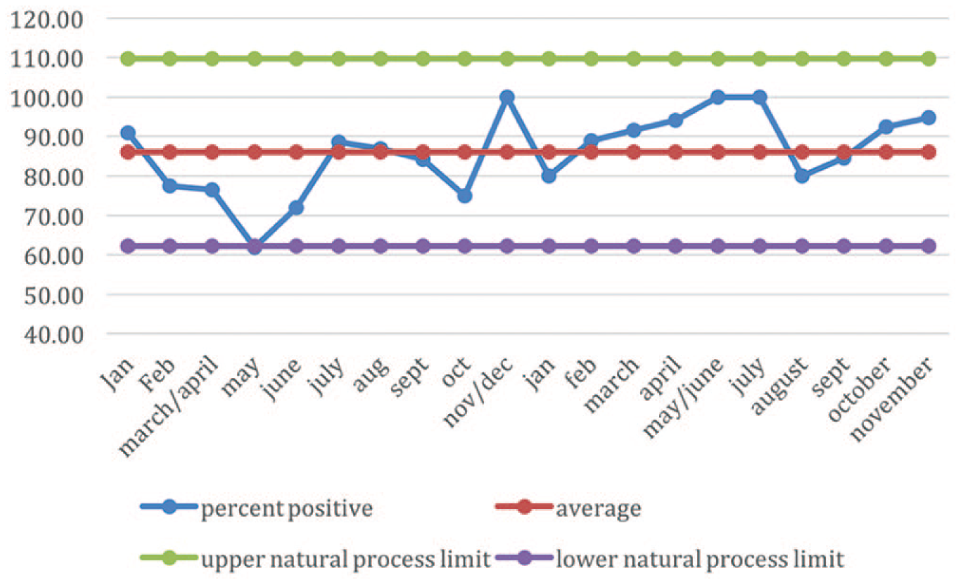
The positive free-text comments, which show a general positive trend.
The negative free-text comments. The data point for June 2015 was above the upper process limit. This is a signal that requires an explanation. Subsequently, however, the number of negative comments decreased.
The PPG free-text only question
Using control charts to monitor the quantitative data is a straightforward and frequently used method of displaying results in a way that allows for the identification of patterns that represent a signal that the process has changed. Converting the accompanying free-text data into categories that can also be reported in control charts as above is also easy to do. However, data from free-text responses have to be analysed before they can be acted upon. Traditional methods for analysing free text, such as software like NVivo, are not only expensive but also time-consuming to learn. In contrast, using card sorts requires nothing more than paper and a spreadsheet and is easy to learn.
An open card sort was performed in order to analyse the second question that the PPG added to the FFT form which asked, ‘What is the one thing that would enhance your experience of the services provided by [insert surgery name here]?’ The free text from each return had already been separated into individual concepts for each card (see supplementary document) and most patients, even when including multiple themes in a single sentence, had clear intentions, for example, mentioning the length of time spent waiting in the waiting room for their appointment. This made the sorting exercise simple and straightforward for the PPG members, and there was a high level of agreement between the categories. The categories that emerged were tabulated in a spreadsheet (Figure 5).
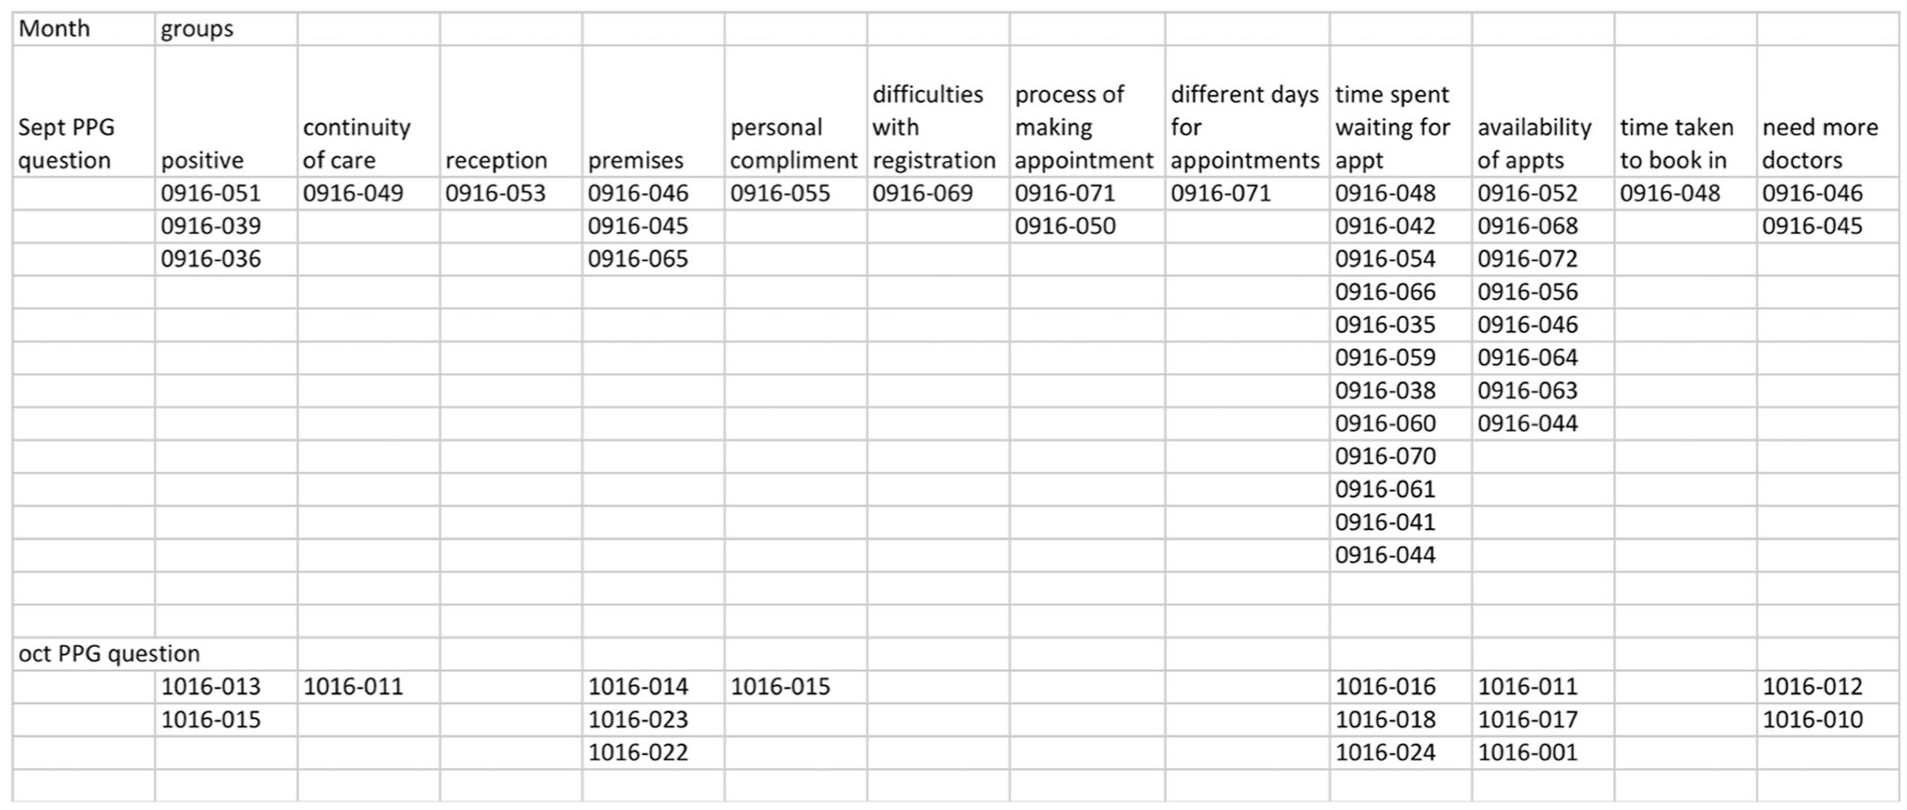
Example of spreadsheet of results from the open card sort done on the PPG question, ‘What is the one thing that would enhance your experience of the services provided by this surgery?’
It was clear when analysing the free text that some patients understood that doctors sometimes ran late due to uncontrollable circumstances, but the amount of time spent waiting in the waiting room was clearly something that was annoying patients. The PPG were able to take this up with the Practice Manager and GP partners resulting in changes to the procedures in the waiting room that included receptionists informing patients of delays and offering them alternative appointments. The changes were built on the patients’ understanding of why the GPs were running late, an understanding that led to increased patient satisfaction. Other issues such as lack of refreshments and reading material along with parking difficulties have allowed the PPG to represent a finer grained patient view to the practice in preparation for building new premises.
Tracking the number of FFT returns using control charts
Reliability is important and low levels of response rates can result in a biased sample due to chance. Therefore, it is important to look at the number of returns each month and to encourage staff to promote the FFT to all patients (Ahmed et al., 2014).
In July 2015, the number of returns was outside of the upper natural process limit (Figure 6). The higher the numbers of returns the better, so staff were able to ascertain why so many forms were filled out that month and try to emulate this in future. After a thoughtful discussion with the Practice Manager, it turned out that a different receptionist was working on the front desk in July 2015 and she had been proactive in handing out the FFT forms.
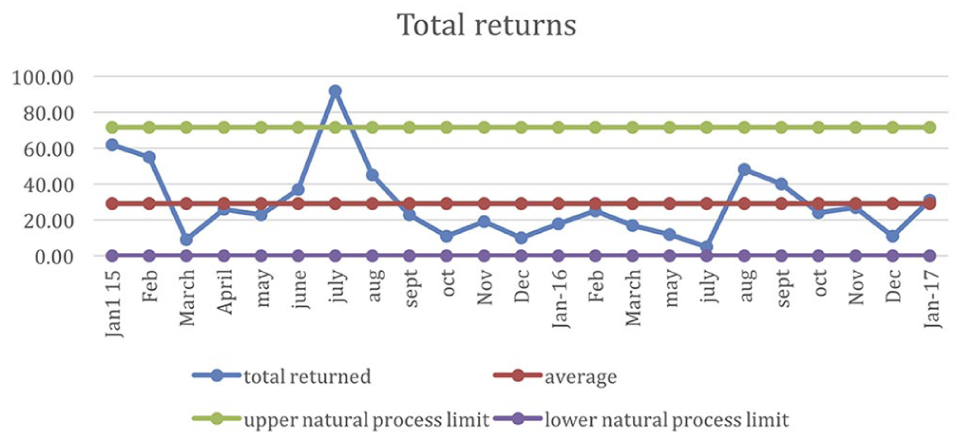
The control chart for the number of returns each month. The data point for July 2015 was above the process limit, which is a positive event. The surgery was able to look into why this happened and encouraged staff to emulate that behaviour, which involved staff being more proactive in handing out the forms.
Discussion
The NHS is very good at collecting data, but it is less good at using it to understand the patient experience, an understanding which is important when making quality improvements. Quantitative surveys without the systematic analysis of the free text make improvement of patient experiences more difficult (DeCourcy et al., 2012). Combining the FFT quantitative data with the card sorting of the free text allows a deeper understanding of the patient experience and how it can be improved. Collecting data without systematically analysing the rich detail from the free text data can result in missed opportunities for improvement. Many PPGs make use of an annual survey to elicit feedback from patients; however, there are inherent problems in preparing and analysing questionnaires (Boynton and Greenhalgh, 2004) and as they can take several months to prepare, distribute and analyse, it can result in missed opportunities to make improvements. These disadvantages can be avoided by using the FFT data; patients are already participating in the feedback process by filling out the FFT which is already being collected so no extra effort is needed. Involving the PPGs in analysing the data not only relieves the burden of extra work for the staff, it allows the PPG to fulfil their remit of passing patient views onto the practice.
To the author’s knowledge, these two techniques have not been used together in this way. It is also unusual to use the words of the patient or participant to directly populate the cards, and for the researchers or the PPG and practice, to do the sorting. This is opposite to the way that most card sorts are done, that is, the researcher populates the cards and the participants sort them.
The benefits and validity of the two techniques described in this article have been extensively tested and validated in other domains. An advantage of these two methods over other statistical methods, such as content analysis, is that they involve only basic arithmetic allowing people with no training in statistics to process and report the data. In addition, they are simple to learn and require no special materials or software. Card sorting requires less cognitive load compared with other methods which allows the person doing the card sort to concentrate on the qualitative content of the cards. It is also a quick and fun way to categorise the themes; all the participants that took part in the initial stages of development enjoyed doing the card sorting. An additional advantage in using card sorts became apparent upon initial examination of the free text; many patients had multiple themes in a single sentence. By preparing cards for each theme the whole of the patients’ voice could be heard and analysed.
A member of the PPG tried different techniques to represent the data, such as pie charts and stacked bar charts, but those representations did not capture the longitudinal aspects and variability of the data, nor did it allow for systematic analysis of the free text or the differentiation between a signal that something was wrong and the natural variation of the data. The combination of card sorts and control charts, for both the free text and the quantitative FFT data, allowed for a deeper understanding of the patient feedback which was triangulated with other patient feedback and used to prepare an Action Plan of three activities for the PPG and surgery to work on over the following year: a root cause analysis of problems with repeat prescriptions; implementation of a programme to make sure that all patients with multi-morbidity have a copy of their care plan; and facilitate patients to sign up for online access.
As the FFT is collected monthly, it can also allow the PPG to identify areas in which they can support the practice and patients offering real-time changes as soon as the information comes in, rather than waiting for an annual survey to be analysed. For example, the results from the PPG question showed that by keeping patients informed of any delays while waiting to see their GP, as well as making the waiting room experience more pleasant by increasing the number of magazines, the patients were more accepting of the delays leading to an improved experience, which was reflected in the following month’s FFT returns.
The easy-to-understand visualisation was posted in the waiting room and over time the patients and staff could monitor the changes; an increase in positive responses indicated an improvement in the delivery of healthcare that could be celebrated, a decrease outside of the range could be investigated, and normal variation could be monitored. The PPG’s involvement with the FFT encouraged them to triangulate the data with other information, such as direct discussions with patients, offering a richer view of the patient experience to the surgery, as well as being able to inform patients how the surgery was doing.
Although trust among the PPG members, patients and the practice is very important, it is not always easy to achieve (Carter et al., 2016). Working together can improve the levels of trust and transparency as well as easing the workload of the GPs and administration staff of the surgery. In addition, card sorts can be used in other ways. For example, when the PPG offered to reorganise the large cupboard containing patient leaflets and forms, they used the card sorting technique to decide the most natural way to reorganise the cupboard. The card sorts to questionnaire technique (Upchurch et al., 2001), where the results of the card sorts are used to form multiple-choice questions, could be used in future but was not tested at this time as there was no current need to do a patient survey.
Although the FFT is mandated for England only, there is no reason why these methods cannot be used worldwide in any other medical or social care establishment, and by using the four Cs it would be possible to compare data across practices. This methodology does not depend on the current wording of the FFT, so it can continue to be used regardless of future changes to the wording of the main FFT question.
Conclusion
Across the NHS, data are routinely collected but underutilised. Primary care practices and their staff are often busy and don’t always have time to deeply analyse the Friends and Family data that are already being collected. In addition, practices must have a PPG whose remit is to present the patient view, but these groups are not always utilised to their full potential. Because lay people, be they staff or PPG members, are not trained in skilled methods of content analysis or the use of statistics, it can be easy to misunderstand or miss altogether the finer grained themes in the FFT free text. It can also be difficult to track patient satisfaction over time and to know what is natural variation and what is a signal that something has changed. By using two simple techniques together, namely card sorts and control charts, the data from the FFT can be analysed, presented and acted upon to make real-time changes, as well as bringing together PPGs and the practice to improve patient care and satisfaction.
Supplemental Material
Supplementary_document_MI – Supplemental material for The Friends and Family Test: From card sorts to control charts
Supplemental material, Supplementary_document_MI for The Friends and Family Test: From card sorts to control charts by Jennifer D Skillen in Methodological Innovations
Footnotes
Acknowledgements
The author thanks all the patients, staff and Patient Participation Group members for their input and help with developing and testing the methodology.
Declaration of conflicting interests
The author(s) declared no potential conflicts of interest with respect to the research, authorship and/or publication of this article.
Funding
The author(s) received no financial support for the research, authorship and/or publication of this article.
Supplemental material
Supplemental material for this article is available online.
Author biography
Jennifer D Skillen is a PhD student in Computing at Keele University, UK. Her topic is formalising representations of medical reasoning. She has been a Patient Participation Group volunteer and continues to work with patients and the Clinical Commissioning Group, looking for better ways to represent data to allow a deeper shared understanding.
References
Supplementary Material
Please find the following supplemental material available below.
For Open Access articles published under a Creative Commons License, all supplemental material carries the same license as the article it is associated with.
For non-Open Access articles published, all supplemental material carries a non-exclusive license, and permission requests for re-use of supplemental material or any part of supplemental material shall be sent directly to the copyright owner as specified in the copyright notice associated with the article.