
Abstract
We set out to test a theory-based measure of health literacy. To do so, we included the newly developed Calgary Charter on Health Literacy scale in Pre- and Post-evaluation of the Life Enhancement Program at multiple sites. The program focusing on health literacy and the prevention of chronic disease is conducted with health-care provider organization partners across the United States. In testing the reliability and validity of the new measure of health literacy, Cronbach’s alpha is very acceptable level at 0.80. There are numerous statistically significant correlations between the change in health literacy and participants’ changes in knowledge, attitudes, beliefs, behaviors, and health status. Data and analysis indicate that the Calgary Charter on Health Literacy Scale is a valid and reliable measurement tool in the contexts and with the populations they were tested within. More testing is necessary and warranted in a wider variety of contexts and populations—ideally to include large representative random samples and comparison groups. We recommend that policymakers increase focus on advancing health literacy as an evidence-based approach to reach the goals of improved individual and public health at a lower cost.
Introduction
The measurement of health literacy has been an area of controversy and some weakness in the study of health literacy since the multi-dimensional and complex social construct was initially developed. Over the past two decades of the field’s ongoing development and consensus seeking, a variety of scholars have pointed out a series of related and underpinning issues in regard to the measurement of health literacy (Batterham et al., 2014; Berkman et al., 2010; Kandula et al., 2011; McCormack et al., 2010; Mackert et al., 2015; Morris et al., 2006; Ownby et al., 2013; Pleasant, 2009, 2014; Pleasant et al., 2016; Sørensen et al., 2013). These issues include the following:
A general lack of consensus on the definition of health literacy.
Measurement tools not being based on a theory or a conceptual framework. 1
A wide variety of often disparate approaches that limits comparability across studies.
Less than ideal initial validation samples for many existing measures.
The challenge of self-report versus more objective measures.
The potential conflict between robust measurement of the complex concept versus the burden placed on participants.
Conflicting goals and methodologies between screening versus measurement.
A dominant reliance upon print literacy.
Concerns about stigma.
Lack of standardized use of existing measures.
The overwhelming focus on measures of individuals versus those relevant to health professionals or systems.
On the level of measuring health literacy in individuals, nearly all health literacy measures are primarily designed for and used as either screeners or to obtain a one-time assessment of health literacy. Most assessment tools have not been used—and may not be usable—for a valid or reliable assessment of change in health literacy. Assessing change in health literacy is particularly important conceptually, given the dynamic and situational components of the construct. As a result, there is scant evidence that an intervention to change an individual’s health literacy will causally produce changes in that individual’s health status. For example, a recent literature review found only a very small number of intervention studies that gathered evidence of improving health literacy among community populations (Nutbeam et al., 2018).
Of course, an intervention could be designed to improve scores on many of the existing measures—but it remains unclear whether improving an individual’s score on, for example, the various versions of the REALM, TOFHLA, or the Newest Vital Sign (which are largely based on distinct knowledge or numeracy questions) would produce a concomitant gain in health status (Davis et al., 1991, 1993; Parker et al., 1995; Weiss et al., 2005).
There is at least one other confounding issue when it comes to measuring health literacy on a pre/post basis. One would hope that researchers in health literacy take the time and provide the attention to inform people of what they get “correct” or “incorrect” when responding to many of the existing measures of health literacy. That would be solidly in line with the best practices of research and the underpinning ethics of health literacy. That best practice also has implications for measures of health literacy based on “objective” issues such as knowledge or numeracy questions regarding their ability to be used in a pre/post design. Of course, not all measures of health literacy rely on that type of assessment of knowledge or numeracy and, thus, do not have a correct or incorrect response.
Overall, the long-held promise of health literacy is that improved health literacy will produce improvements in health status—ideally at lower costs. Measurement tools need to be calibrated toward evaluating the reality of that promise.
For now, pending future developments, the use of self-report seems to provide an opportunity to begin investigating the potential that a change in health literacy will also produce a change in health status. Self-report reduces the likelihood of ambiguity that a pre/post change in response to a measure of health literacy is created by an intervention or from participant’s repeated exposure to the same knowledge and numeracy questions. Recent examples of such self-report measures of health literacy include the European Health Literacy Survey effort (healthliteracyeurope.net) and the Ophelia Project in southeast Asia and Australia (www.Ophelia.net.au) (Batterham et al., 2014; Osborne et al., 2013; Sørensen et al., 2013). One could clearly argue that the ongoing move toward self-report reflects not only the need to explore health literacy as a complex, multi-dimensional concept but also a move toward integrating health literacy into all policies and practices.
As a small step to advance the measurement of health literacy, this article reports on the development and initial testing of a short, easy-to-use self-report measure of health literacy—the Calgary Charter on Health Literacy Scale. This measurement tool is explicitly based on the theory, or conceptual framework, of health literacy presented in the Calgary Charter on Health Literacy, first published in 2009 (Coleman et al., 2009). In comparison to existing longer self-report measures, this approach places a much lower burden on participants, as it consists of only five statements with a Likert-type response scale.
The Calgary Charter on Health Literacy is very likely the first theory of health literacy that explicitly addresses the “two-sided” nature of health literacy. The Calgary Charter on Health Literacy offers a core definition of health literacy as being what “allows the public and personnel working in all health-related contexts to find, understand, evaluate, communicate, and use information. Health literacy is the use of a wide range of skills that improve the ability of people to act on information in order to live healthier lives. These skills include reading, writing, listening, speaking, numeracy, and critical analysis, as well as communication and interaction skills (www.centreforliteracy.qc.ca/sites/default/files/CFL_Calgary_Charter_2011.pdf).
The key concepts within that definition are finding, understanding, evaluating, communicating, and using information. Those actions are relevant to the public in their own health literacy and also to health professionals working to lower health literacy barriers. In this instance, the measurement tool was initially developed to assess skills on the public side of that equation. In future, a simple rewording would allow the approach to measure the health literacy of health professionals as well. We also feel this approach is easily transferrable and usable with minor edits across all domains of health—for instance across disease and context.
Asking self-report questions at the aggregate levels of finding, understanding, evaluating, communicating, and using information will, as discussed previously, have both strengths and weaknesses that must be balanced and made explicit. There are many possible specific activities and skills that can be associated with each of those five areas of action that make up this theory of health literacy. To measure each and every one of those possibilities would, indeed, prove a large burden on respondents to such a measurement tool.
For example, knowing that an individual reports not finding information very often does not reveal which specific skills an individual may be lacking or not using. An individual could have poor reading skills or not know very well how and where to search for information or could simply not have a high level of need or motivation to search for information. Conversely, the approach does offer the benefits of a very low burden on participants and providing an indication of the general domains where an intervention may want to focus on to improve an individual’s health literacy. In this tool, the preference was given to reducing the burden on participants as much as possible while maintaining validity and reliability.
In addition, when used in a pre/post design with an intervention, this broad approach may not always be able to fully inform investigators which specific parts of the effort to improve health literacy of participants worked or did not work, but on the other hand it clearly has the potential to inform investigators of the overall effects of the intervention on health literacy and provide a metric to explore the causation of any changes in health status or utilization.
The only true way to test the effectiveness of a new measure is to put that measure into practice, which is the primary focus of this article.
Methods
The purpose of this effort was to initially test the validity and reliability of a new, short, easy-to-use, self-report measure of health literacy in both English and Spanish. The initial testing of this measure of health literacy, reported on here, was conducted in the context of a health literacy and integrative health intervention that focuses on improving health and well-being of the participants. The Life Enhancement Program (LEP) is an integrative health intervention based on the best practices of health literacy to prevent, diagnose, manage, and reverse chronic disease in low-income and underserved communities. The LEP consists of a minimum of 40 hours of contact time for groups of approximately 20 participants at a time. This includes interactive sessions focused on integrative health, nutrition, physical activity, behavioral health, stress management, and spirituality (sense of purpose). At most sites, the program occurred over 12 weeks; however, over time variations have included schedules ranging from 6 to 15 weeks. Total contact time remains the same in every scheduling variation. We have found no significant differences in the outcomes between different approaches to scheduling the program.
As was the case for the entire content and approach of the LEP, the Calgary Charter on Health Literacy Scale went through several rounds of development. Upon initial drafting of the scale’s items, a round of professional peer review was conducted. Comments from a number of health literacy scholars and practitioners were sought out and received. This included team members who would be giving the program and conducting the evaluation data collection at the initial program site. This step included physicians, nutritionists, physical therapists, social workers, registered nurses, and a spirituality professional. After the initial round of edits, the scale was tested with a small sample of individuals who also received an initial demonstration of the LEP, which included both cognitive understanding and evaluating the quantitative responses to the scale.
We included the Calgary Charter on Health Literacy Scale in both pre- and post-evaluation of the LEP in multiple communities across the United States. These include a largely White, rural community; a largely Black population in the southern United States; a largely Hispanic/Latino community of mainly Puerto Rican descent in the south Bronx, NY; and a largely Hispanic/Latino community primarily of Mexican and Central American descent in southern Arizona. This piloting was completed in either Spanish or English as appropriate to each individual or group (Pleasant and Cabe, 2017; Pleasant and Mckinney, 2011).
The Calgary Charter on Health Literacy Scale was primarily given as part of an individual interview with participants. The questions were read aloud by a trained researcher who recorded participant’s responses. In some instances, particularly at post-program, participants would respond individually on paper to the measurement scale as part of a group process led by team members versus an individual interview. In these instances, paper copies of the evaluation protocol were distributed to participants, and team members were continually present to offer any clarification or support that was needed. This approach only occurred when team members were confident that the participants did not need the more supportive structure of an individual interview. At all times, any individual could opt out of the group session and respond to the program evaluation in an individual interview.
This work has been approved by research ethic committees/Institutional Review Boards at each partner location where required.
Participants
Participants in the LEP were not required to take part in the evaluation and were free to decline to respond to any question. Thus, the total responses to any question may not reflect the same number of participants.
In the LEP, at the time of this reporting (the program is ongoing at several locations across the United States), 633 individuals provided complete responses to the Calgary Charter on Health Literacy Scale at both pre- and post-program. All demographic information provided is from the pre-evaluation data collection for all participants. All data provided in this article focus only on those 633 individuals who completed the Calgary Charter on Health Literacy Scale in both pre- and post-program evaluation.
The scale was tested as part of a larger program evaluation. Program participants were not required to take part in the evaluation. They could choose to not answer any individual question during the evaluation or they could decline to participate in the evaluation altogether. Thus, some data reported—such as demographics—will not always add up to 633 individuals. In addition, in some categories of data collection such as ethnicity, we allowed individuals to select as many responses as they felt appropriate. Thus, again, some data will not always add up to 633 individuals and do, in fact, exceed that as many people responded that they reflect more than one of the ethnicity categories.
The average age at the time of data collection was 53.9 years (Table 1). The majority were female (514 or 85%). Participants who had children (379) reported having, on average, 1.7 children, with an average of 0.8 children still living at home.
Selected self-reported baseline characteristics of participants.
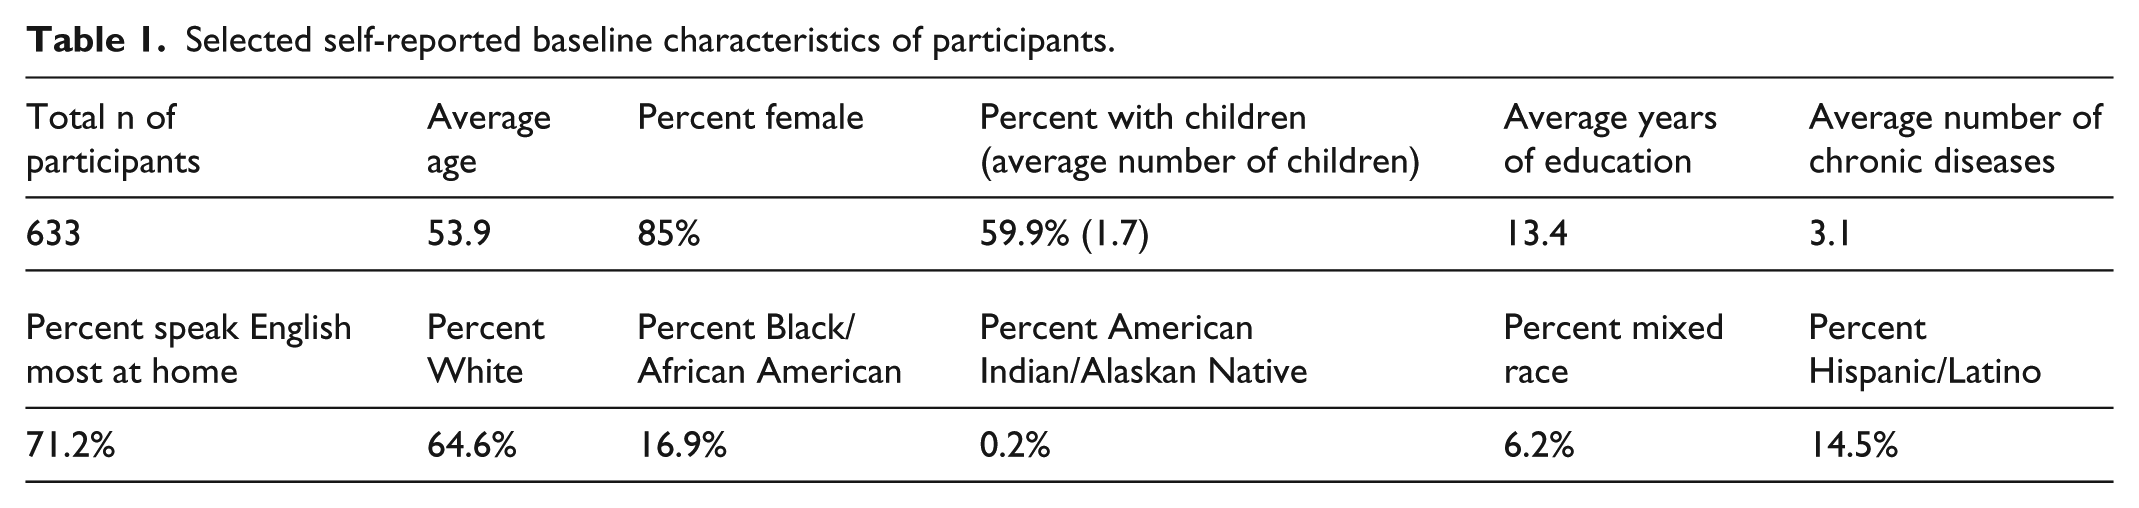
Of those responding to questions on education level, the average number of years of education was 13.4. Slightly more than half of the participants had a high school education or lower (n = 187) and slightly less than half had received more than a high school education (n = 145).
A total of 409 individuals reported they were White, 107 reported Black/African American, one reported being American Indian/Alaskan Native, and 39 reported being of mixed race. A total of 92 individuals reported of being Hispanic/Latino ethnicity.
English was reported as spoken most at home by 451 participants, and 103 participants reported speaking Spanish most at home. Two individuals reported speaking a language other than English or Spanish most at home. A total of 230 individuals reported being employed full time, 80 said part-time, 142 reported being unemployed, 137 said they were retired, 5 said they were self-employed, and 5 people reported being on disability. In regard to income, 179 participants reported a household income of less than $15,000 annually; 139 reported annual household income of between $15,000–$30,000; 109 reported household incomes between $30,000–$50,000, and 153 reported an annual household income of over $50,000.
Responses about health insurance included 135 reporting being on Medicaid, 155 on Medicare, 217 on employer-based insurance, 30 self-paid, 132 said they had other types of health insurance, and 33 reported not having any health insurance at the time. These data were collected in the time frame both before and after the passage of the Patient Protection and Affordable Care Act.
We also asked about the number and nature of chronic diseases. Self-reported chronic disease before the program began included 97 people who reported having asthma, 59 said cardiovascular disease, 147 reported Type 2 Diabetes, 182 reported being depressed, 264 reported hypertension, 407 reported being overweight or obese, and 215 reported some other type of a chronic disease. Overall, participants self-reported an average of 3.14 chronic diseases at pre.
Testing the Calgary Charter on Health Literacy scale
This new self-report, Calgary Charter on Health Literacy Scale, consists of five statements. Responses are on a commonly used time frequency-based Likert-type scale with four responses—Never, Sometimes, Often, and Always. An even number of response categories inherently prevents individuals from settling on the middle—or average—response.
The base question read to participants is, “Please tell me on the following scale from Never to Always how often you engage in the following tasks?” Ideally, participants are shown a large font size print-out of the scale’s four responses. The individual items read to participants are as follows:
Find or look for health information.
Understand information about your health.
Evaluate how health information relates to your life.
Communicate about your health to others.
Act on information about your health.
In Spanish, the scale is read to participants as follows:
Buscar información sobre salud.
Comprender información sobre salud.
Evaluar cómo se relaciona la información sobre salud con su vida.
Comunicarse con otros sobre su salud.
Actuar en función de la información sobre salud.
The Likert-type scale responses in Spanish are Nunca, A veces, Frecuentemente, and Siempre. The base question is read as, “Por favor indique en la siguiente escala desde nunca a siempre qué tan frecuentemente realiza las siguientes tareas.”
If a participant asks for further explanation of the evaluate statement, “For example, determine if and how information is relevant to your life” is read aloud.
Results
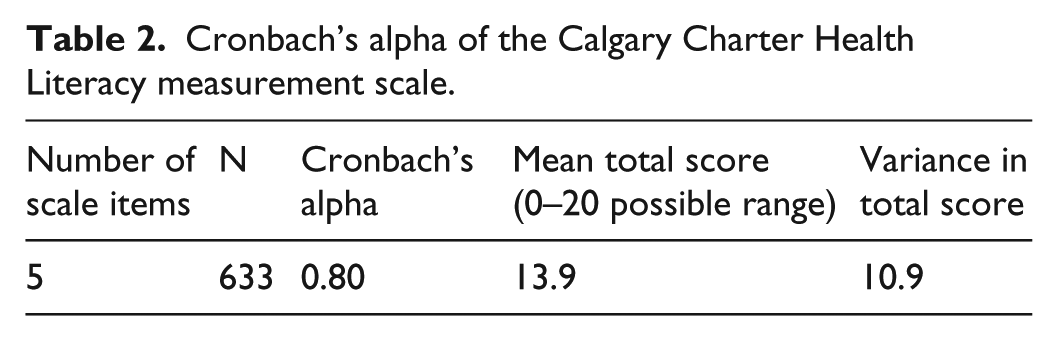
Cronbach’s alpha is a function of the number of items in a test, the average covariance between pairs of items, and the variance of the total score. Across all sites of the LEP to date, where we have employed this new measure of health literacy, Cronbach’s alpha is at a very acceptable level of 0.80. The five scale items consistently and significantly correlated with each other and the total scale score, which has a variance of 10.9. Thus, we can say the scale appears to be reliable (Tables 2 and 3).
Cronbach’s alpha of the Calgary Charter Health Literacy measurement scale.
Correlations between individual scale items and total score on the Calgary Charter Health Literacy measurement scale.
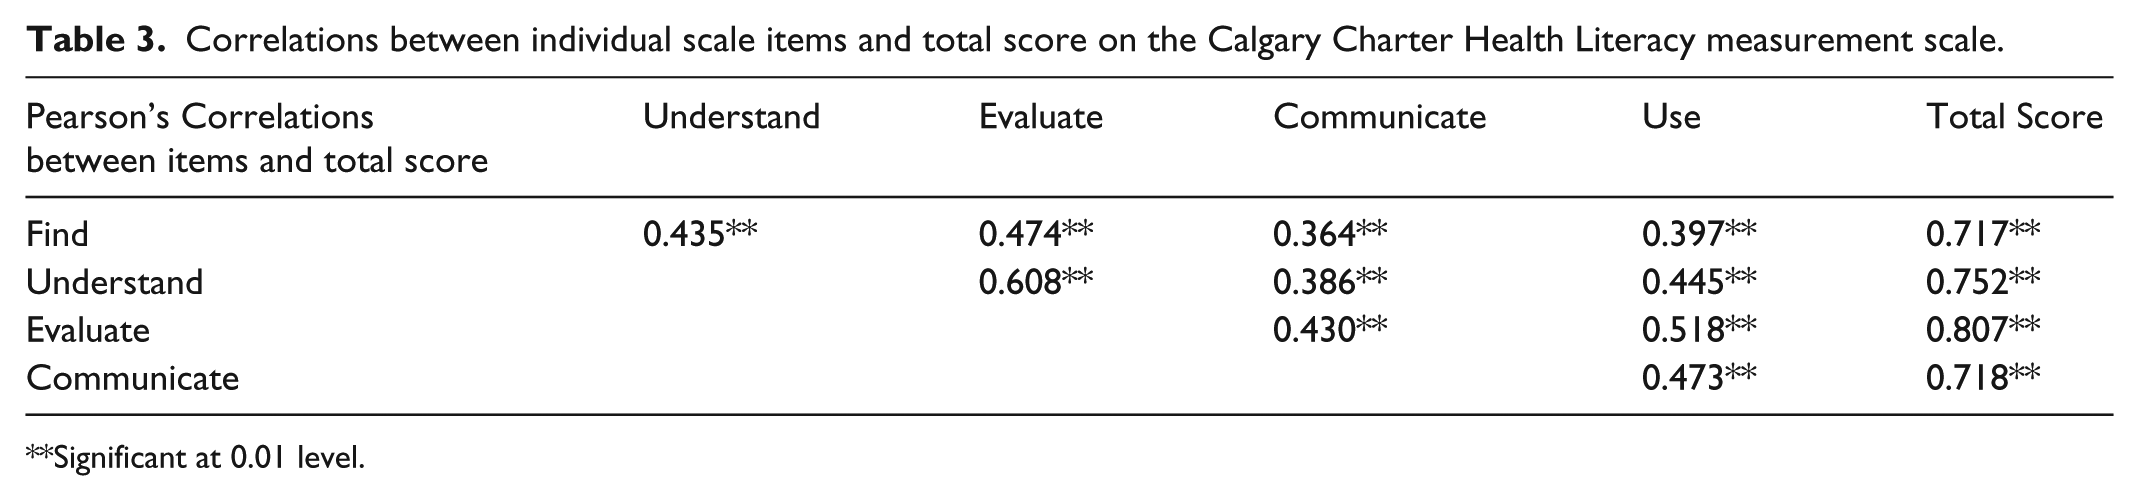
Significant at 0.01 level.
Validity is further demonstrated by hypothesized statistically significant correlations between the change in health literacy and participants’ changes in knowledge, attitudes, beliefs, behaviors, as well as numerous objective health status indicators.
In addition, in the evaluation and research component of the LEP, this new health literacy measurement scale is used at both pre and post. The intervention consistently creates statistically significant differences in health literacy for participants using matched pair analysis (n = 633; pre mean score 13.9; post mean score 15.4; change 1.5; N = 633; p ⩽ 0.000 at both 95% and 99% confidence intervals).
To check for multiple domains within the scale, we used factor analysis employing varimax rotation using an Eigenvalue of 1.0 as criteria. Only one component was identified that accounted for over 56% of the variance in responses. Thus, we have confidence that the scale is a coherent scale measuring much, but not all, of a single domain—health literacy.
As a preliminary first step in related work that is testing a larger causative model for poor health and well-being in communities, our evaluation research data include a wide array of other variables—many also being newly developed. In this report, we can utilize some of those variables to further flush out the validity and role of health literacy as measured by the Calgary Charter on Health Literacy Scale. Thus, we conducted correlational analysis using Pearson’s correlation method to identify significant relationships between the change in health literacy and the change in a variety of other health-related metrics included in the overall evaluation of the LEP at pre and post. We find significant correlations to a variety of important areas of knowledge, attitudes, behaviors, beliefs, and health status (both self-reported and objective markers of health status; Table 4).
Pearson’s correlations: change in Calgary Charter Health Literacy scale scores with pre/post change scores of other key indicators.
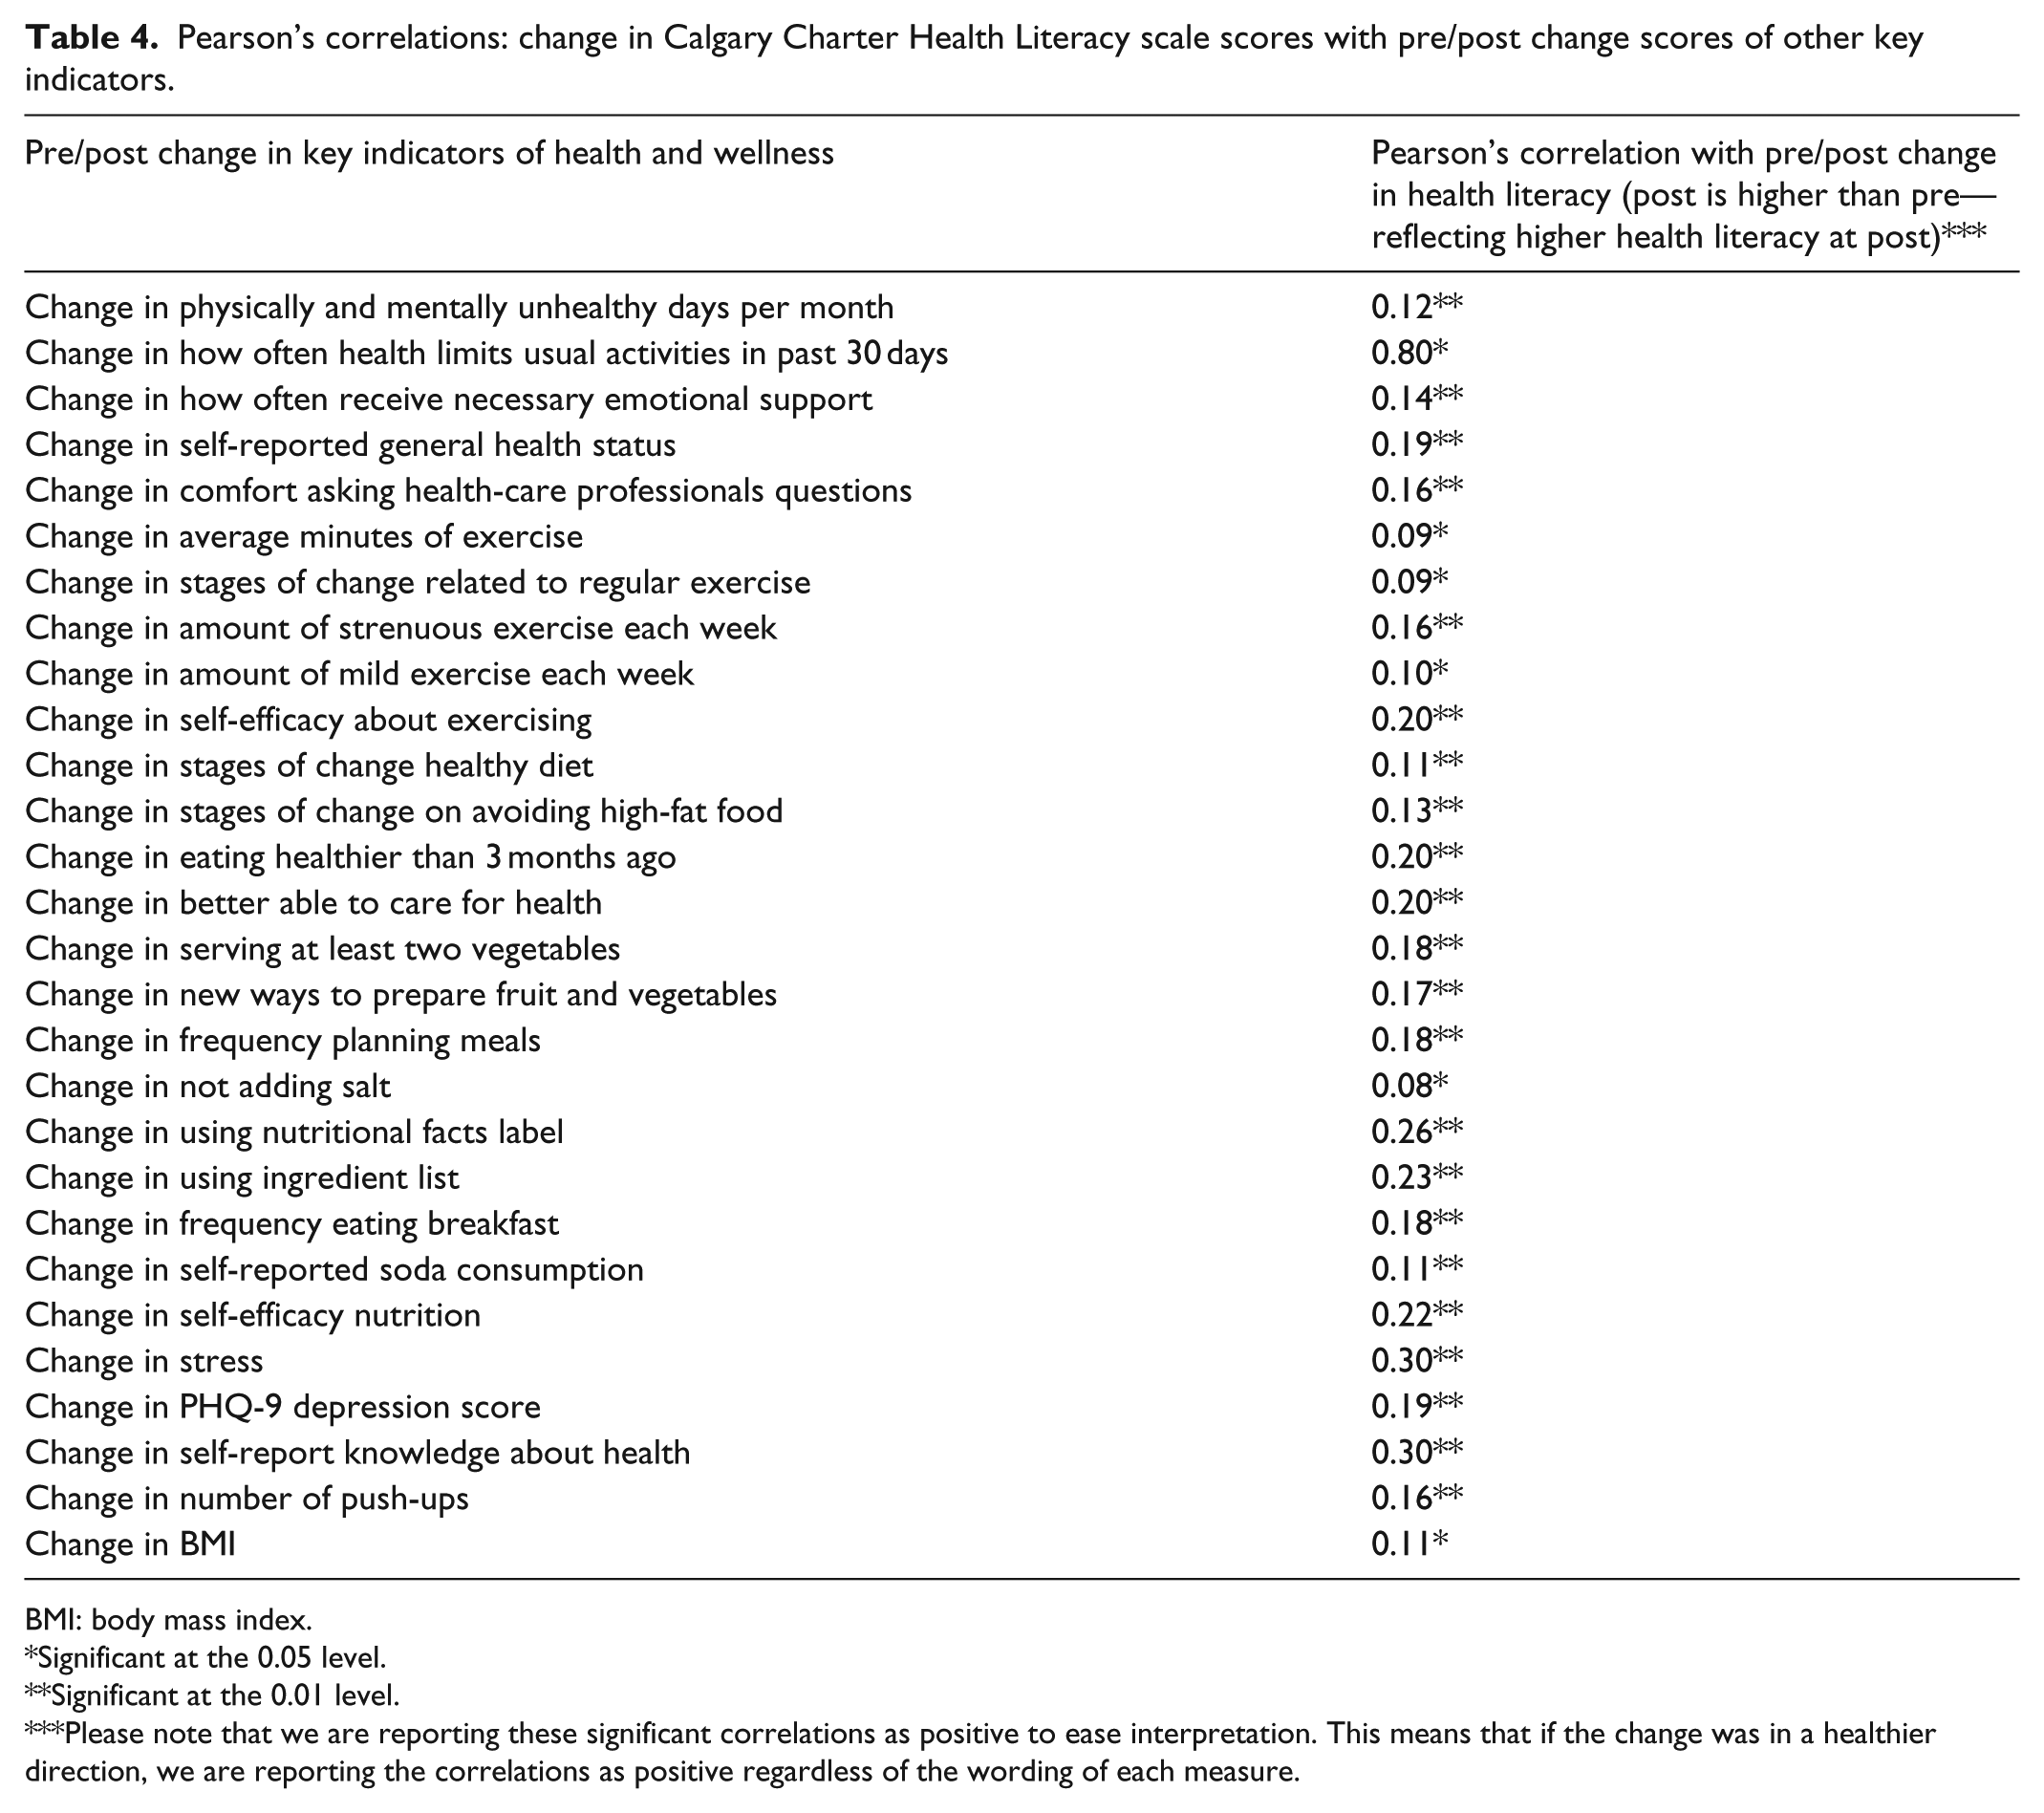
BMI: body mass index.
Significant at the 0.05 level.
Significant at the 0.01 level.
Please note that we are reporting these significant correlations as positive to ease interpretation. This means that if the change was in a healthier direction, we are reporting the correlations as positive regardless of the wording of each measure.
In this expanding pathway of our work, we have also started testing the usability, viability, and evidence-gathering strength of the new Calgary Charter on Health Literacy scale through regression analysis. The goal is to take the first small step toward building evidence on the theorized causative yet complex and inter-related pathways to informed health behavior changes through improved health literacy. We offer an early example of this work with a simple linear regression analysis based on pre and post differences—that is, the amount of change—using change in body mass index (BMI) of LEP participants as the health indicator of interest (and, thus, the dependent variable in the regression equation).
This analysis takes into account the site the LEP was offered at, number of children, age, gender, years of education, race, ethnicity, language spoken, having no health insurance, number of diagnoses of chronic diagnoses, pre/post change in number of push-ups accomplished, pre/post change in PHQ-9 depression score, pre/post change in self-reported amount of exercise, and pre/post change in Calgary Charter on Health Literacy score. The results indicate that a significant relationship exists including a statistically significant relationship between change in BMI and change in health literacy with other factors accounted for (R-squared = 0.585; adjusted R squared = 0.523, p = 0.000). This finding further demonstrated the validity of the Calgary Charter on Health Literacy scale, as one of the underlying hypotheses of this overall research effort is that improving health literacy will produce improvements in health status (Table 5).
Coefficients.
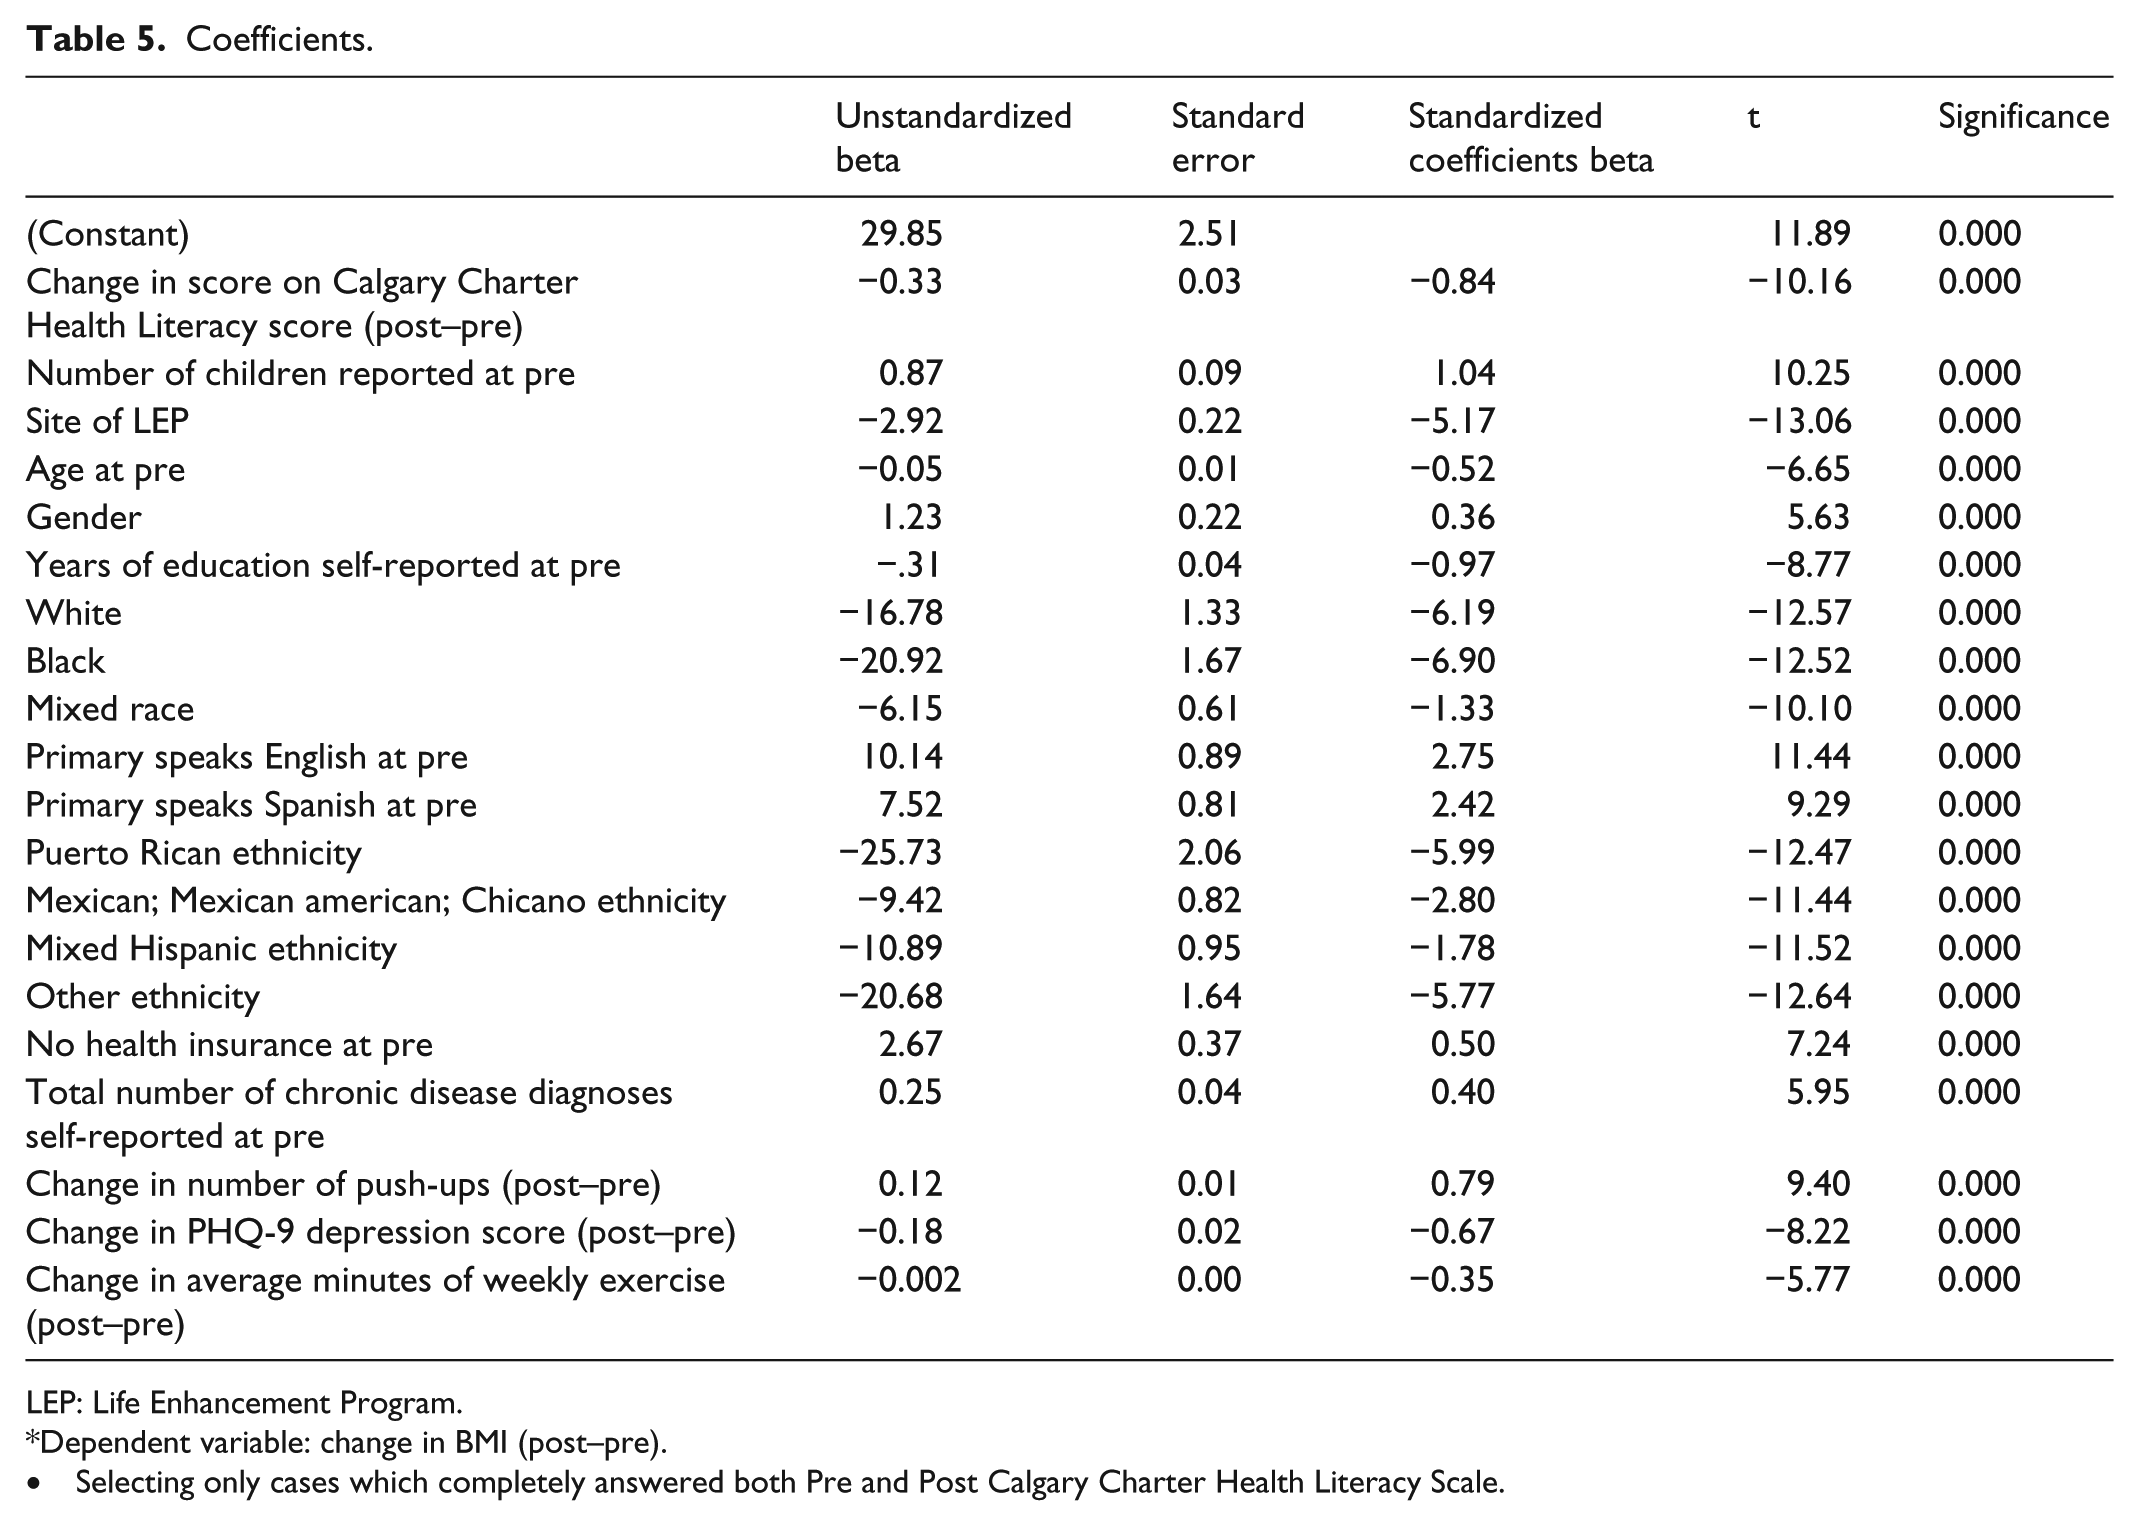
LEP: Life Enhancement Program.
Dependent variable: change in BMI (post–pre).
Selecting only cases which completely answered both Pre and Post Calgary Charter Health Literacy Scale.
Discussion
Uniquely, this new health literacy measure has shown statistically significant change and a significant correlation of that change with changes in other health metrics. This functionality of a health literacy measurement to identify statistically significant changes in health literacy has rarely been demonstrated with previous measures. Ideally, next steps in this development process include using this methodology in a pre/post study design that is adequately funded to include a control or comparison group.
Based on available data, the strengths of the Calgary Charter on Health Literacy Scale is that the new measure of health literacy is easy to use, appears valid and reliable in the multiple cultural and linguistic settings where testing has occurred to date, is applicable across all health contexts, and lays the groundwork for future development of more objective skill-based measures of health literacy.
Another strength is that the scale begins to indicate which areas of the use of underlying health literacy skills are stronger and weaker for individuals. Thus—be it in a clinical, research, or community setting—interventions can begin to be tailored to individual strengths and weaknesses. A limitation in this regard is that the scale does not directly measure skills, thus any intervention would be wise to conduct further formative research into individual skills and how they relate to these theory-based domains of application of those skills.
Regarding other limitations, this scale is not perfect and does not live up to our long-term goals for measurement of health literacy. However, it reflects a necessary next step. The scale is based on theory—something previously considered lacking in many efforts to develop a measure for health literacy. It is very easy to use and appears to support the development of a change score—something also considered lacking in many previous efforts. Furthermore, other ongoing projects not reported on in this initial documentation of the scale are confirming that the core scale can be successfully adapted to many, if not all, specific health contexts, which seems to have not been possible with any prior measures of health literacy to our awareness.
Nonetheless, it is worth repeating, the Calgary Charter on Health Literacy Scale is not perfect. Other limitations include, first, the scale is a self-report. Second, the categories of measurement—find, understand, evaluate, communicate, use—are broad and in fact represent many skills and much knowledge; we strongly suspect continued use and development of this scale will reveal several behavioral factors are present.
While we have translated the scale into Spanish, another current limitation is that the scale has not been translated into or tested in any other languages to date. Further, most but not all of this initial testing was conducted during an in-person interview. Thus, there is a need for more in-depth testing of the many various possible means of data collection—ranging from online applications to self-administered print-based to entirely oral.
We believe this scale is also applicable to the measurement of health literacy in health and medical professionals—but another limitation is that the scale has yet not been tested with those audiences.
In future testing and continued development of this scale and measurement of health literacy in general, we are concerned about the field’s current tendency to evaluate itself against itself over time. The critiques of existing health literacy measures and screeners are many and strong. If those critiques are correct, as a field we must explore how helpful validating a new tool against an existing measure truly will be. That should including asking whether a new measure of health literacy should deliver similar results to some of the existing measures and screeners or, are those initial efforts so flawed that they are invalid comparisons and markers of validity? In this instance, significant correlations with change scores of other standardized and highly-accepted and used measures (e.g. self-efficacy, health status, depression, and BMI) that reflect the underlying theory of what a change in health literacy should produce seem an even stronger indication of validity.
Public health implications
A clear and important benefit of this approach—beside the essential factors of ease of use and validity and reliability testing appearing to confirm the scale’s integrity—is that it creates a much-needed base for further research. By developing a “meta” level scale at the level of find, understand, evaluate, communicate, and use that is valid and reliable, future research can dig deeper into each of those areas within an already established context. Now, it seems very feasible to first document variations in health literacy and then conduct further research into those variations with more precise methodologies to discover exactly what is occurring for each individual. This is the scientific process in action.
Overall, the policy, delivery, and practice implications for the Calgary Charter on Health Literacy Scale are broad, especially when considering the unsustainable financial costs of low health literacy. Estimates of the costs of low health literacy vary but are often estimated as ranging from US$106 to US$238 billion annually in the United States. Given that economic significance combined with the individual and public health significance of health literacy, the ability to quickly and easily measure change in health literacy—and provide evidence that a change in health literacy is associated with changes in health status and cost—can further advance health literacy as an effective way to improve health at lower costs.
Footnotes
Acknowledgements
The authors thank all participants in the Life Enhancement Program. They also sincerely thank the Core Team members working at each site over the past several years. The development of this scale would not have been possible without their kindness and dedication. They thank the co-authors of the Calgary Charter on Health Literacy and all those who have and continue to add their name to the charter at ![]() . Finally, they would like to recognize the continual support of the board members of the non-profit Health Literacy Media.
. Finally, they would like to recognize the continual support of the board members of the non-profit Health Literacy Media.
Declaration of conflicting interests
The author(s) declared no potential conflicts of interest with respect to the research, authorship, and/or publication of this article.
Funding
The author(s) received no financial support for the research, authorship, and/or publication of this article.