
Abstract
In the last 5 years, more than 600 articles using respondent-driven sampling has been published. This article aims to provide an overview of this sampling technique with an update on the key questions that remain when using respondent-driven sampling, with regard to its application and estimators. Respondent-driven sampling was developed by Heckathorn in 1997 and was based on the principle of individuals recruiting other individuals, who themselves were recruited in previous waves. When there is no sampling frame, respondent-driven sampling has demonstrated its ability to capture individuals belonging to “hidden” or “hard-to-reach” populations in numerous epidemiological surveys. People who use drugs, sex workers, or men who have sex with men are notable examples of specific populations studied using this technique, particularly by public agencies such as the Centers for Disease Control and Prevention in the United States. Respondent-driven sampling, like many others, is based on a set of assumptions that, when respected, can ensure an unbiased estimator. Based on a literature review, we will discuss, among other topics, the effect of violating these assumptions. A special focus is made on surveys of persons who inject drugs. Publications show two major thrusts—methodological and applied researches—for providing practical recommendations in conducting respondent-driven sampling studies. The reasons why respondent-driven sampling did not work for a given population of interest will usually provide important insights for designing health-promoting interventions for that population.
Introduction
It is crucial to study populations that are at higher risk of contracting infectious diseases in order to implement interventions to prevent transmission of these diseases. People who use drugs, men who have sex with men, sex workers, and some immigrants are examples of populations that are more exposed and therefore vulnerable to HIV, hepatitis B and C, and sexually transmitted infections, in particular (Gile et al., 2015; Le et al., 2010).
However, it is difficult to conduct a sero-epidemiological survey within these populations because of the illicit nature of some practices, such as drug use or sex work (depending on the country’s legislation). Moreover, these populations are often stigmatized, and the individuals who comprise them are hard to reach because their practices are hidden (hence the term “hidden population”) and their living conditions make it difficult for interviewers to approach them on account of location (e.g. in the case of squatting) or sometimes for safety reasons.
When no sampling frame exists and traditional survey techniques cannot be used, techniques specifically designed for hard-to-reach populations have been proposed and used (Magnani et al., 2005; Spreen, 1992). Examples of such sampling techniques are snowball (Goodman, 1961), network (Birnbaum and Sirken, 1965; Granovetter, 1976; Sudman et al., 1988), targeted (Watters and Biernacki, 1989), random walk (Klovdahl, 1989), adaptive cluster (Thompson and Seber, 1996), time-space (Mackellar et al., 1996; Muhib et al., 2001), and link-tracing (Chow and Thompson, 2003; Félix-Medina and Thompson, 2004; Thompson and Frank, 2000). Capture–recapture is another method to estimate a population size (Ruiz et al., 2016). However, from a statistical standpoint, some of these techniques are not based on a random selection of individuals. This can lead to a bias in the estimates of epidemiological indicators and their variances since some individuals in the population of interest may have a zero probability of being recruited. Other techniques use, in the first stage, lists of places in which individuals belonging to the population of interest can be interviewed, as in the case of time-location sampling (Karon and Wejnert, 2012). As a result, these sampling methods are not useful for surveying hard-to-reach populations.
To overcome these statistical and practical limitations, a new method, called respondent-driven sampling (RDS), was developed by the sociologist Douglas Heckathorn (1997) in the late 1990s. The objectives of this sampling were to build a sample of socially networked individuals belonging to a hidden or hard-to-reach population and produce an unbiased estimate of the functions of interest (e.g. prevalence or strength of association) in this population.
Starting in the early 2000s, this sampling method, seen as innovative particularly for dealing with selection bias, was used to a great extent to survey hard-to-reach populations. Between 2003 and 2007, it was already used in more than 120 studies in 20 different countries, representing more than 32,000 individuals recruited for the only behavioral and biological HIV studies (Malekinejad et al., 2008; Montealegre et al., 2013; White et al., 2015). In 2005, the American Centers for Disease Control and Prevention (CDC, 2009) alone surveyed more than 13,000 drug users in 20 US cities. RDS is also often used in low-income countries, in order to implement surveys on hard-to-reach populations, due to the low cost of this type of study and its ability of reaching many people within a very short time period. In 2010, a special issue in this journal (Vol 5, issue 2) was devoted to methods for hard-to-reach populations. In this issue, RDS was discussed (Johnston and Sabin, 2010) and compared with time-location sampling (Semann, 2010). In 2013 (since the mid-1990s), 460 studies from 69 countries used RDS (White et al., 2015).
Researchers’ enthusiasm for this method was the consequence of their many years of frustration with having only the previous methods at their disposal, all of which were known to have major drawbacks. However, RDS, based on strong assumptions, began to be widely used before there was enough time to determine the validity of the method, assess the conditions for applying it, and ensure that the underlying assumptions were respected. Its use outpaced its methodological development, which made the results of some studies open to question.
This article aims to briefly describe the principle of RDS, to identify the main estimators used, in particular the RDS-II estimator that is unbiased under certain assumptions, and to describe the behavior of the RDS-II estimator when certain assumptions are violated. Finally, practical considerations for RDS studies applied to persons who inject drugs (PWID) are discussed.
Principle of RDS
The principle of this sampling is fairly simple. First, the study investigator looks for individuals (called seeds) who belong to the population of interest and know a sizable number of individuals in it. The investigator contacts these seeds and, in a location adapted to the survey, administers a questionnaire to them, possibly supplemented by medical examinations and/or biological sampling. When they leave, they are given one or more coupons that bear a unique identifier, the address of the survey premises, and the name of the study. Each seed is to give the coupons to people he or she knows or in some cases more precisely with people with whom they had sexual intercourse or had shared injecting equipment. Quite often, participants are paid to take part in the study and recruit others. Once the seeds have distributed the coupons to their peers, the latter go to the premises to complete the questionnaire and the medical examinations and to recruit others. These persons recruited by the seeds constitute Wave 1, as illustrated in Figure 1. When they have finished, the individuals recruited in Wave 1 are given coupons that they in turn give to others, who make up Wave 2 and also go to the survey location. This process is repeated until the pre-determined sample size is reached. The numbers on the coupons identify who recruited whom to allow researchers to reconstruct the recruitment chains.
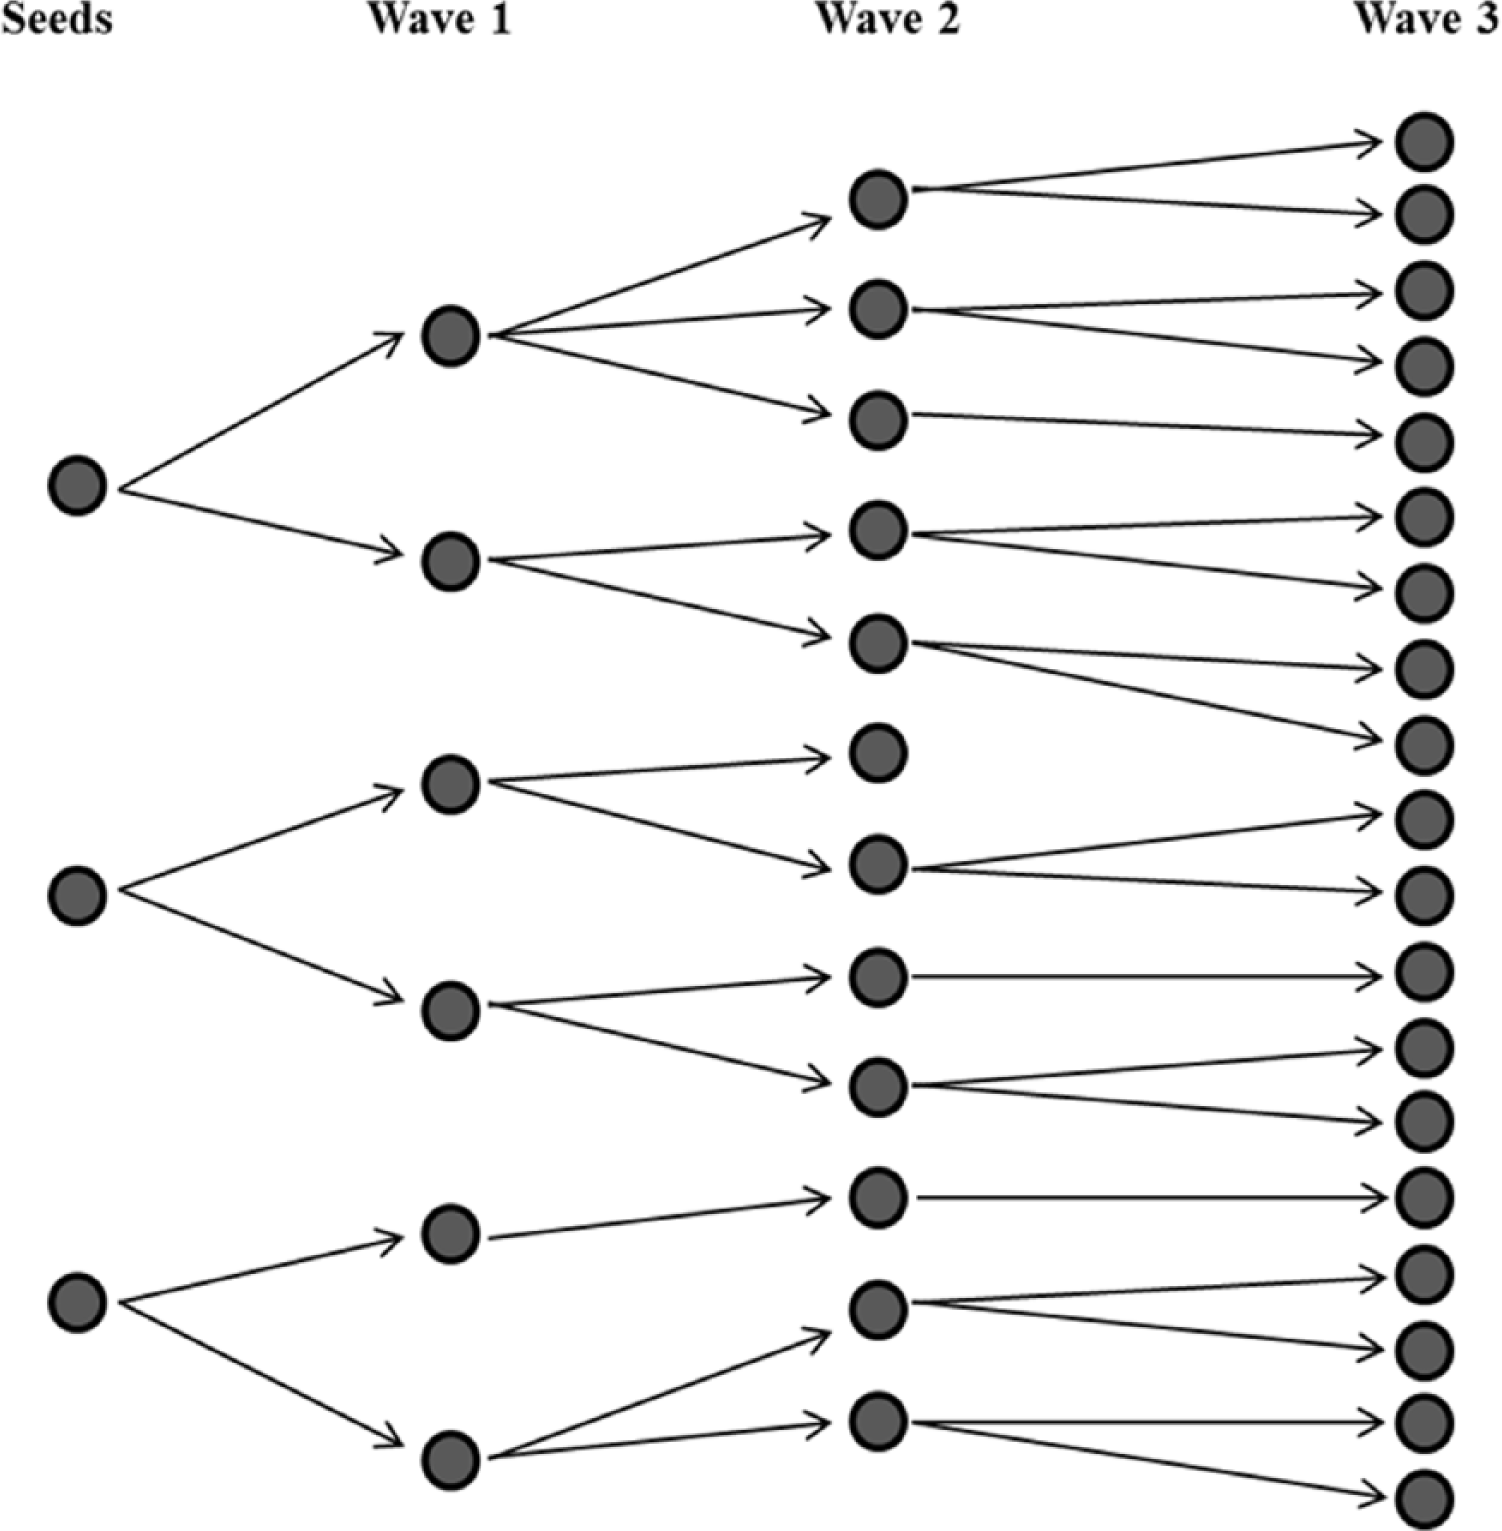
Simplified representation of the first three waves of RDS recruitments. Each circle represents an individual and each arrow represents the distribution of a coupon from an individual to another. For a given wave, individuals are not recruited at the same time and the social network of each individual is not represented.
RDS can be viewed as a technique for populations described by small-world theory, in which any individual in a given population may be indirectly associated, via his or her social network, with any other individual belonging to the same population through approximately six intermediaries (Killworth and Bernard, 1978). According to this theory, starting with a sampling method based on recruitment chains, any individual should be able to be included in the sample with a strictly positive probability.
For a given individual i, the true number of his or her relationships is called the degree, noted
Estimators
RDS is a complex stochastic process since in theory, it is a branching process without replacement, on an arbitrary graph of social relationships that begins with a seed convenience sample (Gile and Handcock, 2010). Thus, if we are interested in a population composed of two groups of individuals (e.g. group A: infected persons and group B: non-infected persons), we can expect that the properties of the estimator of the infected proportion, noted
Several estimators have been proposed to estimate a proportion. Two of the most popular estimators are RDS-I, also called the classical estimator or the SH (Salganik–Heckathorn) estimator (Heckathorn, 2002), and RDS-II, also called the VH (Volz–Heckathorn) estimator (Volz and Heckathorn, 2008). We note
RDS-I (or SH) estimator
Following classical notations (Tomas and Gile, 2011), we note
The RDS-I estimator for
RDS-II (or VH) estimator
The RDS-II estimator for
Using simulations that compare the mean square errors of the two estimators, it was shown that the performance of RDS-II was almost always superior to that of RDS-I (Gile and Handcock, 2010).
The RDS-II estimator is currently the estimator used in RDSAT (respondent-driven sampling analysis tool), a free program for analyzing data from RDS surveys. Its variance is estimated using a bootstrap method (Salganik, 2006). It has been shown that the RDS-II estimator is asymptotically unbiased under the following assumptions (Volz and Heckathorn, 2008):
The sample is selected with replacement.
The sampling fraction is small.
Each individual recruits only one individual (number of coupons = 1).
The respondents state precisely what their degree in the network is.
Recruitment of each individual (including seeds) is random.
Relationships are reciprocal (undirected network).
Population consists of one connected component (every individual can be reached by a finite path from any other individual).
The estimator’s lack of bias is therefore based on a priori assumptions, and it is legitimate to ask how this estimator will behave if one or more of those assumptions are violated. Since RDS is a complex process, the estimator’s properties are studied through simulations and not through analytical developments. Several recent publications have measured the performance of RDS-II and shown that this estimator could be biased in some circumstances (see subsection “Performances of the RDS-II estimator”).
In 2011, Gile (2011) proposed a new estimator called RDS-SS. It is based on successive sampling, equivalent to probability proportional to size without replacement sampling. RDS-SS iteratively estimates both the degree distribution and the inclusion probabilities. Gile shows that the RDS-SS estimator offers an interesting alternative to the RDS-II estimator in terms of bias related to the sampling fraction and the ratio of the average number of degrees between infected and non-infected persons. That being said, this estimator, like others, can induce biases; these are presented in a summary table in an article by Tomas and Gile (2011). Recently, these three RDS estimators have been implemented in the R (R Core Team, free statistical software) packages RDS (Handcock et al., 2009) and RDS Analyst (Handcock et al., 2013). However, the great majority of researchers used a publicly available software application (RDSAT) in which only RDS-II estimator is implemented. We will therefore come back to the latter’s performance.
Performances of the RDS-II estimator
Gile and Handcock (2010) measured the performance of RDS-II, in particular the procedure for selecting seeds (non-infected, random and infected seeds), the behavior of respondents (whether homophily is weak or strong (individuals recruit more in their own group)), the sampling fraction, and the mean degree according to disease status (infected or non-infected). The authors show that a bias is induced by seed selection and the level of homophily. The real prevalence (simulated) is underestimated when the seeds are non-infected, and this underestimation is greater when homophily is strong. This is due to the fact that when homophily is strong, non-infected seeds tend to recruit non-infected individuals who will in turn recruit non-infected individuals. Ultimately, the sample will be essentially composed of non-infected persons, leading to an underestimation of prevalence. Bias is close to zero when seeds are selected randomly, regardless of the level of homophily. When the seeds are infected, prevalence will be overestimated, and the stronger the homophily, the greater this overestimation will be.
Gile and Handcock also showed that the bias of the estimator depends on the ratio of the mean number of degrees of infected persons to that of non-infected persons and the sampling fraction. Bias increases when both the sampling fraction and the ratio increase. Thus, when infected persons have a higher mean number of degrees than non-infected persons, prevalence is increasingly underestimated. Another study examined in-depth simulations to test the violation of each assumption (Lu et al., 2012). The main findings of that study indicate a major bias when the network is one-directional (i.e. when one individual may know another individual but not vice versa) or when respondents choose to recruit individuals who have characteristics correlated with the variable of interest (such as disease status). On the other hand, the authors of that study consider that the estimator is robust with regard to sampling without replacement, low response rate, some degree-reporting errors, and the seed selection criterion. These conclusions are different from those of Gile and Handcock as regards sampling without replacement and seed selection.
A recent simulation-based study showed significant bias if degrees are inaccurately reported (Mills et al., 2014). The authors demonstrated that obtaining correct degrees for individuals reporting low degrees is of particular importance because these individuals have higher weights and are less likely to be infected. It is thus crucial to recover accurate degrees through some relevant questions which represent a real challenge.
The properties of the RDS-II estimator can also be considered in terms of the size of the design effect. Using real data, Goel and Salganik (2010) showed that the design effect could be sizable. Based on their data, they obtain a range for the design effect between 5.7 and 58.3 and a median of 11. In relation to epidemiological surveys using more traditional survey designs, this shows that the variance of the estimator is high. This variance increases when the number of coupons increases and homophily increases (Lu et al., 2012). Recently, even if design effects varied across countries and populations, researchers recommended a design effect between 2 and 4 in RDS studied to estimate the sample size (Johnston et al., 2013; Wejnert et al., 2012).
Violation of assumptions
The simulation studies show that the bias and variance of the RDS-II estimator depend on a set of assumptions (listed in subsection “Estimators”) that cannot be controlled by the person in charge of the survey. It can therefore be expected that in reality, these assumptions will not be checked to potential biases. The literature shows that some of the assumptions (assumptions 3–6) are indeed often violated. Examples of this are use of more than one coupon (Johnston et al., 2008; Malekinejad et al., 2008), respondents have difficulty stating precisely what their degree is (Marsden, 2005), non-random recruitment (Frost et al., 2006; Liu et al., 2012; Wang et al., 2005), or not all relationships are two-way (Abramovitz et al., 2009; Iguchi et al., 2009; Ma et al., 2007; Paquette et al., 2011).
Practical considerations for RDS studies of PWID
RDS has probably been used for more studies of PWID than with all other “hard-to-reach” populations combined, and a fair amount of practical knowledge for conducting RDS studies of PWID populations has accumulated (Malekinejad et al., 2008; Rudolph et al., 2011). Whether the RDS assumptions noted above will hold in any specific study of PWID will depend upon a number of practical concerns as well as the underlying theory.
First, how can the researchers determine that the social structure of the population to be studied conforms to the RDS assumption of a fully networked structure? Specifically, whether there are no separations within the population that would have large effects on recruitment. There may be critical divisions within the local PWID population that would greatly reduce the likelihood that people in one subgroup might recruit people in another group. Examples would include groups that inject different drugs, or members of different racial/ethnic groups, or PWID who live in different geographic areas of the same city (Linton et al., 2015).
Qualitative/ethnographic research can often be used to identify potential subgroups within the overall local PWID population where it would be very unlikely that a member of one group would recruit a member of the other group. If this does appear to be the case, then it may be best to reformulate the research as two studies of two different PWID populations. This will, of course, require a sample size for each of the subgroups large enough for the needed statistical analyses. And it will greatly increase the cost of the study. There is no ironclad decision rule for using qualitative data for making the decision to conduct separate RDS studies for different groups within a total local PWID population.
Second, is the sample size large enough to reach “equilibrium”? Equilibrium occurs for an RDS sample, when the important characteristics of the sample (gender, HIV status, age, race/ethnicity, drugs injected, etc.) remain constant over following waves of subject recruitment. Equilibrium is an indication that subject recruitment is no longer determined by the characteristics of the initial seeds. It often requires sample sizes of several hundred to know that one has reached equilibrium. Failure to reach equilibrium creates a strong suspicion that the estimators are biased.
Third, the study needs to have the capability of handling large numbers of subjects at once. One of the virtues of RDS is that it will typically recruit many subjects within a short time period. RDS recruitment is geometric, that is, the number of potential subjects—person with coupons who meet the study eligibility criteria grows quickly. If each subject recruits an average of two additional persons who desire to participate in the study, then the number of persons wanting to participate will double with each recruitment wave. Working with large numbers of subjects then requires scheduling of the research appointments. This can be done as the coupons are given to each subject (the coupon is valid for only a specific time on a specific date) or by asking subjects to come to the research site to schedule an appointment. As people who use drugs are usually not very good at keeping precise appointments, precise scheduling means that some potential subjects will not participate because they did not present at the research site at the scheduled time. There may be important difference between subjects who do and subjects who do not keep tight appointments, creating another source of possible bias in the study. Having some flexibility to take subjects even though they do not present at the proper time would reduce such bias, but becomes quite difficult when the study staff are trying to process large number of subjects.
Furthermore, to avoid and to control for potential duplication in some surveys, a combination of biometric measures of each respondent can be used (e.g. length of each forearm) (Heckathorn et al., 2002; Uuskula et al., 2011) or other specific identifiers (e.g. mother’s maiden name, birth date) (Rudolph et al., 2011).
This section has not attempted to address all of the practical issues that frequently arise in RDS studies of PWID. Rather, it attempts to broaden the discussion beyond the theoretical assumption to some of the practical issues that may be equally important to conducting and interpreting an RDS study. In general, these issues arise from the success of RDS as a method for rapidly recruiting large numbers of subjects within a scientific framework that, if the theoretical assumptions can be met and the practical problems minimized, can combine the most sophisticated sampling method and the greatest cost-efficiency for studying hard-to-reach populations such as PWID.
Discussion
Recent publications show two major thrusts in research on RDS. The first thrust is methodological research. There is a need to continue studying the properties of existing estimators and to improve the estimators and their variances. The second thrust is applied research, which consists in verifying the assumptions when a survey is conducted and addressing the practical issues in conducting RDS studies. These assumptions have often been ignored in the past, making it difficult to discuss the accuracy of the results produced. Very recent articles show that this research is ongoing, with a realization that the method had to be evaluated from different angles (Dombrowski et al., 2013; Lansky et al., 2012; Liu et al., 2012; McCreesh et al., 2011, 2012; Rudolph et al., 2013; Salganik, 2012; Wylie and Jolly, 2013).
However, some questions remain unanswered for anyone wanting to carry out RDS. As regards estimators, the question arises as to whether to continue using the RDS-II estimator and its bootstrap variance or whether the RDS-SS estimator should be used instead, knowing that it has been recently implemented only in the statistical software R. From a more practical standpoint, this raises further questions for the survey investigator: Are the conditions right (i.e. the assumptions are true) to use this sampling method? Should preliminary studies be carried out to determine the characteristics of the social network? Should this type of survey be ruled out in some cases? Salganik (2012) calls for the data from RDSs to be made available so that the evaluation and development of this sampling method can be completed. White et al. (2012) have proposed a set of information to be reported in RDS studies adapted from the STROBE guidelines developed for cross-sectional studies (Von Elm et al., 2007). Finally, diagnostic tools and practical recommendations have been recently proposed to be applied before, during, and after data collection to improve RDS sampling and inference (Gile et al., 2015).
This seems all the more important since this method is being extended to areas other than the study of hard-to-reach populations, particularly its use in telephone surveys (Lee et al., 2011), in web surveys (Schonlau et al., 2014; Stein et al., 2014), or even in recruiting participants to assess the effectiveness of HIV-prevention measures in clinical trials (Solomon et al., 2013).
RDS can be used simply as a time-efficient method of recruiting “hard-to-reach” populations. Paying subjects to recruit other subjects will be usually more cost-effective than paying research staff to recruit subjects in populations with strong social networks. There will be many occasions, however, when RDS does not work as well as the researchers hoped. There may be very high positive homophilies and failure to reach equilibria in the data, suggesting that there is not a single network in the population of interest (a “small world”) but rather the population is fragmented into two or more subpopulations that need to be considered separately. It is also possible that the population of interest is not socially networked. For example, commercial sex workers who use the Internet for attracting customers may not be sufficiently networked with each other to sustain recruitment chains. Men who have sex with men who meet in anonymous locations, such as parks or restrooms, also may not be able to recruit each other. For PWID, one of the key of success is to recruit seeds with large networks and with whom people are confident; the question of confidence is crucial for improving the recruitment of PWID with RDS.
In such situations, where either the underlying assumptions in RDS theory do not hold or RDS recruiting does not produce large numbers of subjects, the data may still be analyzed as a convenience sample, with the knowledge that the sample is not representative of the underlying population of interest. Most importantly, if RDS does not work for a given population of interest, the reasons why RDS did not work will usually provide important insights for designing health-promoting interventions for that population. Both RDS and many health-promoting interventions rely on positive peer relationships, and if RDS does not work, the interventions are also likely to not work.
Footnotes
Declaration of conflicting interests
The author(s) declared no potential conflicts of interest with respect to the research, authorship, and/or publication of this article.
Funding
The author(s) received no financial support for the research, authorship, and/or publication of this article.