
Abstract
A core aspect of musical performance is communicating emotional and expressive intentions to the audience. Recognition of the musician's intentions is constructed from a combination of visual and auditory performance cues, as well as compositional features. The current study attempted to quantify these contributions by measuring relationships between ratings of perceived emotion, and motion and auditory performance features. A pianist and violinist with advanced degrees in music performance individually performed four short western tonal pieces. The musicians were tasked with performing the pieces while invoking different expressive intentions: sad, happy, angry, and as a control, deadpan. To examine how different expressive intentions influenced performance behavior, the musicians’ body movements were tracked using optical motion capture and rendered into point-light animations. Participants rated perceived emotions (happiness, sadness, tenderness, anger) in audio-only, video-only, and audiovisual rating conditions. We first explored how compositional aspects of the music and performers’ expressive intentions contributed to ratings across the three viewing conditions. Through a series of analyses of variance, we found that participants successfully decoded the performers’ expressive intentions based on visual information alone and auditory information alone. In the rating conditions in which audio was present, compositional aspects had a stronger effect on participant ratings than performers’ expressive intentions. Next, we quantified relationships between the ratings and both motion and auditory performance features. Of the features investigated, musical mode had the greatest impact on ratings. Additionally, perceived emotion ratings were more consistent among responders in conditions with audio than without. These results suggest that, in music performance, auditory information is conceptualized by most responders in a similar way, while visual information might be open to a variety of interpretations.
A core aspect of musical performance is communicating emotional and expressive intentions to the audience. Performance research of the last quarter-century has stressed that musicians not only communicate intentions aurally but also visually (Behne & Wöllner, 2011; Davidson, 1993; Dahl & Friberg, 2007). The visual channel presents the audience with bodily gestures, which observers use to identify how expressive a performance is, or which emotions the musician intends to express. Previous work has found that kinematic cues from motion captured performances play a significant role in communicating different levels of musical expressivity (Vuoskoski et al., 2014; Vuoskoski et al., 2016). In the current study, we extended this work by asking participants to rate perceived discrete emotions (e.g., happiness, sadness, anger, and tenderness) in piano and violin performances, and further explored the relative contributions of compositional aspects and performers’ expressive intentions across different presentation conditions. Additionally, we used regression to quantify the relationships between participants’ ratings of emotions, and movement and audio cues derived from the performances.
Musical expression has been defined by nuances in timing, intensity, timbre, and pitch that give a musical performance its unique character and distinguish it from other renditions of the same piece (Palmer, 1997). From an audience's perspective, these creative alterations might act as acoustic cues to identify musicians’ intentions and the emotional qualities of music. In western classical music, musicians rarely alter notated pitch and duration. Rather, expressivity is borne from emphasizing ambiguous aspects of the compositional structure such as micro-timing and dynamics (Clarke, 2005). These creative choices enable musicians to communicate ideas and intentions to audiences, who, in turn, make aesthetic judgements as to whether those choices are stylistically appropriate or successful (Akkermans et al., 2019; Gabrielsson & Juslin, 1996).
The study of musical expression has extended to encompass psychological and biological movement aspects (Juslin, 2003). Early work by Davidson (1993) introduced a paradigm in which musicians perform various renditions of the same piece of music while employing different levels of musical expressivity, and observers evaluate the visual impact using ratings of perceived expression. This study influenced a broad area of music and movement research, including the study of ancillary movements uninvolved in the production of sound (Wanderley, 2002) and, more generally, musical gestures. Musical gestures are generally defined as bodily movements or gestures that have meaning. Various theoretical frameworks have been used to explain how gestures evoke musical ideas. Applying Peirce's Theory of Signs, gestures may be indices illustrating a causal relationship between movement and expression (Clarke, 1995). From an ecological perspective, it is argued that musical gestures contain affordances that can be perceived by individuals with specific histories related to the context of music performance. In Gibsonian understanding, affordances contain calls to action (e.g., a chair affords sitting, and music affords dancing; Gibson, 1979). The question of what physical action is being called for in a music-listening situation might be viewed as a limitation of the notion of affordance. However, the enactive and embodied views of perception hold that perception is an active process. From this perspective, the call to action might be related to sensorimotor processing of perceptual input, such as the memory of past experiences with musical expressions evoked through listening to music (see also Shapiro, 2014; Wilson, 2002)
For an enculturated listener, the music's auditory stream is embedded with rich signifiers the listener uses to draw meaning from performances. Musicians perform expressive gestures regardless of whether the audience sees them. Windsor (2011) has evocatively described this as the performer leaving ‘traces’ in the environment, to be picked up by listeners. A person listening to music might imagine physical gestures used to perform the music based on the cues contained within the auditory stream. Whether a feature of movement, such as its kinematics (e.g., speed and acceleration), has a clear relation to the perception of emotional intention in a listening situation, remains an empirical question.
The relationship between the perception of emotions and musical auditory content has been studied using quantitative methods such as regression. Various studies have found that happy emotional content is associated with fast tempo, major mode (Dalla Bella et al., 2001; Juslin, 2000; Peretz et al., 1998), high pitch, increased sound level (Lange & Frieler, 2018), and soft timbre (Juslin & Lindström, 2010), while sadness is generally linked to features inversely associated to happiness. Anger is associated with fast tempo, increased sound level, high-frequency content (Juslin, 2000), and sharp timbre and minor modes (Juslin & Lindström, 2010; Lange & Frieler, 2018). Fear has been found to be related to reduced sound level, staccato articulation, large articulation variability, soft timbre (Juslin, 2000), and minor mode (Juslin & Lindström, 2010; Lange & Frieler, 2018). Tenderness is related to slow tempo, reduced sound level (Lange & Frieler, 2018), low pitch, major mode, soft timbre (Juslin & Lindström, 2010), and reduced changes in dynamics (Eerola et al., 2009). The most significant feature may be mode (i.e., major or minor) (Eerola et al., 2013). Battcock and Schutz (2019) observed that mode predicted the most variance for perceived valence, which is the degree of perceived positiveness or negativeness (e.g., sadness, anger, and fear have negative valence, while happiness and tenderness have positive valence).
Relationships between the perception of emotions and musicians’ movements have also been studied. Dahl and Friberg (2007) presented marimba, bassoon, and soprano saxophone performances to participants, who rated them for perceived emotional intentions happiness, sadness, anger, and fear under three conditions (audiovisual, video-only, audio-only). All intended emotions were recognized except fear regardless of condition. Participants also rated movement content, and significant relations were found between emotions and movement features: happiness was associated with slow speed (bassoon), and large amounts of movement (marimba and saxophone); sadness with small amount of movement (marimba), slow speed (all), and smooth fluency of movement (marimba); anger with large amount of movement (marimba), fast speed (marimba), and jerky fluency of movement (all); and fear with small amount of movement (marimba and saxophone). Crucially, facial expression was not presented to the participants. A variant of this paradigm is to use point-light skeleton animations produced with motion-capture data of music performances, which allow observers to view broad movement patterns without the influence of facial expressions (Burger et al., 2013; Eaves et al., 2020; Vuoskoski et al., 2014).
Previous work by Vuoskoski et al. (2014) and Vuoskoski et al. (2016) has influenced the aims and set-up of the current study. Vuoskoski et al. (2014) reported that visual kinematic performance cues were more important than auditory performance cues when making ratings of perceived expressivity in audiovisual excerpts of piano playing. A novel and balanced manipulation of stimuli, in which motion-capture videos of piano performances were time-warped to fit to non-corresponding audio, enabled the authors to quantify the respective contributions of visual and auditory cues in self-report ratings of perceived musical expressivity. In contrast, Vuoskoski et al. (2016) explored the contributions of visual and auditory cues in self-reports of felt emotions in reaction to musical performances. Again, results highlighted the important role of visual cues for observers’ experience of musical performances.
The current study differs from previous similar work in three important ways. First, we added violin performances to contrast previous findings. Our aim was not to produce results generalizable to all instrument groups and situations, but rather to bring attention to differences in the way emotional communication is expressed between two important western instruments. Second, while other studies have looked at emotional engagement or induction of emotions when viewing or listening to musicians’ instrumental performances (Camurri et al., 2004; Castellano et al., 2008; Vuoskoski et al., 2014; Vuoskoski et al., 2016), these are different questions than emotion perception or emotion recognition. Instead of focusing on the notion of musical expressivity, participants rated the performances with respect to perceived discrete emotions: tenderness, sadness, happiness, and anger (see Eerola & Vuoskoski, 2011). The music performed on both piano and violin consisted of short pieces that had been validated to express specific emotions (details in the Methods section). Musicians performed each piece while expressing emotional intentions either congruent or incongruent with the validated emotion (e.g., a happy piece performed in a happy, sad, tender, angry, or manner, etc.). Third, the analysis examines relationships between participant ratings and features computed from the motion-capture data, as well as acoustic and musical features extracted from the audio signal and the musical score. Performances were presented to participants in three modes: audiovisual, video-only, and audio-only.
We expected to find cross-modal relationships between auditory and visual features when perceiving musical expressivity. As suggested by Windsor (2011), music presented in one modality can give the perceiver cues as to information from another modality. For instance, in a listening condition, louder sounds might evoke images of faster gestures. Evidence for this proposition was measured by correlating all presentation conditions with both audio and motion features, as well as using a mixture of audio and motion features as predictors in multiple regression models. Finally, regarding the contribution of composition to ratings of perceived emotion, we hypothesized that musical mode would have a significant effect on perceived emotion, even when the pieces were performed incongruently (e.g., a happy piece in major mode performed angrily).
Methods
Piano and Violin Performances
A violinist and a pianist were recruited to record solo performances of four short musical pieces, each with four different kinds of emotional expressions. Both musicians were advanced conservatory students with more than 15 years of formal training on their respective instruments. The decision to record only two musicians was made to limit the number of performances presented to the participants.
The musicians performed short pieces taken directly or inspired from a database of musical compositions used by Vieillard et al. (2008). Their aim had been to validate musical excerpts that conveyed four intended musical emotions (happiness, sadness, scare, and peacefulness) that could be distinguished on the dimensions of valence and arousal (Russell, 1980), and were composed to match film music clichés (e.g., happiness denoted by major mode and fast tempo; scare denoted by minor mode with dissonances, etc.). These musical pieces were composed for keyboard instruments, but our study required music suitable for piano and violin. In the case of happiness, sadness, and scare, we selected three pieces whose melodic part could be adapted for violin. The corresponding pieces from the database are G03 (happy, in d-major), T01 (sad, in d-minor), and P02 (scary, in d-minor). Because the pieces in the database labeled as peaceful could not be easily transferred to violin (because of being composed by mostly arpeggiated figures and intricate interplay between the treble and bass parts), we created a piece, entitled Tenderness, by transposing T01 to D-major (see Supplementary Material Figure S1). The label Tenderness was used for consistency with emotion labels used in a wider selection of literature (see Juslin & Laukka, 2003).
The musicians performed each piece with four different types of expression: happy, angry, sad, and (as a control) deadpan, resulting in 16 performances with congruent and incongruent composition and expression pairings. Regarding the use of the term “angry” over “scary”, the term “scary” pertains to the response of a listener rather than being an expression on its own, and our aim was to emphasize the emotions conveyed by musicians (where “angry” would be a more suitable choice in this regard). The musicians were instructed to convey each of the target emotions (happiness, anger, and sadness) as best as they could through their performance, although they were asked to avoid extreme variations in tempo between the different performances. For the deadpan performance, the participants were instructed to play without any expression. The reason for not including a tender expression was that a tender performance was expected to look and sound highly like a sad performance, leading to very limited variability between the conditions. Crucially, the musicians were not given any instruction regarding how they should move while performing, and movement was not discussed during the recording sessions. The posture and movement of the musicians was recorded with a marker-based motion-capture system, the details of which are given in the Results section.
Stimulus Generation
Audio: The pianist played a digital piano and the performances were recorded in MIDI format. For a more realistic piano sound, the MIDI data was imported into GarageBand (Apple, Inc., Cupertino, CA), running on Mac OS X. The “Grand Piano” software instrument with 50% reverb was used to generate high-quality renditions of the performances. The violin was recorded with a microphone and the performances were presented without modification or extra audio editing.
Video: The videos shown to participants were created by rendering the motion-capture data into stick-skeleton animations using MATLAB and the Motion Capture Toolbox (Burger & Toiviainen, 2013). To make the point-light animations clearer to interpret, the number of markers was reduced through a procedure that included both eliminating some of the markers and creating new synthetic markers located at the midpoint between two original markers. This marker reduction process approximates a similar method employed by Burger et al. (2013). The marker configurations viewed for both piano and violin performers can be seen in Supplementary Material Figures S2 & S3.
Participants
A total of 92 Finnish university students aged 18–65 (M = 25.66, SD = 7.95; 63 female) participated in this study. Forty-five of the participants (49%) reported having received at least some musical training on an instrument (ranging from 1 to 50 years; M = 10.58, SD = 8.21). Participants were placed into one of three rating condition groups (see Procedure section below). There were no significant differences between the three groups in terms of age; F(2,89) = 1.09, p = .342, years of musical training; F(2,89) = 0.166, p = .847, or gender; X2(2) = 0.146, p = .929. Due to technical issues, the data of two of the participants was not saved, resulting in a final sample of 90 participants. The participants received a free cinema ticket (value €9.75) as a reward for taking part in the study.
Procedure
Participants were randomly placed into one of three rating groups that differed only in terms of the type of stimuli presented. There were three rating conditions: audiovisual (AV), video-only (V), and audio-only (A). Participants in Group 1 (n = 31) rated the A and V of the piano performances (note that one participant's audio-only ratings were not saved due to a technical issue). Participants in Group 2 (n = 34) rated the A and V versions of the violin performances. Participants in Group 3 (n = 25) rated the AV versions of both the piano and violin performances. In all groups, the different types of stimuli (A, V, AV) were presented in respective blocks, and the stimuli within each block were presented in a different random order to each participant. Furthermore, the order of the blocks was balanced across participants.
The data collection sessions were conducted in a laboratory setting using a computer interface (see Supplementary Material Figures S2 and S3). The Max/MSP (version 5.1.9; Cycling 74, Walnut, CA) graphical programming environment (running on Mac OS X) was used to present the stimuli and collect the data. The point-light animations were presented with a resolution of 800 × 600 pixels and a frame rate of 30 fps. The audio was presented in WAV format through high-quality headphones (AKG K141 Studio). The participants were told they would hear and see short musical performances expressing different emotions, and their task would be to evaluate the degree to which the performances convey certain emotions. In the A and AV rating conditions, the participants were instructed to base their ratings of perceived emotion on what they heard. They were asked to “evaluate how tender, sad, happy, or angry the performances SOUND”. Similarly, in the V rating condition (without any sound), the participants were asked to “IMAGINE how tender, sad, happy, or angry the performances would sound”. The evaluations were made using four horizontal scales labeled tenderness, sadness, happiness, and anger, ranging from Not at all to Very much. The participants could use as many of the scales as they found applicable to any given performance (i.e., there was no forced choice). The outputs of the scales, coded using MIDI note numbers, provided data in the range 0–127.
The data collection sessions started with two practice trials using audiovisual excerpts that were like—but not part of—the actual stimulus set to which participants were instructed to respond. These responses were not included in the data. After completing the task, participants completed a short demographic questionnaire (including questions about their musical training) and were fully debriefed.
Results
Inter-Rater Agreement
The first step in the analysis was to investigate inter-rater agreement among the responses to musical performances. To this end, two analyses were performed on each subset of rated emotions: Interclass Correlation (two-way random, average measures, absolute agreement; abbreviated ICC; see Shrout & Fleiss, 1979) and Krippendorff's alpha (Krippendorff, 2011). Table 1 lists the discrepancies between these methods. For Krippendorff's alpha, the ranges varied from low to moderate, indicating a high variance in the responses. Conversely, ICC values were high, indicating consistency in variation across responses, even though their means may substantially differ. Despite this, both measures show a general pattern indicating that agreement was lower among responders in the video-only rating condition for performances of both instruments. Owing to the role of individual differences in emotional experiences, studies on music and emotion generally yield ratings with low agreement among responders (Vuoskoski et al., 2022; Zentner et al., 2008). Nonetheless, the averages of the ratings can be considered a suitable metric as they cancel out the differences while emphasizing the characteristics that multiple participants agree upon.
Inter-rater agreement for perceived emotion.

Comparing Differences Between Presentation Conditions
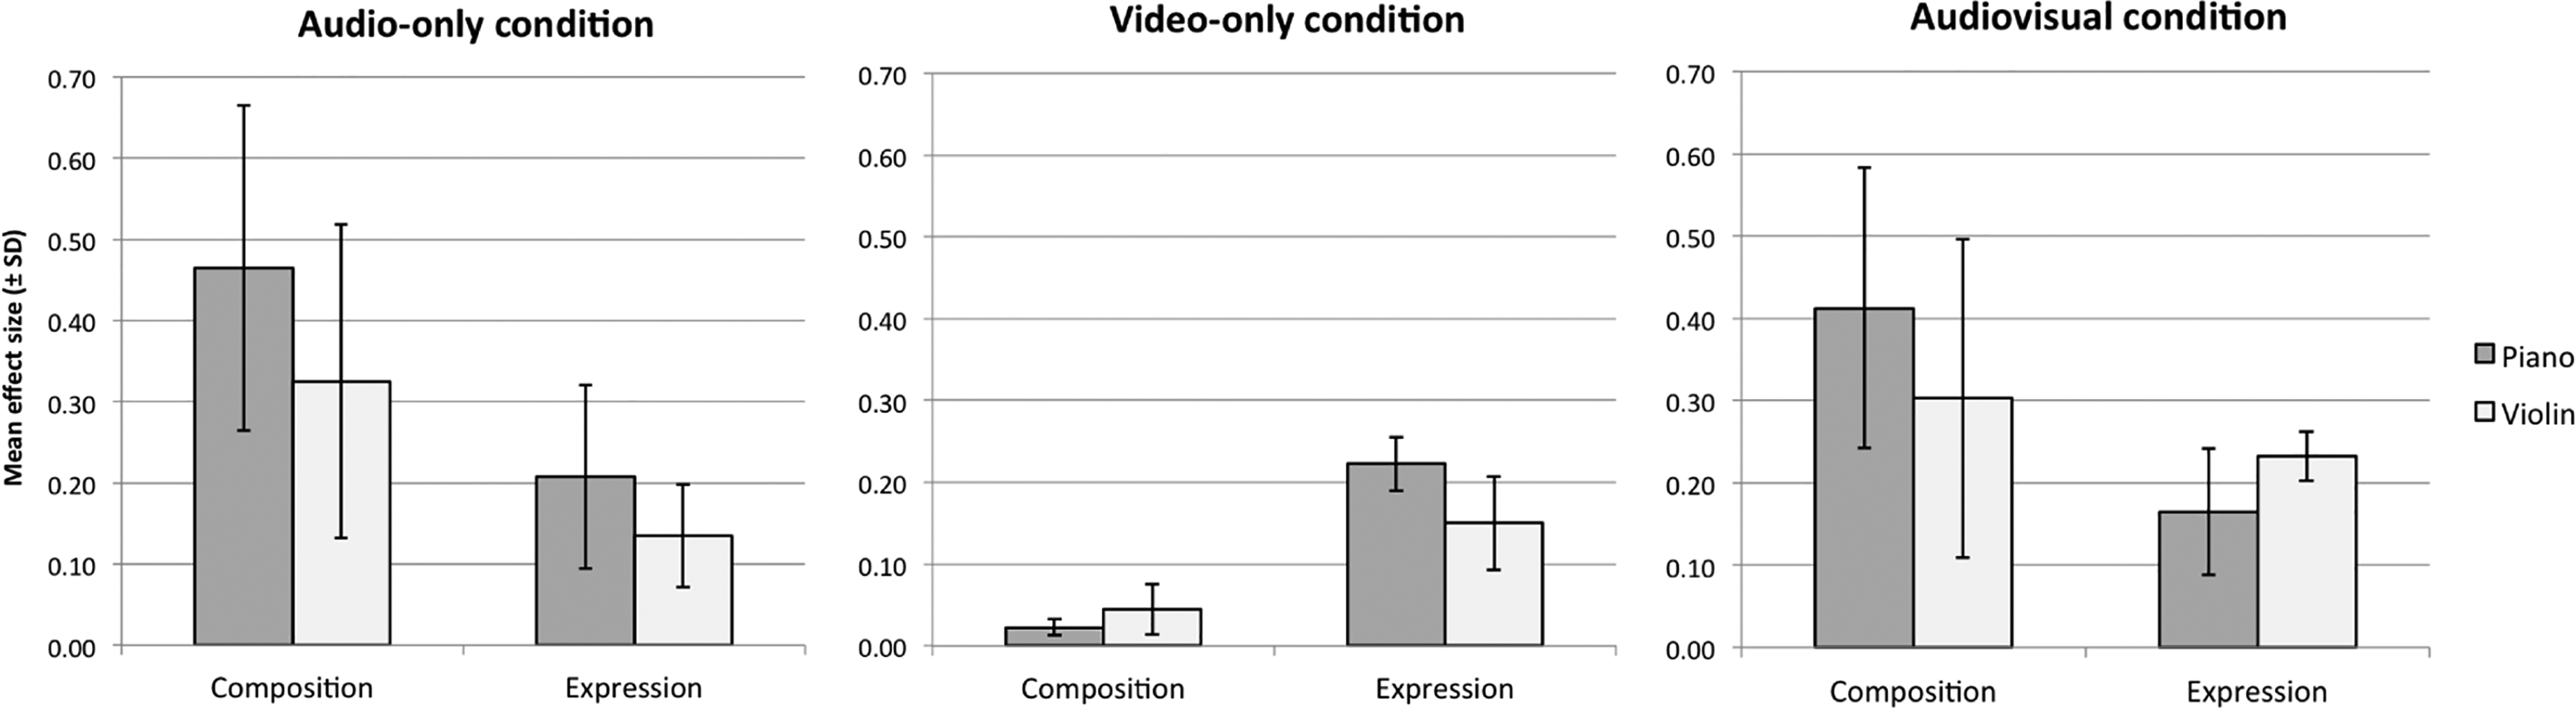
To explore the relative contribution of compositional aspects and performers’ expressive intentions to participants’ ratings of perceived emotion, and how this might vary across the three presentation conditions (A, V, & AV), a series of two-way repeated-measures ANOVAs were carried out. The two within-subjects factors were Type of Expression (deadpan, sad, happy, or angry) and Type of Composition (Tenderness, Sadness, Happiness, and Scare). The main aim of these analyses was to compare the magnitude of effect sizes (generalized eta squared; Bakeman, 2005) across presentation conditions and instruments. In addition, we explored the degree to which participants were able to accurately decode performers’ expressive intentions in the A and V presentation conditions. Analyses were carried out separately for each presentation condition, emotion scale (perceived tenderness, sadness, happiness, and anger) and instrument (piano and violin). The results are summarized in Table 2, and the mean ratings are visualized in Supplementary Material Figures S4–S6.
Summary results of the two-way repeated-measures ANOVAs exploring the relative effects of performers’ expressive intention and composition on participants’ ratings of perceived emotion.

*p < .05, **p < .01, ***p < .001.
For the audio-only condition, the main effect of Type of Composition was larger than the main effect of Type of Expression, suggesting that compositional aspects accounted for more variance in participants’ ratings of perceived emotion. The mean effect size (generalized eta squared; Bakeman, 2005) of Type of Composition was
The mean effect sizes (generalized eta squared; Bakeman, 2005) ± standard deviations of Type of Composition and Type of Expression on ratings of perceived emotion across the three presentation conditions and two instruments.
Post-hoc tests (paired t-tests with Holm–Bonferroni correction for multiple comparisons) revealed that in the piano performances, the target emotional expressions received the highest ratings on the corresponding rating scales but did not always differ significantly from all other expressive intentions: For perceived sadness, the sad expression was rated as the saddest, but was not significantly different from the deadpan expression. With respect to perceived tenderness (which did not correspond to any specific expressive intention), the sad expression was rated as the most tender, followed by deadpan, happy, and angry expressions. For the violin performances, the target emotional expressions also received the highest ratings on the corresponding rating scales, although happiness ratings did not differ significantly between the happy and angry expressions. These findings demonstrate that the participants were quite successful in decoding the expressive emotional intentions of the musicians based on auditory cues alone.
In the Video-only rating condition, Type of Expression played a more central role: The main effect of Type of Expression was substantially larger than the main effect of Type of Composition. The mean effect size of Type of Expression was
Post-hoc tests (paired t-tests with Holm–Bonferroni correction for multiple comparisons) revealed that in the piano performances, the target emotional expression was always rated as significantly higher than any other emotion. Similarly to the audio-only condition, the sad expression was rated as the most tender, followed by deadpan, happy, and angry expressions. For the violin performances, the target emotional expressions received the highest ratings on the corresponding rating scales but did not always differ significantly from all other expressive intentions: For perceived sadness, the sad expression was rated as the saddest, but was not significantly different from the deadpan expression. For perceived happiness, the happy expression was rated as the happiest, but did not differ significantly from the angry expression. These findings show that participants were able to decode the expressive emotional intentions of the musicians based on visual kinematic cues alone, albeit with substantial imprecision.
In the Audiovisual condition, the differences between the mean effect sizes of Type of Expression and Type of Composition were slightly reduced: The mean effect size of Type of Expression was
Relationships Between Rated Emotions and Computed Features
Motion Features
For each rated performance, motion features (mo) were computed from the motion-capture data. To permit comparing piano and violin performances, we computed features related to the kinematic aspects of movement (see Dahl & Friberg, 2007). These measures correspond to the magnitudes of the numerical approximations of the time-derivatives velocity (avbspeed), acceleration (avaccmag), jerk (avjrkmag), and City-Block Total Distance (cbtotdist) as a measure of total amount of movement (Camurri et al., 2004; Thompson & Luck, 2012). These were computed for five marker groups for each musician. The marker groups for the pianist were the upper body (ub), torso (t), head (h), left finger (lf), and right finger (rf). The marker groups for the violinist were full body with violin and bow (f), torso (t), head (h), left finger (lf), and right finger (rf) (see Tables 3 and 4). The marker groups differ between pianist and violinist. For the pianist, the ‘upper body’ comprises markers on the torso, head, elbows, wrist, and middle fingers (no markers placed on the lower body). The violinist performed in a standing position, and markers were placed on the whole body, bow, and violin because they were included in the rated videos. Additionally, the functions of the right- and left-hand fingers differ between instruments. In the case of the pianist, the right hand typically plays the melody, whereas the left-hand plays harmony. In the case of a violin, the right hand moves the bow, whereas the left-hand fingers depress the strings on the fingerboard. Each resulting motion feature is composed of 16 data points, meaning one for each performance.
Summary of motion and audio features calculated from piano and violin performances. Motion features were calculated for each marker group.

Summary of marker groups for violinist and pianist. From each marker group, four movement features were computed (see Table 3).

Audio Features
As with motion features, the criterion for selecting audio features was that they should permit a comparison between instruments. Six audio features (au) were computed from each performance. Two features were derived from the manual annotations of the note onsets: average performance speed (avpspeed) and standard deviation (varpspeed). Next, the mode (mode) of each piece was annotated from the score (positive unit for the major mode and vice versa). The last three features, related to signal energy, were computed using MIRToolbox v. 1.6.3 (Lartillot et al., 2008). These were root-mean-square energy (rms), and sub-band flux of bands 3 (avfluxsb3) and 7 (avfluxsb7) (Alluri & Toiviainen, 2010). These bands account for variabilty of energy in the lower and higher portions of the frequency spectrum, respectively (see Table 3 for an overview). As with motion features, each resulting audio feature is composed of 16 data points.
Correlation Between Features
To assess the distinctiveness of each feature, Figure 2 displays the level of correlation between all motion and audio features. A lower correlation (indicated by white or lightly shaded cells) with other features indicates high distinctiveness. For motion features (mo), total distance (cbtotdist) is notably distinct, for all marker groupings and both instruments. The time-derivative features (avbspeed, avaccmag, and avjrkmag) are highly intercorrelated for all the marker groups of the violinist but not for the marker groups of the pianist. For audio features, mode is the most distinct. However, it must be acknowledged that this feature is identical for both instruments and a dichotomous feature treated as continuous, as opposed to the true continuous nature of the other features. Energy and spectral flux are generally highly intercorrelated, but in the case of the violin, the lower spectral flux sub-band (avfluxsb3) differs from the higher spectral flux sub-band spectral flux (avfluxsb7). This may be due to this instrument only playing melody within a middle to high register, reaching the lower spectral band only occasionally, therefore having greater variability in this band. On the contrary, piano performances involve playing chords with the left hand, and thus the lower spectrum content is more homogeneous.

Pearson's correlation coefficients between features. The upper triangle shows correlation for piano performances and the lower triangle for violin performances. The diagonal shows correlation of features between piano and violin. A dot indicates negative coefficient.
The inclusion of motion and audio features within the same figure highlights potential cross-modal relationships. For the violinist, average performance speed (au avpseed) was moderately to highly positively correlated with time-derivatives (avbspeed, avaccmag, and avjrkmag) and total distance (cbtotdist) of each marker group while variation in speed (varpspeed) was inversely correlated. Similar relationships appear in the piano performances, except that total distance (cbtotdist) was inversely correlated to variation in speed and positively correlated to average speed.
Feature Selection Based on Low Collinearity
Figure 2 provides a snapshot of collinearity within the feature set. To make the multiple regression models as reliable as possible, subsets of motion and audio features with low collinearity were compiled so that their Variance Inflation Factor would not exceed two. These subsets included either motion features, audio features, or a combination of both. Subsets with motion features contained only features for one marker group. Motion measures were found to be highly collinear, but at least one motion feature was retained in each feature subset. It was desirable to have at least one motion feature in the subsets with audio and motion features combined, so that they would ‘compete’ for inclusion in a model, being those most statistically significant (lower p-value) the ones included. Figure 3 shows the features retained, revealing distinct patterns for each instrument. For instance, among the motion features in the case of the piano, both hands (lf and rf) have different characteristics than the torso (t) and head (h), while in the case of the violin the bow hand (rf) is distinct.

Features with low collinearity when among all features (motion and audio), only motion features, and only audio features.
Correlations Between Features and Ratings
Linear correlations were computed between each feature and mean ratings for each emotion. Figures 4 and 5 show these values for piano and violin performances, respectively. The most striking result is that, for both instruments, the time-derivatives of motion have greater correlations with perceived emotions when audio is absent in the stimulus. Also, the time-derivatives, for both instruments, are inversely correlated with the ratings of sadness and tenderness. This effect is greater in the violin ratings, showing clear positive correlation between motion time-derivatives and the ratings of happiness and anger. The correlations between time-derivatives and ratings for violin performances are stronger than for piano performances when the stimuli are audiovisual. However, in the audio-only condition, all features have very low or no correlation with the ratings obtained for the violin performances. Conversely, for piano performances, the relations between emotion ratings and all features are remarkably similar in both conditions where audio is presented. Audio features that are highly correlated with the motion derivatives also have high correlations with emotion ratings. There is of course a clear relation between the physical energy used to produce a sound and the energy of the resultant sound, reflected, for example, in the features performance speed (avpspeed) and RMS energy (rms).

Pearson's correlation between mean ratings of perceived emotions and computed features of piano performances. A dot indicates negative coefficient.

Pearson's correlation between mean ratings of perceived emotions and computed features of violin performances. A dot indicates negative coefficient.
Calculation and Selection of Regression Models
A Simple Ordinary Least Squares (OLS) Linear Regression Model (LRM) was computed for each feature as an independent variable and the mean value of each rating subset as the dependent variable. Additionally, a Multiple OLS-LRM was computed for all the possible permutations of features within each subset of features previously screened. For example, the subset of audio features and torso motion features of piano performances has five low-collinearity features. Models including all permutations of two to five features were computed. All features were standardized so that the coefficients of a model can be used as an indicator of the contribution of their corresponding feature to the model. A regression model is expressed as an equation in the form.
Simple Linear Regression Models
Table 5 shows the selected simple linear regression models for motion audio features. These models indicate the degree of linear relation between features and ratings, measured by R 2 adj . In practice, it is a correlation analysis. However, the use of R 2 adj allows comparison with the models that have more than one feature. The table only displays the models’ beta coefficient (β) sign, as the magnitude is irrelevant for models with a single feature. The sign indicates whether the relation is positive or negative. The inclusion of motion and audio features within the same table allows direct comparison between each rated emotion's selected features. Models displayed in bold characters have the higher fit for each rated emotion. Models with p-value ≥ 0.05 are deemed to be statistically insignificant but still worth of noting value is not much greater than 0.05. Models that have higher R 2 adj than their multiple regression counterparts (see Table 6) are shown with gray background. The same overall observations made for the correlation analysis apply to Table 5. However, these models are intended to observe the strongest relationships between ratings and features.
Simple linear regression results for motion (mo) and audio (au) features.

Note. avbspeed = average speed; avaccmag = average acceleration magnitude; avjrkmag = average jerk magnitude; cbtodist = city-block total distance; avpspeed = average performance speed; varpspeed = performance speed standard deviation; rms = root mean square; mode = mode (major or minor); avfluxsb3 = sub-band flux band 3; avfluxsb7 = sub-band flux band 7; t = torso; f= full body; h = head; lf = left finger; rf = right finger.
Multiple linear regression results for motion and audio features.

In the movement feature models, for happiness and anger, the relation of movement features is positive, meaning that higher movement feature values (or more activity) produce higher ratings for these emotions, except the case for perceived happiness in violin performances. Meanwhile, sadness and tenderness ratings had a negative relation with the movement features. This was the case for all piano-rating conditions (audiovisual, video-only, audio-only) and for most violin-rating conditions (audiovisual, video-only). For piano ratings, the relations were strongest in the video-only condition, and the strongest relation (R2 adj = 0.85) was between tenderness ratings and head acceleration (mo h avaccmag). The audio-only condition resulted in non-significant models for the violin performances. Interestingly, in the case of the piano, the audio-only models are similar to those for the audiovisual condition with R2 adj values varying between 0.3 and 0.36.
Turning to the audio feature models, the relation between mode is negative for sadness and positive for happiness ratings, meaning that minor mode corresponds to perceptions of sadness and major mode corresponds to perceptions of happiness. The ratings of anger have a positive relation with the variation of lower spectral content (avfluxsb3). This can be observed in the ratings obtained in both audiovisual and audio-only conditions, which correspond to different responders. For ratings of violin performances presented in the audiovisual condition, the average performance speed computed from audio annotation (avpspeed) is negatively related to tenderness and sadness, while its standard deviation (varpspeed) is negatively related to happiness. Also in the case of the violin, audio energy (rms) is positively related to anger when presentation is audiovisual, but not when it is audio-only. Audio energy is positively related to anger, as is the case for the piano. Finally, it is worthwhile to remark that for performances of both instruments, audio features dominate when the stimuli include audio.
Multiple Regression Models
None of the multiple regression models computed and selected with the described procedures for subsets of motion-only candidate features yielded higher R2 adj than their simple regression counterparts. All the multiple regression models computed for subsets of audio-only candidate features and having higher R2 adj than their simple regression counterparts appeared in the models selected from the ones computed with the subset of audio and motion candidate features, except one. The model for sadness ratings of audio-only piano performances composed only by audio features is slightly improved by adding total distance of the right finger and replacing variability of the lower part of the spectrum for variability of the higher part of the spectrum.
Hence, Table 6 contains the multiple regression models with highest R2 adj of all the multiple regression candidate features subsets, and with higher R2 adj than their simple regression counterparts. All models in Table 6 for ratings that included audio, have mode included. For positive valence mode is positive and vice versa for negative valence, as in the simple regression models. An exception is the model for anger when only video was presented, which seems to be spurious and suggesting an effect of serendipity, as at least theoretically and intuitively, mode does not contribute to visual perception. For the ratings of sadness in audiovisual condition, the models are the same in terms of features and the sign of their coefficients: lower spectrum and minor mode. A similar effect is observed for anger ratings: high variability of lower spectrum and minor mode. However, the model for piano performances includes variability of performance speed (avpspeed) and the model for violin performances also includes variability of higher spectrum (avfluxsb7). Models for tenderness and happiness ratings had more distinct characteristics for each instrument, variability of performance speed (avpspeed) and lower spectrum (avfluxsb3) had different signs for either instrument.
In the case of the piano, as it can be seen with simple regression, models for happiness and anger ratings in both conditions with audio are similar, meaning the same features with very close coefficient values. For sadness ratings there is an inverse relation with variation of lower spectrum, while for anger the relation is positive. This may be because the pianist played chords with less dynamics in the sadly intended pieces, while for the anger-intended emotion, the pianist may have hit the chords more forcefully.
A few models were improved over the simple regression, by including either or both average bodily speed and total distance. Notably, some models that correspond to ratings for performances presented without video have relevant contributions of motion features. Also, for ratings of piano performances, the marker of the right finger has the greatest contribution for happiness (average speed) and sadness, while the left hand for anger (average speed and total distance). Presumably this is because the right hand plays the melody noticeably fast. Likewise, the left hand plays the chords and, as it has been said, they might have been hit more energetically in the pieces with higher ratings for anger. In the case of the violin, the model for anger ratings was improved with the inclusion of total distance and variability of high spectrum, to the existing mode that alone has very low correlation. Finally, neither simple nor multiple regression yielded a strong model for happiness ratings of violin performances presented as audio-only.
Discussion
Advancing previous work by Vuoskoski et al., (2014) and Vuoskoski et al. (2016), this study investigated cross-modal contributions of sight and sound in the perception of expressed emotion in musical performance. Participants rated piano and violin performances in which the musicians played four short pieces attempting to convey four emotional intentions. We also examined the effect of presentation modality (AV, A or V) on participant ratings of perceived emotion, and the relationships between ratings and motion and audio features derived from performance data (motion-capture and audio recordings). Linear relationships between the features and ratings were measured using Pearson's correlation and ordinary least-squares regression. Below, we outline the study's main results, reflect on its limitations, and suggest avenues for future research.
A general finding was that emotion ratings were more consistent among responders when audio was present (audiovisual and audio-only conditions). This suggests that music provided cues that most responders interpreted in more unified ways as opposed to a wider variety of interpretations within the video-only condition. However, the post-hoc tests of the ANOVA analyses revealed that participants were marginally able to decode performers’ expressive intentions based on both visual and auditory information alone (Akkermans et al., 2019, and Gabrielsson & Juslin, 1996). In rating conditions where audio was present, compositional aspects had a stronger effect on participant ratings than performers’ expressive intentions. The same pattern of results was observed in both the ANOVAs and the analysis of musical and acoustic features, where the musical mode (whether the piece was major or minor) was the dominant variable in predicting the ratings of perceived emotions. Thus, the compositional aspects of the performances were generally stronger than the expressive aspects when it came to evaluating performances for perceived emotion.
Relations Between Audio and Motion Features
A correlation analysis shows relationships between audio and motion features (see Figure 2). For violin performance, the average speed at which pieces were played was positively correlated with the violinist's motion acceleration and jerkiness (i.e., faster performances were played with greater acceleration through all parts of the body). The relationship between speed, acceleration, and jerk appeared in piano performance, but to a lesser extent. Of all the features and for both violin and piano performances, the least correlated feature was mode. This indicates that mode (major or minor), being a compositional aspect, did not affect performance aspects (e.g., performance speed as indicated by speed or dynamics as indicated by RMS).
Relations Between Performance Features and Perceived Emotion Ratings
Correlations between performance features and perceived emotions were different for each instrument but exhibited some commonalities (details in Figures 4 and 5, and Tables 5 and 6). The correlation between ratings for perceived emotions in piano performances and computed features were very similar when audio was presented, the audio features being much stronger than motion features. The correlations between ratings for perceived emotions in violin performances ranged from nil to low when the performance was presented only as audio. For both instruments’ performances, the correlations between perceived emotions and motion features were generally stronger when audio was not present, and mostly higher than audio features.
For both instruments, performances presented as video with audio or only video, the time-derivatives of motion correlated directly with high activity emotions (happiness and anger), and inversely with low activity emotions (tenderness and sadness). This effect was also observed for the piano performances presented without video and was much stronger for violin performances than for piano performances. In general, acceleration and jerk had the highest correlations among motion features with rated emotions. Multiple regression models made of low-collinearity features fit better to perceived emotions for most emotions and presentation conditions (details in Table 6). Crucially, all multiple regression models for ratings where audio was presented had better fit after including mode in the model. Also, when audio was presented, mode was always directly related to positive valence emotions (tenderness and happiness), and inversely related to negative valence emotions (sadness and anger). However, exceptions are the anger and tenderness ratings in the violin's performances, relating to major and minor mode, respectively. This suggests that while there are plenty of commonalities in piano and violin performances, each instrument had qualities that affected perceived emotion differently.
The relationships between performance features and perceived emotion ratings were generally consistent with previous research. For audio features, we found relationships between mode and emotional valence (whether a piece was happy or sad), which aligned with work cited in the introduction (e.g., Dalla Bella et al., 2001; Juslin, 2000; Peretz et al., 1998). Regarding the relationship between amount of movement and happiness ratings being direct, and the relationship between amount of movement and sadness ratings being inverse, we found partial agreement with Dahl and Friberg (2007). Our analysis verified this for all the marker groups on the violinist when the video was presented and weak or inverse when only audio was presented. For piano performance ratings, this relationship only appeared in the movement of the right hand (rf) when audio was present. The relationships between ratings in the audio-only condition of violin performances, and all performance features (motion and audio) ranged from irrelevant to weak. Conversely, this relationship was observed to be substantially stronger for video-only and audiovisual conditions. While unclear why this occurred, it could be due to the melodic nature of the violin performances, which lacks the additional information provided by the harmonic accompaniment by the left hand in piano performances. Also, the most-correlated motion features for ratings of violin performances when video was presented, are performance speed and variability of performance speed (avpspeed and varpspeed, respectively), and energy (rms). These are moderately to strongly correlated with motion time-derivatives, suggesting that responders made their assessment of violin performances with more emphasis on movement, while assessing piano performances with more emphasis on sound, likely due to the presence of chords reinforcing the mode (major or minor). It should be noted that our analysis is meant to model and predict the dataset at hand, and not be read as being generalizable to other similar data. However, the models point towards some tentative conclusions, potentially useful for future research—the main one being that mode had a consistent and robust effect on ratings when audio was present.
Limitations of the Study
This study has some limitations that could be considered when designing follow-up work. First, participants viewed performances by only two musicians. This resulted from our choice to have one musician per instrument to limit the number of stimuli presented to the participants. Related to the choice of musical instrument, the performance features used for correlation and regression analysis were limited to features that would apply equally to pianos and violins. Using piano and violin performances of the same pieces, our results may not generalize to all musical instruments. Rather, the results evince differences in the types of expressive gestures made by different instrumentalists.
Another potential limitation is the inter-rater agreement. To ensure that the perceptual data would be suitable for regression analysis, we tested the agreement among the ratings using Intraclass Correlation (ICC) and Krippendorff's alpha. Although both tests showed a similar pattern between rating conditions (e.g., agreement was generally lower for the video-only condition), the overall results of Krippendorff's alpha were remarkably lower than the ICC. The artifacts resulting in high ICC may be due to tau-inequivalence and non-normality, which are impractical to measure in a small sample size (N = 31 or 34 in this study). Conversely, Krippendorff's alpha is independent of n (it can be two raters or one million). The literature on music and emotion research has primarily focused on ICC measures. While precedence is not the best justification for using ICC, it must be acknowledged that the level of agreement in our participants is typical for music and emotion experiments, and that individual differences are a central part of emotional experiences. Our regression models explained quite a bit of the variance in the mean ratings by the motion and acoustic features. This demonstrates that the mean ratings reflect something salient about participants’ emotion perception. Our goal was not to account for all the variance, but to identify which of the motion and acoustic features played a greater role in the participants’ evaluations. We hope that the discrepancies between Krippendorff's alpha and ICC discussed here will be useful for future research in this area.
A more general limitation of the current study is that its findings are not scalable to music cultures outside the western classical tradition. The current study took for granted that the participants had been raised in circumstances that would have exposed them to western classical tonal music. This assumption was made solely since all participants were of Finnish nationality. Thus, it is inappropriate to claim that the findings of this study are valid for other musical cultures. Interestingly, the strongest signifier of perceived intention was the musical mode, with ratings strongly correlating with the traditional view that music in major keys is positively valenced and music in minor keys is negatively valenced. A recent study by Smit et al. (2022) found that the major/minor valence dichotomy is, by and large, something that is learned through culture as opposed to being universal across musical cultures. Therefore, our results should be kept within the scope of western enculturated music listeners.
Finally, let us consider the various theories mentioned in the introduction. Embodied and enactive approaches explaining the perception and cognition of music propose that gestures performed by musicians play a significant role in communicating musical expressivity. This may stem from linguistic communication, in which gestures convey clear messages and can substitute speech (McNeill, 2007). Generally, there is a sense that when musicians produce performance gestures with their body, observers are able to interpret expressive or emotional intentions. However, music performance gestures (outside of conducting gestures) lack the clear meaning analogous to linguistic gestures. In other words, they remain ambiguous, particularly when presented without the performance's auditory component. This appears to be what our data is pointing at, as compositional factors such as musical mode (major/minor) acted as clear predictors as to whether a piece was rated sad or happy, despite the musicians’ performance intentions. While there is a strong semiotic component to music, it remains more salient in auditory and compositional cues than movement cues. This does not mean that the ecological approach is not applicable to music performance, but our findings indicate that auditory affordances are more useful in communicating discrete musical emotions than movement cues. Regarding cross-modal recognition, although motion and audio features were correlated (e.g., louder music correlated with faster movements), our paradigm could have more strongly emphasized cross-modal recognition in the experimental design. For instance, to properly test Windsor's idea that the audio channel contains affordances that a listener would use to create images of the musician's movements, a future study could ask participants to specifically describe the gestures being performed while listening to music.
Conclusion
This study builds on previous research on how musical performance serves as a means of expressive and emotional communication. We found that performances rated high in happiness and anger were characterized by greater variation in musical dynamics, speed, and activity, whereas performances rated high in sadness and tenderness had more subtle dynamics and movements. Interestingly, when the presentation condition of the performance was audiovisual or audio-only, ratings of perceived emotions were mainly influenced by compositional elements, such as musical mode, rather than by musicians’ emotional intentions. This suggests that compositional structure within the context of western classical music has a stronger impact on an audience's emotional response than the performer's gestures (see Laukka & Gabrielsson, 2000). However, when the presentation condition was video-only, participants were able to decode emotional intentions to a much lesser extent. Additionally, inter-rater agreement was lowest when the presentation condition was video-only, signifying the ambiguity of expressive gestures without the full context of the performance, which is a valuable starting point for future work on this subject. To expand this research, future studies could explore different musical instruments and non-western musical cultures while implementing the methodological suggestions made in this study.
Supplemental Material
sj-docx-1-mns-10.1177_20592043231177871 - Supplemental material for Relationships Between Audio and Movement Features, and Perceived Emotions in Musical Performance
Supplemental material, sj-docx-1-mns-10.1177_20592043231177871 for Relationships Between Audio and Movement Features, and Perceived Emotions in Musical Performance by Marc R. Thompson, Juan Ignacio Mendoza, Geoff Luck and Jonna K. Vuoskoski in Music & Science
Footnotes
Action Editor
Diana Omigie, Department of Psychology, Goldsmiths, University of London.
Peer Review
Two anonymous reviewers.
Declaration of Conflicting Interests
The author(s) declared no potential conflicts of interest with respect to the research, authorship, and/or publication of this article.
Ethical Approval
The experimental procedures followed the University of Jyväskylä’s policy on the ethical conduct of research involving human participants, and informed consent was obtained from all participants.
Funding
The author(s) disclosed receipt of the following financial support for the research, authorship, and/or publication of this article: This work was supported by the Academy of Finland (Centre of Excellence in Music, Mind, Body and Brain) and the Kone Foundation (post-doctoral funding to Jonna Vuoskoski).
Supplemental Material
Supplemental material for this article is available online.
References
Supplementary Material
Please find the following supplemental material available below.
For Open Access articles published under a Creative Commons License, all supplemental material carries the same license as the article it is associated with.
For non-Open Access articles published, all supplemental material carries a non-exclusive license, and permission requests for re-use of supplemental material or any part of supplemental material shall be sent directly to the copyright owner as specified in the copyright notice associated with the article.