
Abstract
Introduction
Tyrosyl-DNA phosphodiesterase 1 (TDP1) can repair oxidative damage-caused 3′-phosphoglycolates and promote cancer progression. However, the clinical significance of TDP1 and its correlation with microRNAs (miRNAs) in gastric cancer (GC) remains unknown.
Methods
The relationship of TDP1 or let-7c-5p with the clinical outcomes of GC was determined by a tissue microarray and TCGA dataset. Cell viability and invasion were assessed by MTT and Transwell assays. Pearson correlation analysis, luciferase gene report, qRT-PCR, and Western blot analyses were used to analyze the interaction between TDP1 and let-7c-5p in GC tissues and cells.
Results
We found that TDP1 expression was elevated in GC tissues and associated with the dysregulation of let-7c-5p. Knockdown of TDP1 inhibited GC cell proliferation and invasion. let-7c-5p could be found to bind with TDP1, reduce its expression levels, and represent a predictive marker in GC.
Conclusion
Our findings demonstrated that dysregulation of let-7c-5p/TDP1 axis could predict a poor prognosis in GC.
Introduction
In spite of the decreasing incidence of gastric cancer (GC) worldwide, the prognosis of the advanced patients is poor duo to its invasive and metastasis.1,2 Numerous data have indicated that, GC tumorigenesis is associated with the genetic and epigenetic alterations in oncogenes or tumor suppressive genes. 3 Therefore, identification of the promising predictors involved in GC tumorigenesis is urgently needed.
Tyrosyl-DNA phosphodiesterase 1 (TDP1) exhibits chain terminating anticancer nucleosides. 4 TDP1 expression is elevated in non-small cell lung cancer (NSCLC), 5 colorectal cancer (CRC), 6 and small cell lung cancer (SCLC), 7 and deletion of TDP1 facilitates irinotecan sensitivity and inhibits cell viability in CRC. 6 Thus, TDP1 can act as a oncogenic and prognostic factor for GC. 8
Our previous study showed that, PPM1F is negatively regulated by miR-590-3p in GC cells. 9 It is reported that, miR-211 promotes platinum chemosensitivity by targeting TDP1 in ovarian cancer. 10 Herein, we also identified that, the upregulation of TDP1 had no association with its genetic alterations, but was attributable to the post-transcriptional regulation of let-7c-5p. Knockdown of TDP1 repressed the viability and invasion of GC cells. let-7c-5p could bind with TDP1, reduce its expression, and act as a prognostic marker of poor overall survival and disease-free survival in GC.
Materials and methods
Clinical samples
A tissue microarray (TMA) containing 30 paired GC tissues was from Xi’an Alena Biotech (ST8018, Xi’an, China). The prognostic data for 385 GC tissue samples as well as the levels of TDP1 and 11 miRNAs (let-7a-5p, let-7b-5p, let-7c-5p, let-7e-5p, let-7f-5p, let-7i-5p, miR-98-5p, and miR-320a-3p) were collected from the public dataset. 10 paired frozen GC tissue samples were stored in our laboratory. The protocols were approved by the Ethics Committee of Shanghai Sixth People’s Hospital (YS-2019-003).
Immunohistochemistry (IHC) analysis
Formalin-fixed GC tissues from the TMA were prepared as paraffin-embedded sections and stained with hematoxylin and eosin. Unstained sections were deparaffinized and incubated overnight at 4°C with primary antibody against TDP1 (ab4166; Abcam, Cambridge, UK), then with biotinylated secondary antibody (1:200) at room temperature for 1 h. The protein levels of TDP1 were determined by the percentage of positive-stained cells counted in five randomly selected high magnification fields: “-”: positive cell ratio <10%, “+”: positive cell ratio ≥ 10%.
siRNA transfection
Plasmids mediated siRNA targeting TDP1 vector (si-TDP1, 5′- CAGTGATGATGAGCTGCAACCAGAA-3′) and let-7c-5p mimics were from GenePharma (Shanghai, China) and the negative control (si-NC, 5′- CAGTAAGGTGATCCGAACCAGTGAA-3′) or miR-NC was used as the control vector. HGC-27 cell line was planted in 6-well plates 24 h prior to si-TDP1 transfection with 60% confluence according to the manufacture instructions.
Cell proliferation assay
Cell proliferation was assessed by using a 3-[4,5-dimethylthiazol- 2-yl]-2,5-diphenyltetrazolium bromide (MTT; Sigma) assay. Briefly, 1 x 10⁴ cells were plated in 96-well plates and grown overnight. Twenty microliters of MTT (5 g/L) was added into each well for 4 h. the formazan crystals were dissolved in 200 μL dimethyl sulfoxide. The absorbance was recorded using a 96-well spectrophotometer at wavelength of 570 nm.
Cell invasion assay
Cell invasion assay was performed by Transwell as previously reported. 9
Quantitative Real-time PCR (qRT-PCR)
TDP1 expression was amplified using specific oligonucleotide primer and GAPDH gene was used as an endogenous control. The PCR primer sequences were as follows: TDP1, 5′-TCTCCTTTATTTGGGACGCTTG-3′ and 5′-GGATACTGTTTTACGA GCCAGTC-3′; GAPDH, 5′-CAACGAATTTGGCTACA GCA-3′ and 5′-AGGGGTCT ACATGGCAACTG-3′. qRT-PCR was performed as previously reported. 9
Western blot analysis
HGC-27 cell lines were harvested and extracted by using lysis buffer. The anti-TDP1 ab4166; Abcam, Cambridge, UK) was diluted at a ratio of 1:1000 according to the instructions and incubated overnight at 4°C. The detailed description of Western blot analysis was executed as previously reported. 9
Identification of TDP1-specific binding with miRNAs
Eight miRNAs (let-7a-5p, let-7b-5p, let-7c-5p, let-7e-5p, let-7f-5p, let-7i-5p, miR-98-5p, and miR-320a-3p) that target 3′UTR of TDP1 were identified by using the StarBase v2.0 (http://starbase.sysu.edu.cn/starbase2/index.php) according to the number of supporting experiments (n > 5) and number of cancer types (n = 2).
Luciferase reporter assay
Luciferase reporter assay was conducted as previously reported. 9
Statistical analysis
The data analyses were executed by using SPSS 20.0 (IBM, SPSS, Chicago, IL, USA) and GraphPad Prism. Student’s t-test or Chi-square test was used to assess the statistical significance for comparisons of two groups. The Pearson’s correlation coefficient analysis was used to analyze the correlations. The association of TDP1 and let-7c-5p with the prognosis of GC was conducted by Kaplan–Meier method. Univariate analysis and multivariate models were performed by using a Cox proportional hazards regression model. p < 0.05 was considered statistically significant.
Results
Upregulation of TDP1 predicted a poor prognosis in GC
TDP1 protein expression was examined in 30 paired GC tissue samples by IHC analysis, indicating that, the expression of TDP1 was increased in GC tissues (p = 0.001; Figure 1(a) and (b)). qRT-PCR analysis also indicated a dramatically upregulated expression in GC tissues (p = 0.0025; Figure 1(c)). TCGA cohort further validated this result in paired (n = 32, p < 0.0001) and unpaired GC tissue samples (n = 385, p < 0.0001; Figure 1(d) and (e)). These studies indicated that, upregulation of TDP1 was a common even in GC patients. The clinical prognosis of TDP1 expression in patients with GC. (a, b) IHC analysis of TDP1 protein levels in GC tissue samples. (c) qRT-PCR analysis of TDP1 expression levels in 10 paired GC tissue samples. (d, e) TCGA validation of the expression levels of TDP1 in unpaired and paired GC tissue samples. (f) Kaplan–Meier analysis of the association of high or low TDP1 expression with overall survival and disease-free survival in patients with GC. Scale bar: 300 μm.
A cutoff value of TDP1 (9.247) divided the patients into high-TDP1 (n = 14) and low-TDP1 groups (n = 334). We found that TDP1 showed no relationship with the clinical factors in patients with GC (Table S1). Kaplan–Meier analysis indicated that, the patients with high-TDP1 level displayed a poorer overall survival (p = 0.0271), but showed no difference in disease-free survival (p = 0.0633, Figure 1(f)). TDP1 expression was not an independent marker for predicting the overall survival in GC (Table S2).
Knockdown of TDP1 inhibited the proliferation and invasion of GC cells
As shown in Figure 2(a), we detected the expression levels of TDP1 in GES-1, SGC-7901, and HGC-27 cell lines, and found that TDP1 harbored a significantly higher expression level in HGC-27 cells as compared with the GES-1 cells. The silencing efficiency of si-TDP1 in HGC-27 cell line was measured by qRT-PCR and Western blot analyses. MTT and Transwell assays demonstrated that knockdown of TDP1 suppressed GC cell viability (Figure 2(b)) and invasion (Figure 2(c)) as compared with the si-NC group. The effects of TDP1 on the proliferation and invasion of GC cells. (a) qRT-PCR and Western blot analysis of the silencing efficiency of si-TDP1 in HGC-27 cell line. (b) MTT and (c) Transwell assessment of the effects of TDP1 silencing on cell viability and invasion. Data are the means ± SEM of three experiments. **p < 0.01, ***p < 0.001.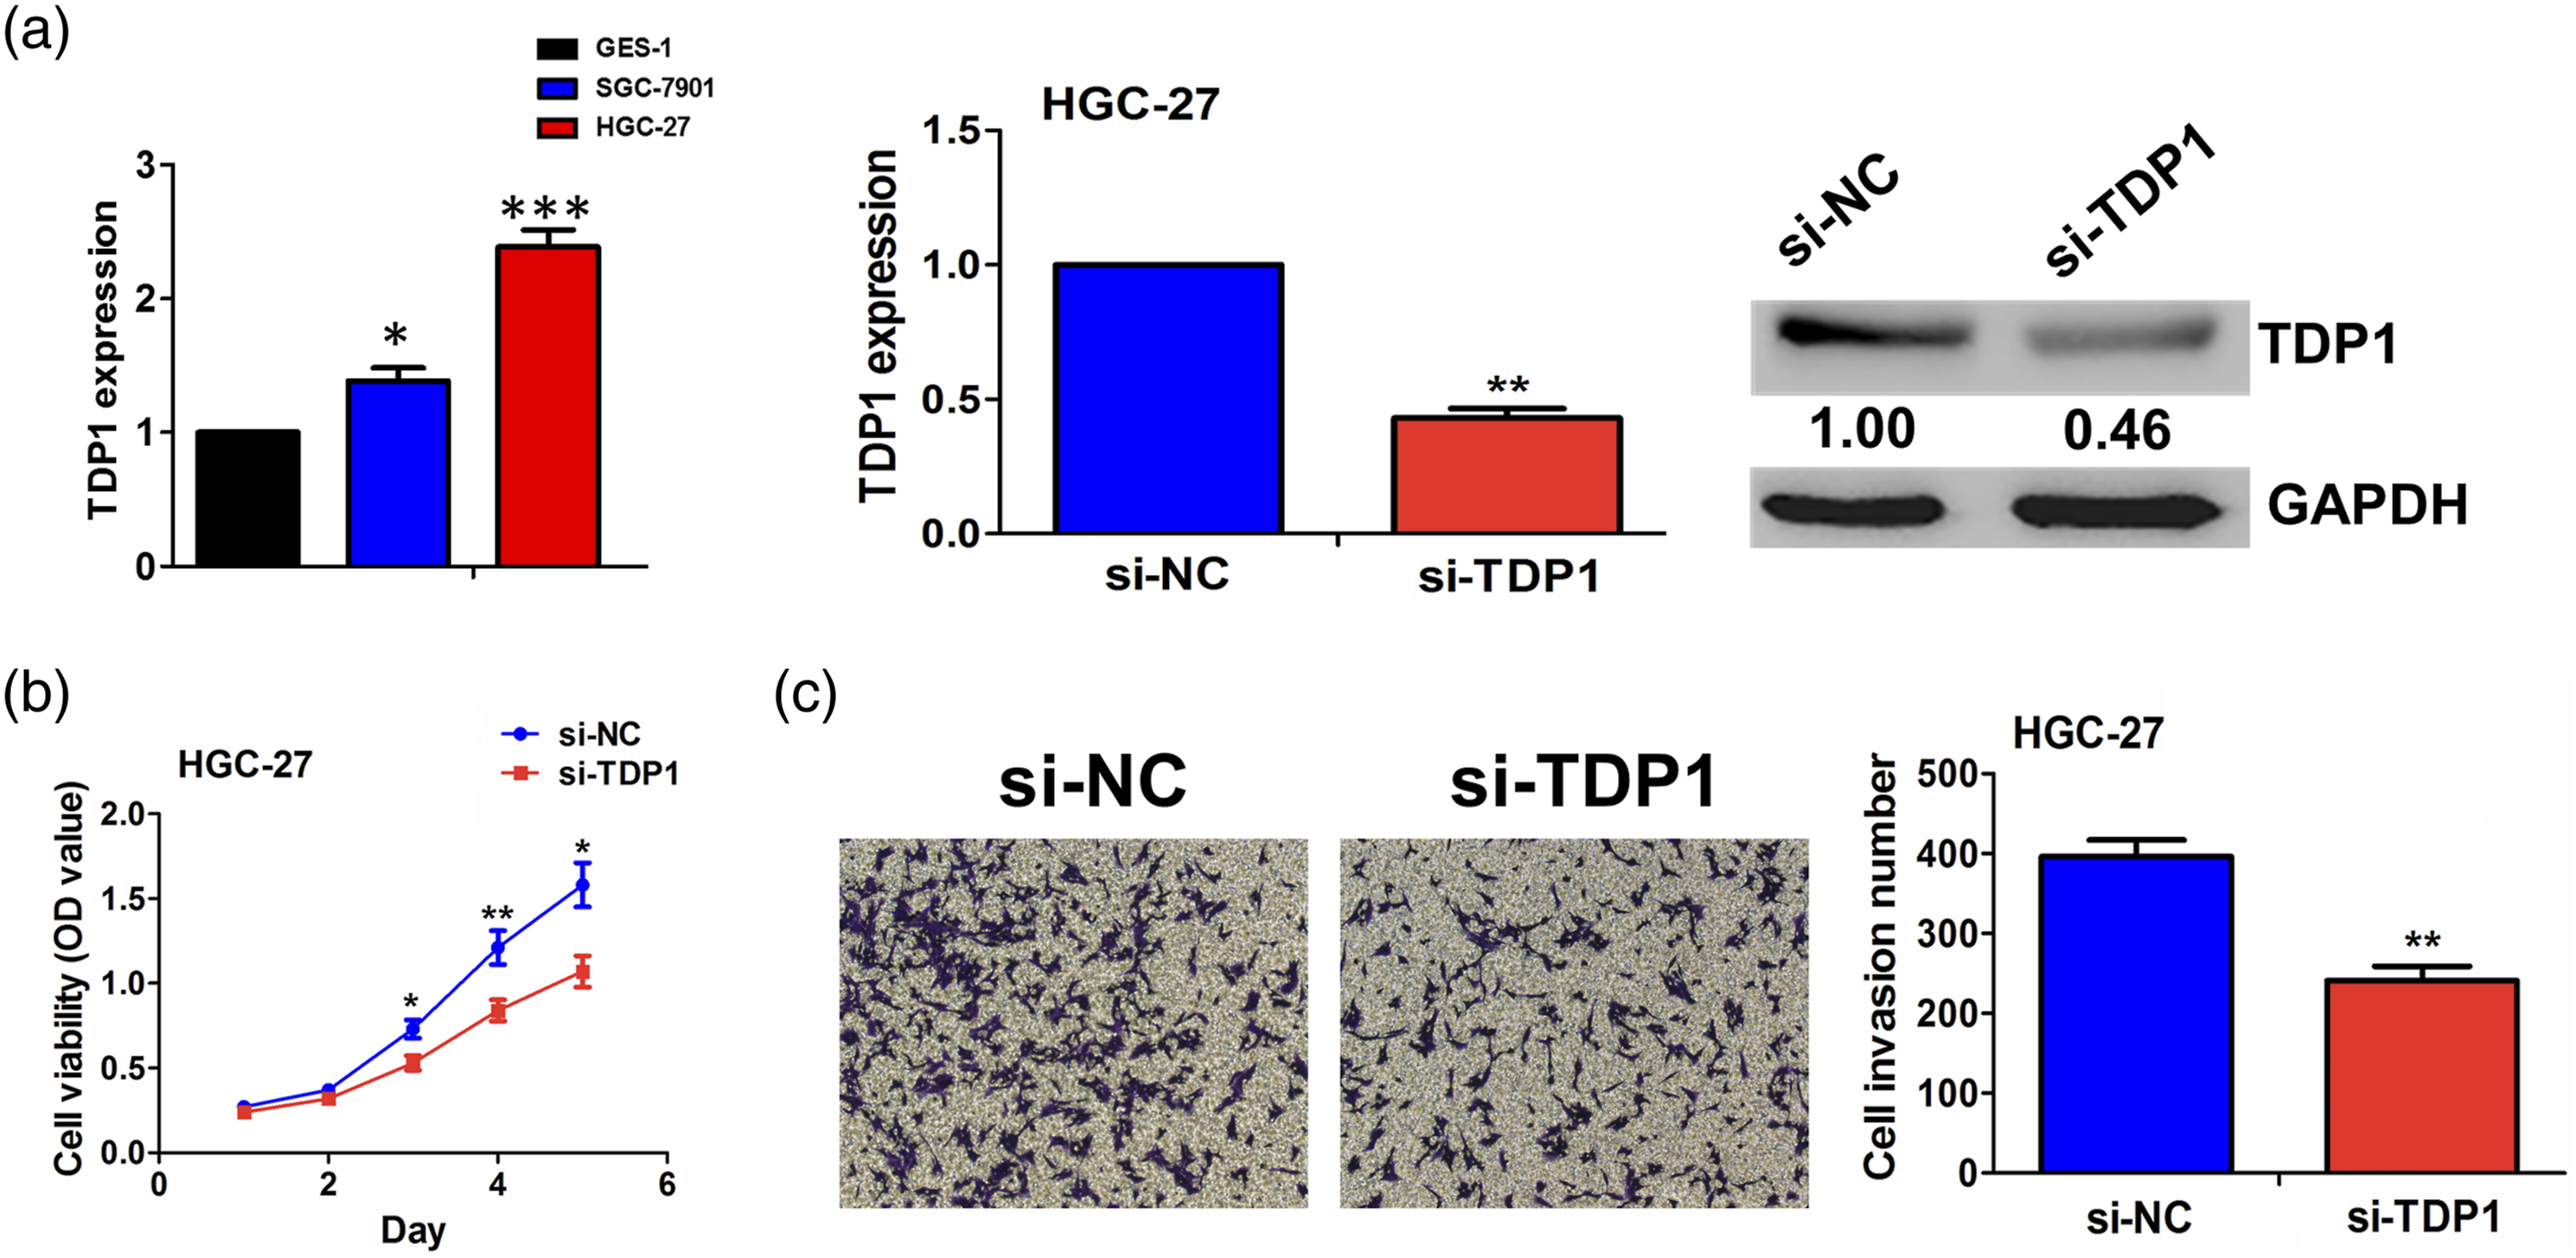
TDP1 harbored a negative correlation with let-7c-5p expression in GC tissue samples
To confirm the reason of TDP1 upregulation in GC samples, we assessed the genetic alterations of TDP1 in GC tissues (n = 370), and found that, TDP1 expression possessed no significant alterations in genetic mutation and amplification in GC patients (Figure S1). Thus, TDP1 upregulation in GC might be regulated by miRNAs. To verify this hypothesis, we identified 8 miRNAs that may bind to TDP1 3′UTR, and estimated their expression in GC tissue samples, of which only let-7c-5p had a reduced expression in paired (n = 41, p < 0.05; Figure 3(a)) and unpaired GC samples (n = 385, p < 0.01; Figure 3(b)). Pearson correlation analysis demonstrated that, TDP1 harbored a negative correlation with let-7c-5p expression in GC tissues (r =˗0.3128, p < 0.0001; Figure 3(c)). To confirm whether let-7c-5p could bind with TDP1, we provided the binding sites between let-7c-5p and WT TDP1 3′UTR, and then co-transfected let-7c-5p mimic and WT (Mut) TDP1 3′UTR into HGC-27 cells and found that, let-7c-5p reduced the luciferase activities of WT TDP1 3′UTR, but had no effects on those of Mut TDP1 3′UTR (Figure 3(d)). qRT-PCR and Western blot analyses further validated that let-7c-5p mimics reduced the expression levels of TDP1 in HGC-27 cells as compared with the miR-NC group (Figure 3(e)). The correlation of TDP1 with let-7c-5p expression in GC tissues. (a, b) TCGA analysis of the expression of 8 miRNAs in unpaired and paired GC tissues. (c) Pearson correlation analysis of the correlation of TDP1 with let-7c-5p expression in GC tissues. (d) Luciferase report analysis of the binding between TDP1 3′UTR and let-7c-5p in HGC-27 cells. (e) qRT-PCR and Western blot analysis of the effects of let-7c-5p mimics on TDP1 expression in HGC-27 cells. Data are the means ± SEM of three experiments. **p < 0.01.
Low expression of let-7c-5p predicted a poor prognosis in GC
We further assessed the association of let-7c-5p expression with clinicopathological features and prognosis in patients with GC. A cutoff value of let-7c-5p (8.728) was obtained in GC tissues (Figure 4(a)) and divided the patients into high-let-7c-5p and low-let-7c-5p expression groups (Figure 4(b)). Moreover, we found that, low expression of let-7c-5p was associated with pathological stage, tumor size and lymph node infiltration in patients with GC (Table 1). Kaplan–Meier analysis indicated that, the patients with low-let-7c-5p expression harbored a poorer overall survival (p = 0.0028, Figure 4(c)) and shorter disease-free survival (p = 0.0134, Figure 4(d)). Low let-7c-5p expression might be an independent marker for predicting the poor overall survival and disease-free survival in GC (Tables 2 and 3). Low expression of let-7c-5p was associated with poor prognosis in GC patients. (a) ROC curve analysis of the cutoff value of let-7c-5p in GC samples. (b) The cutoff value of let-7c-5p divided the patients into high let-7c-5p and low let-7c-5p expression groups. (c, d) Kaplan–Meier analysis of the association of high or low let-7c-5p expression with overall survival and disease-free survival in GC patients. The association of let-7c-5p expression with clinicopathological characteristics in patients with GC. Cox regression analysis of let-7c-5p expression as a predictor for overall survival in GC patients. NA: not analyzed. Cox regression analysis of let-7c-5p expression as a predictor for disease-free survival in GC patients. NA: not analyze.


Discussion
The expression of TDP1 has been confirmed to be increased in multiple malignancies, and exercises tumor-promoting effects in GC.5–7 However, the clinical prognosis of TDP1 expression in patients with GC is poorly understood. Herein, TDP1 was upregulated in GC tissues in our and TCGA cohorts, and associated with poor overall survival and disease-free survival in GC. But, TDP1 expression was found not an independent prognostic factor, and this could be verified in a larger GC samples.
Furthermore, we found that, silencing TDP1 repressed the proliferation and invasion of GC cells. The upregulation of TDP1 in GC tissues was duo to post-transcriptional regulation of miRNAs. let-7c-5p was confirmed to bind to TDP1 3′UTR, indicated a negative correlation with TDP1 expression in GC tissues and reduced its expression in GC cells. Some studies have shown that, let-7c-5p expression is downregulated in breast cancer,11,12 acute erythroleukemia 13 and represses cell proliferation and induces cell apoptosis by targeting ERCC6. 12 Herein, let-7c-5p was validated to be downregulated in GC and represented an independent prognostic factor for poor overall survival and disease-free survival in GC.
However, the power analysis was not performed and the sample size selected in this study could not be calculated. In addition, duo to the lack of the stably-transfected GC cell lines, the function of TDP1 in GC tumorigenesis need be further validated in vivo. In addition, whether the downstream signaling pathway can mediate the let-7c-5p/TDP1 axis to participate in GC tumorigenesis need be further explored in the future.
Conclusion
In conclusion, our studies demonstrated that, upregulation of TDP1 expression in GC might be duo to the decreased expression of let-7c-5p, and low expression of let-7c-5p was an independent prognostic factors of poor overall survival and disease-free survival in GC. let-7c-5p expression might represent a promising biomarker for GC.
Supplemental Material
sj-pdf-1-eji-10.1177_20587392211069258 – Supplemental Material for Dysregulation of let-7c-5p/Tyrosyl-DNA phosphodiesterase 1 axis indicates an unfavorable outcome in gastric cancer
Supplemental Material, sj-pdf-1-eji-10.1177_20587392211069258 for Dysregulation of let-7c-5p/Tyrosyl-DNA phosphodiesterase 1 axis indicates an unfavorable outcome in gastric cancer by Lan Wang, Jing Zou, and Jing Zhang in European Journal of Inflammation
Footnotes
Declaration of conflicting interests
The author(s) declared no potential conflicts of interest with respect to the research, authorship, and/or publication of this article.
Funding
The author(s) disclosed receipt of the following financial support for the research, authorship, and/or publication of this article: Our study was Sponsored by the Interdisciplinary Program of Shanghai Jiao Tong University (YG2021QN104)
Ethics statement
The protocols used in our study were approved by the Ethics Committee of Shanghai Sixth People’s Hospital (YS-2019-003).
Supplemental Material
Supplemental material for this article is available online.
References
Supplementary Material
Please find the following supplemental material available below.
For Open Access articles published under a Creative Commons License, all supplemental material carries the same license as the article it is associated with.
For non-Open Access articles published, all supplemental material carries a non-exclusive license, and permission requests for re-use of supplemental material or any part of supplemental material shall be sent directly to the copyright owner as specified in the copyright notice associated with the article.