
Abstract
We previously showed that the ZKSCAN3 gene codes for a zinc-finger transcription factor that regulates the expression of important genes and plays crucial roles in the development, metastasis, and pathogenesis of rectal cancer, prostate cancer, myeloma, and so on, and in the regulation of autophagy. However, its biological functions under normal physiological conditions remain unclear. In addition, our previous studies showed that the ZKSCAN3 gene may negatively regulate B cell functions. Therefore, we constructed a zkscan3-knockout mouse model and observed that knockout mice contained a greater number of plasma cells than wild-type mice. We also found that the number of plasma cells was significantly increased in either colorectal cancer xenografts or under lipopolysaccharide-induced conditions. RNA-seq and quantitative-polymerase chain reaction assay indicated that the X-inactive-specific transcript is upregulated in B cells of zkscan3-knockout mice, which may represent a potential mechanism how zkscan3 modulates plasma cell differentiation.
Introduction
ZKSCAN3 is a zinc-finger protein containing Krüppel-associated box and SCAN domains, and is a member of the zinc-finger transcription factor family. 1 ZKSCAN3 plays important roles in various types of tumors in humans. It promotes the progression, invasion, migration, and growth of tumor cells by upregulating the expression of genes associated with the cell cycle, cell proliferation, migration, angiogenesis, and proteolysis.2–7 In contrast, silencing of its expression significantly suppresses the tumorigenesis, as well as inhibits the xenograft tumorigenicity, growth, and metastasis of tumor cells. Knocking out key molecules in tumor cells may inhibit the growth of tumors or enhance the efficacy of anti-tumor drugs, and thus has gained attention for the treatment of tumors.8–10. The widespread expression of ZKSCAN3 in tumor cells makes it an important potential target for treating tumors. Knockout (KO) of this gene in tumor cells may have broad and potent effects.
A published study from another research group showed that ZKSCAN3 played a role in downregulating autophagy. 11 In vivo autophagy maintains the antibody response and is an essential intrinsic determinant of the long-lived plasma cell niche in bone marrow. 12 In addition, multiple myeloma deploys abundant autophagy and is essential for malignant plasma cell homeostasis, survival, and drug resistance. 13 Therefore, it is possible that zkscan3 may affect plasma cell differentiation. The development of B cells involves differentiation from hematopoietic stem cells to pro-B cells, pre-B cells, immature B cells, mature B cells, and plasma cells. 14 B lymphocyte-induced maturation protein 1 (Blimp-1), interferon regulatory factor 4 (IRF4), and X-box binding protein 1 (Xbp1) are the main positive transcription factors that regulate the differentiation of plasma cells,15–17 while Pax5, MITF, Bach2, and Bcl6 are the main negative regulators.18–23 However, whether zkscan3 affects the B cell development and plasma cell differentiation has not been reported.
Materials and methods
Generation of zkscan3-KO mice
The enhanced green fluorescent protein (eGFP) expression cassette and terminator were inserted upstream of the start codon of zkscan3. In addition, Neo was inserted to facilitate the screening of cloned embryonic stem (ES) cells. The Frt sites flanking Neo were present to remove Neo after constructing the KO C57BL/6 mice to prevent phenotypic changes in mice resulting from its expression. Both the upstream and downstream LoxP sequences can be used to restore zkscan3 expression when necessary.24–26
As shown in Figure 1(a), the targeting vector was constructed by inserting an eGFP fragment and polyA terminator upstream of the start codon of zkscan3, while Neo flanked by Frt sites was inserted downstream of the polyA sequence. In addition, LoxP sites were inserted upstream and downstream in the same orientation from the entire insertion cassette. The target sequence was inserted into the genomic DNA of ES cells via homologous recombination between the vector and genomic DNA. Next, positive ES cell clones were screened based on the resistance conferred by Neo and were implanted into surrogate mice, resulting in the development of chimeric mice carrying the target sequence.

Phenotype of mice was normal. (a) Schematic diagram of zkscan3-knockout mouse model. (b) Fluorescence images of GFP expression in the spleens of WT and KO mice. (c) Western blot analysis of GFP expression in WT, Het, and KO mice. (d) Mean fluorescence intensities of GFP expression in the spleens of mice. (e) Genotype of WT, Het, and KO mice. (f) Electrophoretic gel image of mouse liver mRNA. (g) Genotype ratio of WT mice to Het and KO mice: 1:2:1. (h) Body weights of the 7- to 8-week-old WT and KO mice. (i) 12.5-day-old embryos of WT and KO mice.
The resulting chimeric mice were crossed with mice carrying the Flp tool to produce F1 mice, that is, the desired KO-first mice, whose Neo gene was removed. These mice were used for normal mating and reproduction as well as gene KO analyses. The expression level of eGFP in KO-first mouse cells represents the transcription level of zkscan3 as eGFP replaced the open reading frame of zkscan3 and was expressed under its promoter. The KO-first mice were crossed with specific Cre transgenic mice to obtain mice expressing zkscan3 normally in corresponding tissues or organs whenever it was necessary to restore zkscan3 expression.24–26
Mice
Zkscan3-KO mice were maintained in a C57BL/6 F1 background, and experimental mice were obtained by breeding the mice using heterozygous crosses. Filial generation mice were subject to genotyping using the following primers—Forward: TCTCCACCTCTCAGTAGTC, first reverse primer (Reverse1): CCTCTTCTTGTTCCACCTT, and second reverse primer (Reverse2): CCTTGATGCCGTTCTTCT. The 230-base pair (bp) wild-type (WT) fragment and the 660-bp KO fragment were obtained by amplification using the primer pair of Forward and Reverse2 and primer pair of Forward and Reverse1, respectively. All animal experiments were approved by the Ethics Committee of Suzhou University. The animal welfare and national regulations for the management and ethics of animal experimentation were considered extensively in the experimental design and implementation of our study.
Antibody reagents
Antibodies with the following specificities were used for flow cytometry and histology: AA4-BV510 (cat: 740152), lgM-BV421 (cat: 562595), CD19-PE-CY7 (cat: 552854), CD43-PE (cat: 553271), HAS-PE-C594 (cat: 562477), CD138-APC (cat: 558626), CD45R-PE-CF594 (cat: 562290), CD23-PE (cat: 553139), CD21/35-APC (cat: 558658), lgD-APC (cat: 560868), GL7-PE (cat: 561530), and CD19-APC (cat: 550992) (all from BD Biosciences, Franklin Lakes, NJ, USA), and GFP (4B10) mouse mAb (cat: 2955) (Cell Signaling Technology, Danvers, MA, USA).
Flow cytometry
Cell suspensions were initially blocked with an anti-Fc-g receptor (CD16/32, cat: 553141; BD Biosciences) in phosphate-buffered saline containing 2% fetal bovine serum before further incubation with a combination of the indicated reagents. Dead cells were excluded based on their 7-amino-actinomycin D (7-AAD) uptake. Flow cytometry was performed on a three-laser eight-color cytometer (Kaluza for Gallios 1.0) and analyzed with Kaluza Analysis 2.0 software. At least 5 × 10⁵ events were collected per sample. Fluorescence Minus One controls were used to guide further analysis of viable cells after doublet discrimination.
Isolation of B cell and quantitative real-time polymerase chain reaction
Cells (CD19+ B220+) were sorted and total RNA was extracted with the MicroElute Total RNA Kit (R6831; Omega Bio-tek, Norcross, GA, USA). cDNA was generated by reverse transcription of 0.2 µg of total RNA using the RevertAid First Strand cDNA Synthesis Kit (k1622; Thermo Fisher Scientific, Waltham, MA, USA) in a total reaction volume of 20 µL according to the manufacturer’s instructions. Quantitative polymerase chain reaction (Q-PCR) was performed using the primers for xist (X-inactive specific transcript) and ctrb1 and SYBR Green® Premix Ex Taq™ PCR Array kit (RR420A TaKaRa, Shiga, Japan) in a High Throughput Quantitative PCR apparatus (LightCycler 480 II, Roche Applied Science, Basel, Switzerland).The following primers were used: xist—sense 5′-CAGAGTAGCGAGGACTTGAAGAG and antisense 5′-GCTGGTTCGTCTATCTTGTGGG, ctrb1—sense 5′-ATGGCATTCCTTTGGCTTGTG and antisense 5′-GGATAGCATCCTCTCCGTTGAC, GAPDH—sense 5′-AGGTCGGTGTGAACGGATTTG and antisense 5′-TGTAGACCATGTAGTTGAGGTCA, zkscan3—sense 5′-TGACAGCTACTAGGCTCACAT and antisense 5′-GCAAGTCCCTAACCTTAGTCTGC, and atp9a—sense 5′-CGGGGGAAATCACGTTCTACA and antisense 5′-GAGCGGTCATGCACACTCA. Q-PCR was conducted according to the instructions of the SYBR PCR Array kit.
Construction of MCA38 colorectal cancer mouse model
We selected a total of eight 7- to 8-week-old KO and WT C57BL/6 mice each for this study. The mice were anesthetized with 12.5 mg/mL of sodium pentobarbital (reconstituted in 0.9% NaCl), and then the site of tumor cell injection was shaved using a razor and wiped with alcohol. After being subcutaneously injected with 200,000 MCA38 cells, mouse vitality was observed, and tumor volume and body weight were measured. The mice were anesthetized and sacrificed by cervical dislocation after their tumors grew to a certain size.
Ex vivo differentiation and immunoglobulin synthesis
B cells were isolated using the EasySep™ Mouse APC Positive Selection Kit (#18452; STEMCELL Technologies, Vancouver, Canada) to sort bone marrow and splenic CD19+ B cells for lipopolysaccharide (LPS) stimulation and plated at 0.5 × 10⁶ cells/mL followed by stimulation with LPS (20 µg/mL). The cells were incubated for 72 h in a humidified incubator at 37°C with 5% CO2 before staining. 27 Immunoglobulin secretion in the supernatants of 5-day cultures was measured by enzyme-linked immunosorbent assay (ELISA).
Luciferase assays
CT26-ZK3 cells were maintained in 1640 containing 10% fetal bovine serum. For transient transfection, cells were plated into six-well plates and transfected using lipofectamine 2000 according to the manufacturer’s instructions (Invitrogen, Carlsbad, CA, USA). The xist reporter vector encoded the firefly luciferase gene under control of the –1500–0 bp promoter. The total amount of DNA per transfection was normalized using an empty vector (PGL4.17). Luciferase activity was determined 48 h after transfection using a Dual-Luciferase assay kit (Promega, Madison, WI, USA) and measured with a Microplate Luminometer (Thermo Fisher Scientific).
Statistical analysis
Statistical analyses were performed using Student’s t-test or one- or two-way analysis of variance with multiple comparisons correction (GraphPad Prism 6.01, GraphPad, Inc., La Jolla, CA, USA). P < 0.05 was considered statistically significant.
Results
Zkscan3–/– mice showed normal development
ZKSCAN3 is highly expressed in various types of tumor tissues in humans,2–7 but its roles under normal physiological conditions are largely unknown. Hence, we constructed a zkscan3-KO mouse model. First, the targeting vector was constructed by inserting an eGFP fragment and polyA terminator upstream of the start codon of the zkscan3 gene, while the Neo gene flanked by Frt sites was inserted downstream of the polyA sequence. In addition, LoxP sites were inserted upstream and downstream in the same orientation from the entire insertion cassette. Because eGFP replaced the open reading frame of zkscan3 and was expressed using its promoter, the expression level of eGFP represents the transcription level of zkscan3 (Figure 1(a–d)). We performed genotypic identification of WT, Het, and KO mice and paired with the primer pair of Forward and Reverse2 and primer pair of Forward and Reverse1 to obtain a 230-bp WT fragment and a 660-bp knock-in fragment (Figure 1(e)). Zkscan3 is no longer expressed on mRNA level (Figure 1(f)). Zkscan3-KO mice showed normal embryonic development (Figure 1(i)), and further investigation of their postnatal conditions revealed that the mice of each genotype complied with Mendelian inheritance law (Figure 1(g)). KO mice showed no differences or abnormalities in body weight (Figure 1(h)) or other features compared to WT mice. These mice also gave birth normally. Therefore, KO of the zkscan3 gene did not affect the normal embryonic development of these mice.
Plasma cells were increased in zkscan3–/– mice
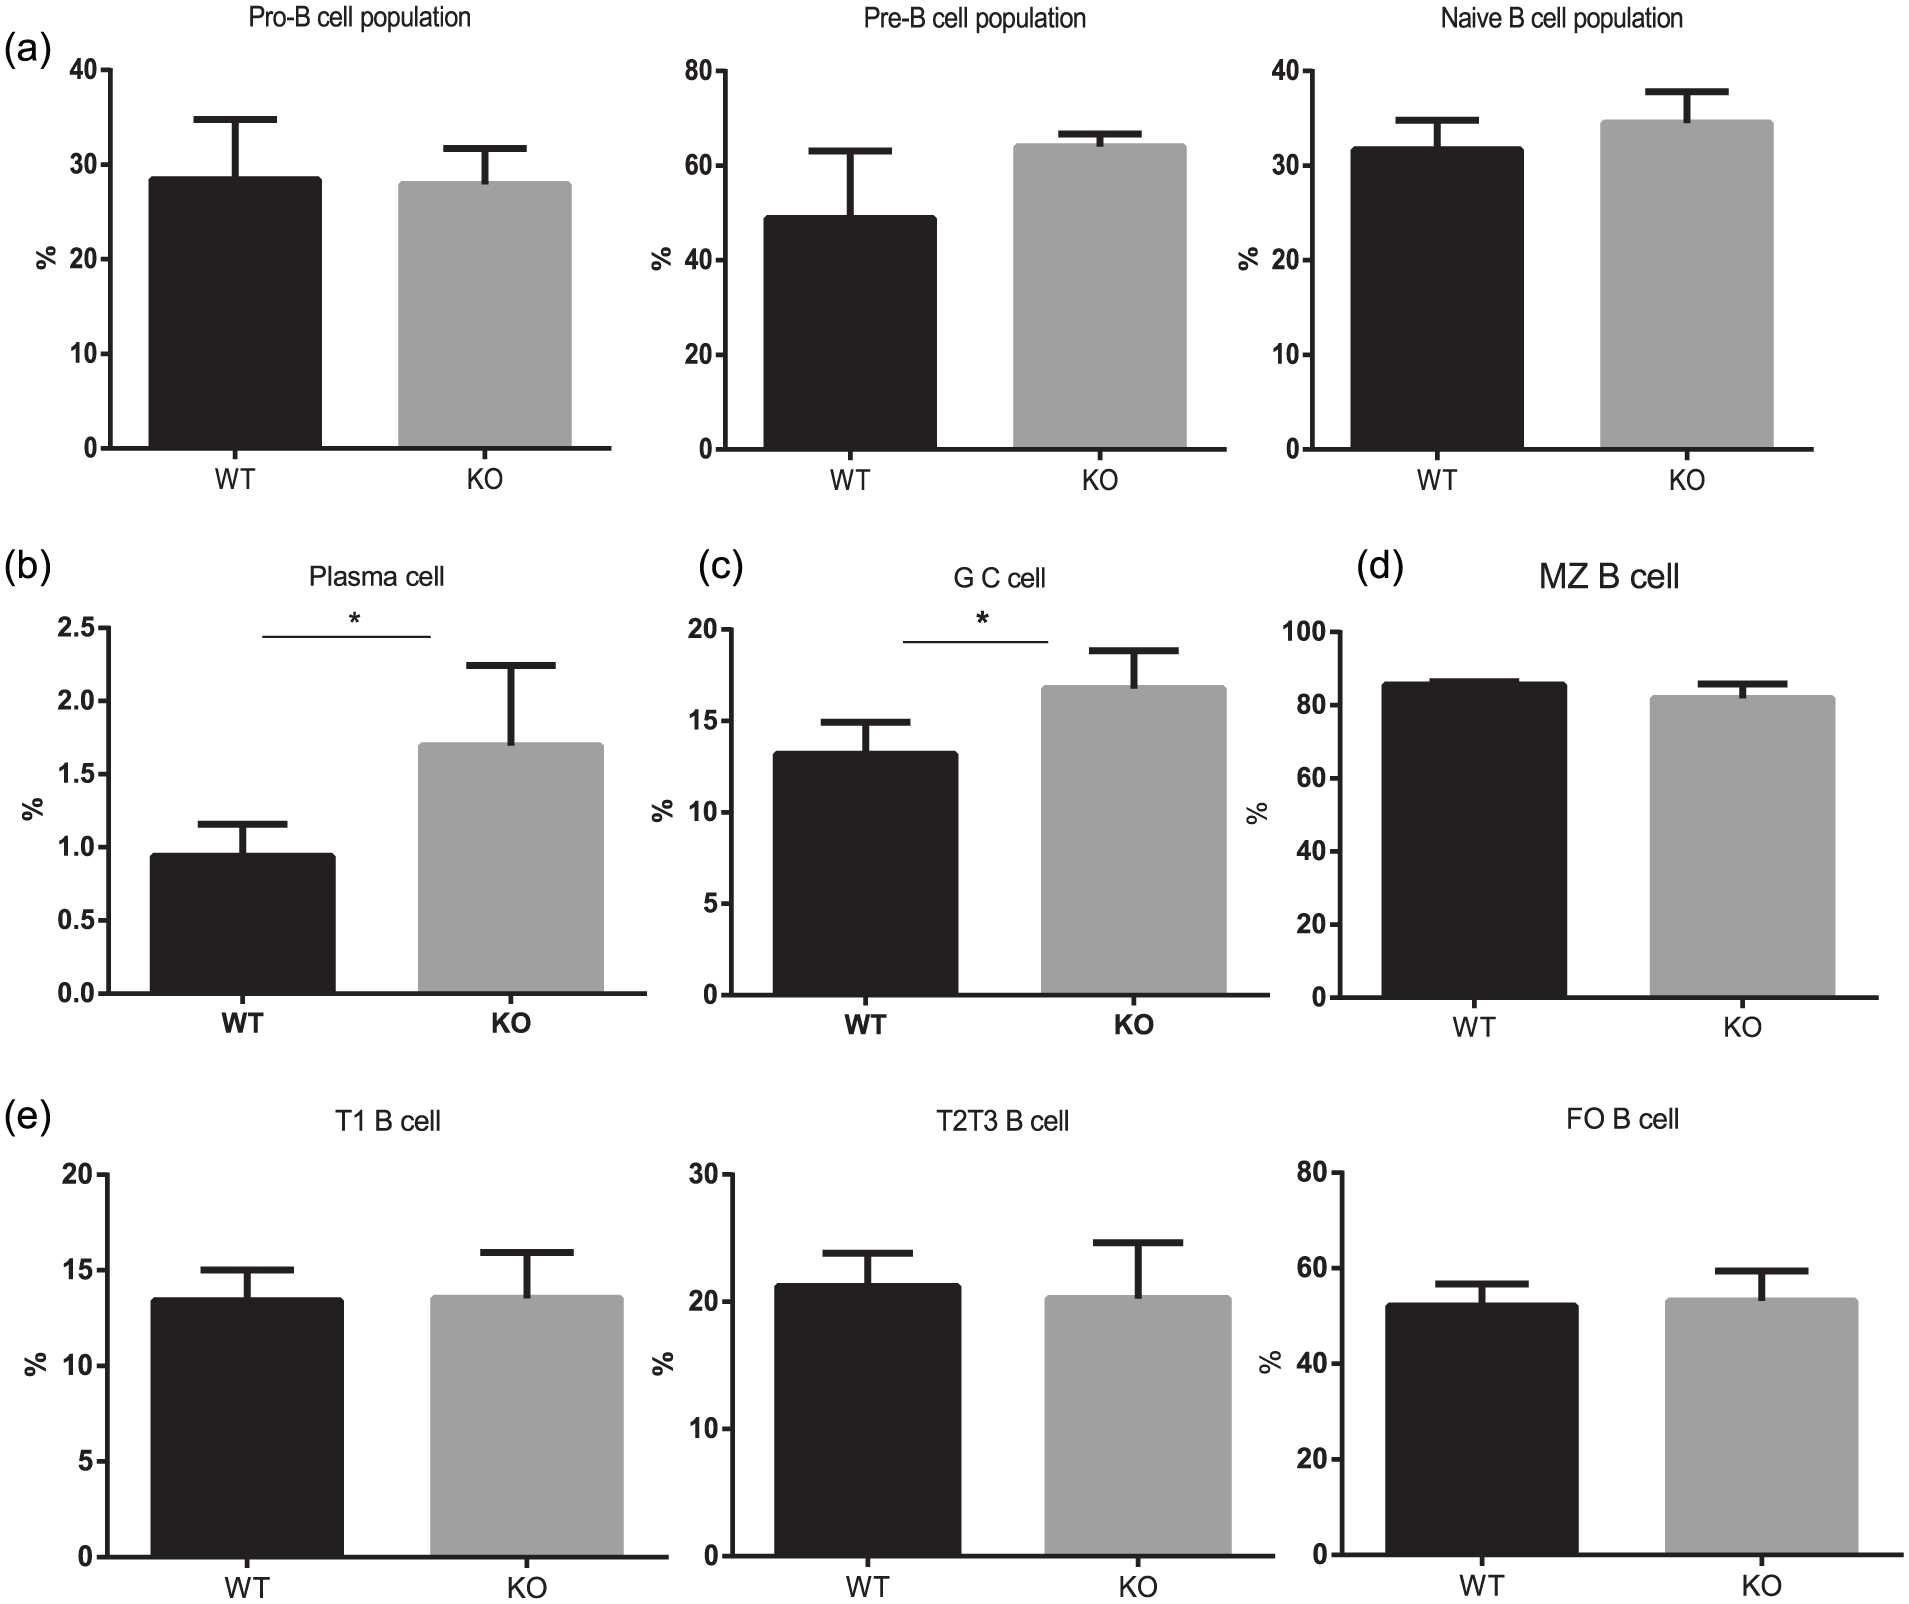
Our previous studies showed that the zkscan3 gene is highly expressed in the human germinal center. We predicted that this gene is involved in B cell development. To examine this hypothesis, we systematically analyzed the development of B cells and the formation of plasma cells in a mouse model. A total of eight 7- to 8-week-old WT and KO C57BL/6 mice each was evaluated. We found that zkscan3 KO and WT mice contained similar quantities of bone marrow CD19+ B cells (Figure 2(a)) and bone marrow AA4+ IgM– CD19+ CD43+ HSA+ pro-B cells, AA4+ IgM– CD19+ CD43– HSA+ pre-B cells, and AA4+ IgM+ CD19+ HSA+ naïve B cells (Figure 2(c)). Similarly, zkscan3 KO and WT mice contained similar numbers of splenic CD19+ B cells (Figure 2(d)) and CD19+/IgM+/IgD–/GL7+ germinal center B cells (Figure 2(e)), CD19+/B220+/IgM++/AA4+/CD23– T1 B cells, CD19+/B220+/IgM++/AA4+/CD23+ T2 B cells, CD19+/B220+/IgM+/AA4+/CD23+ T3 B cells, and CD19+/B220+/IgM+/AA4–/CD23+ follicular B cells (Figure 2(f)), and CD19+/B220+/IgM+/AA4–/CD23–/CD21/35+ marginal zone B cells (Figure 2(g)). Interestingly, the number of CD138+ plasma cells was significantly increased in the bone marrow of zkscan3-KO mice (Figure 2(b)) (*P < 0.05), indicating that KO of the zkscan3 gene promotes plasma cell formation.

Increased plasma cells in zkscan3–/– mice. We selected 7- to 8-week-old WT and zkscan3-KO mice for flow cytometric analysis of the number of B cells and plasma cells in each stage (left). The results were statistically analyzed (right). (a) Flow cytometric plots of CD19+ B cells in the bone marrow of WT and KO mice. (b) AA4+ IgM– CD19+ CD43+ HSA+ pro-B cells, AA4+ IgM– CD19+ CD43– HSA+ pre-B cells, and AA4+ IgM+ CD19+ HSA+ naïve B cells in the bone marrow of WT and KO mice. (c) CD138+ plasma cells in the bone marrow of WT and KO mice. (d) Splenic CD19+ B cells in WT and KO mice. (e) Splenic CD19+/IgM+/IgD–/GL7+ germinal center B cells in WT and KO mice. (f) Splenic CD19+/B220+/IgM+/AA4–/CD23–/CD21/35+ marginal zone B cells in WT and KO mice. (g) Splenic CD19+/B220+/IgM++/AA4+/CD23 T1 B cells, CD19+/B220+/IgM++/AA4+/CD23+ T2 B cells, CD19+/B220+/IgM+/AA4+/CD23+ T3 B cells, and CD19+/B220+/IgM+/AA4–/CD23+ follicular B cells in WT and KO mice (*P < 0.05).
Zkscan3-KO mice with colorectal cancer xenografts (MCA38) have a significantly increased number of plasma cell
We constructed a mouse model of colorectal cancer xenografts (CRC) (MCA38 cells) to create a tumor microenvironment in mice to further investigate the relationship between zkscan3 and plasma cell formation. We found that the number of plasma cells in the bone marrow of zkscan3-KO mice increased dramatically and was significantly different from that in WT mice (Figure 3(b), *P < 0.05), while the number of B cells in the germinal center of zkscan3-KO mice was only slightly increased (Figure 3(c)). There were no significant differences in the number of BM CD19+ B cells, pro-B cells, pre-B cells, naïve B cells, marginal zone B cells, T1 B cells, T2 B cells, and T3 B cells between zkscan3-KO and WT mice (Figure 3(a), (d), and (e)). These results indicate that the number of plasma cells in zkscan3-KO mice increased more markedly after being implanted with MCA38 tumor cells.
Increased plasma cells in mouse colorectal cancer zkscan3–/– mice compared to in WT mice. We constructed a xenograft mouse model of CRC (MCA38). The mice were sacrificed via cervical dislocation for flow cytometric analysis of the number of B cells and plasma cells in each stage. The results were statistically analyzed. (a) Number of pro-B cells, pre-B cells, and naïve B cells in the bone marrow of WT and KO mice. (b) Number of plasma cells in the bone marrow of WT and KO mice. (c) Number of splenic germinal center B cells in WT and KO mice. (d) Number of splenic marginal zone B cells in WT and KO mice. (e) Number of splenic T1 B, T2 B, and T3 B cells in WT and KO mice (*P < 0.05, n = 5).
LPS-induced B cell development increased the number of plasma cells in zkscan3-KO mice
To investigate the effect of zkscan3 KO on plasma cell formation, B cells from bone marrow and spleen were sorted using the EasySep Mouse APC Positive Selection Kit and anti-CD19 antibody-coated magnetic beads, followed by cultivation in RPMI-1640 medium (containing 10% fetal bovine serum and 1% Pen-Strep). After 72 h of LPS stimulation, flow cytometry analysis showed that the number of plasma cells in zkscan3-KO mice was 2.5-fold that of WT mice (Figure 4(a)), while the number of B cells in the germinal center of zkscan3-KO mice was 2-fold that of WT mice (Figure 4(b)). After stimulating for splenic B cell for 5 days, we measured the concentration of immunoglobulin in the supernatant of splenic B cells by ELISA. The results showed that the concentration of lgM, lgG, and lgA in the supernatant of B cells in KO mice was significantly higher than that in WT mice (Figure 4(c)–(e)). Therefore, zkscan3 may negatively regulate plasma cell development.

B cell differentiation in vitro increased plasma cells and germinal center B cells. We selected a total of six 7- to 8-week-old WT and KO mice each to sort B cells in the spleens and bone marrow using magnetic beads. The B cells were then subjected to LPS-induced differentiation in vitro. Flow cytometric plots are displayed on the left, while scatterplots are displayed on the right. (a) Flow cytometric plots of the number of plasma cells in WT and KO mice. (b) Flow cytometric plots of the number of germinal center B cells in WT and KO mice (*P < 0.05; ****P < 0.001). (c–e) Five days after LPS stimulation, lgM、 lgG、 and lgA concentrations in the culture fluid of splenic B cells in the KO mice were increased significantly, campared to WT mice. *P < 0.05; ****P < 0.001.
Zkscan3 negatively regulated the formation of plasma cells by modulating xist expression
B cells in the bone marrow of zkscan3-KO and WT mice were sorted for RNA-seq analysis to investigate the mechanism by which Zkscan3 negatively regulates the differentiation and proliferation of plasma cells. The RNA-seq data showed that the expression of xist in zkscan3-KO mice was upregulated (Figure 5(a)). The results of Q-PCR analysis revealed elevated xist and atp9a and reduced ctrb1 transcription levels in zkscan3-KO mice, which were consistent with the RNA-seq results (Figure 5(b)). We transfected a zkscan3 overexpression vector into CT26 cells to further investigate the relationship between xist and zkscan3 (Figure 5(c)). The sequence recognized by the transcription factor ZKSCAN3 in mice has not been reported. Hence, we cloned the −1500−0 bp upstream sequence of the xist promoter into the PGL4.17 vector. Next, the xist –1500–0 bp + PGL4.17 plasmid, empty PGL4.17 plasmid, and Renilla plasmid were transfected into CT26 cells and CT26-zkscan3 cells. The luciferase reporter gene assay after 48 h showed that the luciferase/Renilla signal was decreased in the CT26-zkscan3 experimental group containing the xist promoter compared to the CT26 group containing the xist promoter (Figure 5(d); *P < 0.05). These results suggest that zkscan3 does regulate the expression of xist.

Xist was upregulated in zkscan3–/– mice. (a) We selected a total of three (two female and one male) 7- to 8-week-old WT and KO mice each to sort splenic CD19+ B cells via flow cytometry for RNA-seq analysis. (b) Q-PCR validation of RNA-seq data. (c) Determination of mRNA expression of zkscan3 in CT26 and CT26-zk3 cells via Q-PCR (n = 3). (d) Luciferase reporter gene assay showed that zkscan3 regulated xist expression (*P < 0.05; **P < 0.01, ****P < 0.0001).
Discussion
The differentiation of B cells into plasma cells involves substantial changes in gene expression, including the inhibition of transcription factors in B cells and other characteristics of B cells, as well as the induction of transcription factors that promote the differentiation of plasma cells. Transcription factors required for the differentiation of plasma cells include Blimp-1, IRF4, and Xbp1.15–17,28 In addition, transcription factors for inhibiting plasma cell differentiation (Pax5, MITF, Bach2, and Bcl6) are also required.18–23 In this study, we demonstrated that ZKSCAN3 may negatively regulate plasma cell differentiation.
ZKSCAN3 is a member of the zinc-finger protein family 1 and is highly expressed in various types of tumor cells, including colon cancer, multiple myeloma, bladder cancer, prostate cancer, breast cancer, and cervical cancer.2,4,5 In multiple myeloma, for instance, the proliferation of myeloma cells can be inhibited by inhibiting ZKSCAN3 expression using small hairpin RNA. 7 We observed an increase in the number of plasma cells in zkscan3-KO mice. The number of plasma cells increased significantly in mice implanted with CRC (MCA38) cells and under in vitro conditions in which LPS stimulated B cell differentiation. An increased number of plasma cells is favorable for the adaptive immune response against tumors. These results suggested that the clinical treatment of patients with hematologic tumors by targeting ZKSCAN3 achieves anti-tumor effects by inhibiting tumor cell proliferation and enhancing the adaptive immune response.
B cells in zkscan3-KO and WT mice were analyzed by RNA-seq and validated by Q-PCR, which revealed upregulation of xist in the B cells of zkscan3-KO mice. The X chromosome has been reported to carry various immune-related genes. 29 In female mammals, X chromosome inactivation leads to the enrichment of XIST by silencing the inactive X chromosome to balance gene expression between the sexes, thereby enhancing immunity and susceptibility to autoimmunity in female mammals.30–32 Upregulation of xist promotes the differentiation into plasma cells that produce large amounts of antibodies.29,33,34 However, Yildirim et al. knocked out xist in mice and found that the female mice suffered from highly aggressive mixed myeloproliferative neoplasm/myelodysplastic syndrome with 100% penetrance, including primary myelofibrosis, leukemia, histiocytic sarcoma, and vasculitis. They suggested that xist is a potent inhibitor of hematologic cancer in mice. 35 The results of our luciferase reporter gene assay showed that zkscan3 regulated the expression of xist. Upregulation of zkscan3 and downregulation of xist in zkscan3-KO mice suggested that zkscan3 negatively regulates xist expression, which will be validated in our future studies.
In conclusion, an increase in the number of plasma cells in zkscan3-KO mice is favorable for the humoral immune response against tumors, while upregulation of xist may effectively inhibit the onset of hematopoietic cancer. In addition, KO of zkscan3 does not affect the normal life activities of mice.
Footnotes
Acknowledgements
We would like to thank Professor Yuhui Huang for providing MCA38 cells and CT26 cells.
Declaration of conflicting interests
The author(s) declared no potential conflicts of interest with respect to the research, authorship, and/or publication of this article.
Funding
The author(s) disclosed receipt of the following financial support for the research, authorship, and/or publication of this article: This work was supported by the Priority Academic Program Development of Jiangsu Higher Education Institutions; National Natural Science Foundation of China (Grant No. 31471283); National Key R&D Program of China (2016YFC1303403); Collaborative Innovation Major Project (Grant No. XYXT2015304); Six Talent Peaks Project in Jiangsu Province (No. SWYY-CXTD-010); the Cyrus Tang Hematology Center, Soochow University, Suzhou, Jiangsu, PR China; Collaborative Innovation Center of Hematology, Soochow University, Suzhou, Jiangsu, PR China; and the Project of State Key Laboratory of Radiation Medicine and Protection, Soochow University, Suzhou, Jiangsu, PR China (No. GZN1201803).