
Abstract
Introduction: Type 2 diabetes mellitus (T2DM) is commonly accompanied by obesity and non-alcoholic fatty liver disease (NAFLD), yet the mechanism underlying diabetes-related NAFLD is not fully understood. It has been reported that melatonin can regulate glucose and lipid metabolism. This study aims to investigate the actions and mechanisms of melatonin toward the development of diabetes-related NAFLD. Methods: Melatonin (bid, 30 mg/kg/day, i.p.) was administrated to db/db mice for 8 weeks, while saline was administrated to db/m mice. The metabolic parameters of mice were measured using an automatic biochemistry analyzer. The oxidative stress indexes and mitochondrial membrane potential (MMP) were determined with kits. Pathological assessment in liver tissues was used to analyze the effects of melatonin on hepatic steatosis. The levels of IL-1β and IL-18 were detected with ELISA kits. The mRNA levels of NLRP3 inflammasome were detected using quantitative real-time PCR assay, and protein expressions were estimated using Western blotting assay. Immunofluorescence staining was used to evaluate the caspase-1 expression in the liver. Results: Melatonin treatment significantly reduced blood glucose, serum insulin, body weight, related liver weight, serum lipids, and hepatic enzymes in db/db mice. Melatonin markedly corrected the NAFLD phenotypes, including lipid accumulation, steatohepatitis, fibrosis, and oxidative stress levels. Melatonin significantly improved the MMP level and decreased the serum IL-1β and IL-18 concentrations. The mRNA levels of the NLRP3 inflammasome could also be remarkably reversed by melatonin in the liver tissues. The activation of the NLRP3 inflammasome was also suppressed, evidenced by the downregulated proteins of NLRP3, caspase-1, IL-1β, and IL-18. The enhanced fluorescence intensity of caspase-1 in the liver tissues was also obviously weakened by the melatonin treatment. Conclusion: Our study concluded that melatonin could safeguard against NAFLD by improving hepatic steatosis in db/db mice, and this action could be associated with the regulation of the NLRP3 inflammasome activation.
Introduction
As a worldwide epidemic, non-alcoholic fatty liver disease (NAFLD), regarded as the liver’s manifestation of metabolic syndrome, is becoming increasingly difficult to ignore. 1 It has been reported that NAFLD is closely associated with insulin resistance, obesity, and dyslipidemia. 2 NAFLD may slow patients’ progress with fibrosis, cirrhosis, and even hepatocellular carcinoma. 2 The global NAFLD prevalence in the general adult population is at least 25–45%, and is as high as 60% in type 2 diabetes mellitus (T2DM) patients.3,4 When considering the high morbidity and health danger of NAFLD, investigation of the therapeutic strategy has drawn great attention.
Recognized as a natural hormone, melatonin is synthesized by the pineal gland. The secretion of this biotic hormone occurs in the evening, and its level reaches the maximum plasma peak in the middle of the night. 5 It is involved in multiple biological activations, such as anti-oxidant functions, anti-inflammatory functions, and the regulation of immunity and circadian rhythms. 6 The liver is the sole organ that acts on behalf of the metabolization of circulating melatonin, and the limited toxicity of this hormone even at high pharmacologic doses has made it an appropriate drug for disease treatment.7,8 The available evidence seems to suggest that melatonin supplement has beneficial effects on the treatment of cancer, atherosclerosis, and Alzheimer’s disease.9-11 In recent years, melatonin has reportedly been involved in the improvement of metabolic disease in preclinical research. Several reports have demonstrated that melatonin contributes to the regulation of glucose metabolism, lipid levels, insulin sensitivity, and the pathologic alteration of NAFLD.12-14 Li et al. 15 showed that melatonin seemingly protects against high-fat-diet (HFD)–induced liver damage and inflammatory infiltration by inhibiting TRAFs-mediated apoptosis signal-regulating kinase 1 (ASK1) deubiquitination in mice. Although some clues have been provided, the efficacy of melatonin on NAFLD under diabetic conditions and its explicit molecular mechanism remain unknown.
The NOD-like receptor family pyrin domain containing 3 (NLRP3) inflammasome has been linked to metabolic disease, including high uric acid and insulin resistance. It also participates in the progression of NAFLD.16,17 NLPR3 inflammasome has three main domains including NLR sensor, caspase-1, and adaptor apoptosis-associated speck-like protein, which contains a caspase-recruitment domain. NLRP3 activation results in the production of IL-1β and IL-18.18,19 Uric acid has reportedly induced the activation of NLRP3 inflammasome in the liver. Knocking down NLRP3 could therefore attenuate fat accumulation in vitro. 16 However, the role of melatonin in NLRP3 inflammasome–mediated liver damage has not been investigated.
In the present study, we investigated whether melatonin protects against hepatic steatosis in diabetic mice, and we analyzed the underlying mechanisms of this process by inhibiting NLRP3 inflammasome activation.
Methods
Animals
Male C57BL/KSJ-Lepdb (db/db) mice and db/m mice and age-matched eight-week-old db/m mice were purchased from the Laboratory Animal Center at Hangzhou Medical College (Hangzhou, China). All mice were housed in a controlled environment with a 12 h light–dark cycle, a constant temperature of 20–25°C, and a relative humidity of 50%. The mice were housed in standard plastic cages in the same animal housing facility. They were supplied with standard chow and had free access to water. Animal experiments were performed in the Laboratory Animal Center at Hangzhou Medical College in accordance with the National Institutes of Health Guide for the Care and Use of Laboratory Animals. The procedures were approved by the Ethics Committee of Laboratory Animal Care and Welfare at Hangzhou Medical College, with the proof number of 20200192.
Animal models
After acclimation for 2 weeks, a total of 12 db/m mice and 12 db/db mice were randomly divided into four groups (n = 6 per group): (1) db/m group (control), (2) db/m + melatonin (MEL) group, (3) db/db group, and (4) db/db + MEL group. The random blood glucose was measured with a blood glucose monitoring system (MAJOR, Taiwan). Mice with the blood glucose greater than 300 mg/dl were defined as diabetic mice and were used for experiments. Melatonin (#M5250, Sigma-Aldrich, Darmstadt, Germany) was dissolved with ethanol as a stock solution, and melatonin solution was diluted with normal saline kept in a dark place. The mice were administrated with melatonin (bid, 30 mg/kg/day, i.p.) or normal saline for 8 weeks. The dose and period were chosen according to reports from beforehand with minor modifications.15,20 After administration for 8 weeks, all animals were anesthetized with phenobarbital sodium (40 mg/kg, i.p.) and euthanized by cervical dislocation in an unconscious state. In each independent experiment, the protocol was performed at least three times.
Body weight and relative liver weight determination
The changes in the mice’s body weight were measured at the end of the melatonin administration. After over-night fasting, the mice were anesthetized with phenobarbital sodium (40 mg/kg, i.p.). The livers were isolated from mice and measured as previously described. 21 The liver weight to body weight ratios were calculated.
Metabolic parameters and measurements of oxidative stress indexes
Blood samples were harvested from the mice’s eyes. The serum insulin levels were detected with an insulin ELISA kit (Shibayagi, Gunma, Japan). The blood biochemical indexes were also measured according to the manufacturer’s instructions. The metabolic parameters in the serum including alanine aminotransferase (ALT), aspartate aminotransferase (AST), triglyceride (TG), and total cholesterol (TC) were analyzed with an automatic biochemistry analyzer (Backman).
The concentrations of superoxide dismutase (SOD) and malondialdehyde (MDA) in the liver tissue were determined using commercial ELISA kits (Beyotime, Shanghai, China), based on the manufacturer’s instructions.
Histological analysis
For the morphology examination, isolated livers were fixed in 4% formalin for 24 h and were embedded in paraffin after dehydration in ethanol as previously described. 21 Samples were cut into a thin section of 5 μm and stained with hematoxylin and eosin (H&E) or Masson’s trichrome. In addition, Oil Red O staining was performed in the frozen liver section to analyze the lipid accumulation. The frozen samples were cut into 5 μm sections, which were stained with Oil Red O. Images of the samples were photographed at 200× using a microscope (Leica Microsystems, Wetzlar, Germany). The pathological evaluations were performed by a pathologist in a single blind way.
Scoring for steatosis, hepatocyte ballooning and lobular inflammation was performed, as described before. 22 The low-to medium-power evaluation of parenchymal involvement by steatosis used a scale of 0–3, where 0 referred to less than 5% of steatosis in the liver, one referred to 5%–33% of steatosis, two referred to 33%–66% of steatosis, and three referred to more than 66% of steatosis. The hepatocyte ballooning analysis used a scale of 0–2, where 0 referred to an absence of ballooning, one referred to a few ballooning cells, and two referred to many ballooning cells. None of the lobular inflammatory cells were referred to as 0, less than two inflammatory cells were referred to as 1, 2–4 inflammatory cells were referred to as 2, and more than four inflammatory cells were referred to as 3. The above three scores were added as the total score for the NAFLD activity score, for which less than two was recognized as not being non-alcoholic steatohepatitis (NASH), 3–4 was recognized as uncertain, and more than five was recognized as probable or definite NASH.
Detection of mitochondrial membrane potential (MMP)
MMP is key toward maintaining mitochondrial function, which was measured with a commercial kit of JC-1 (Beyotime). The procedure was performed according to the manufacturer’s instructions. Mitochondria from liver tissue were separated using a tissue mitochondria extraction kit (Beyotime) and were then incubated with JC-1 solution for 30 min at 37°C. The fluorescence in different groups was measured with a micro-plate reader (Bio-Rad, Hercules, CA, USA). The MMP percentage was finally calculated in order to evaluate the loss of MMP in the liver.
RNA extraction and quantitative real-time PCR measurement
The total RNA of the liver tissues was extracted using RNAiso Plus (Takara, Dalian, China), and cDNA was synthesized using a PrimeScript RT Reagent Kit (Takara). The quantitative real-time PCR analysis was performed using the SYBR Premix-Ex Tag Kit (Takara) and the ABI PRISM 7700 Sequence Detection System (Applied Biosystems, Carlsbad, USA). The primer sequences are listed as follows: NLRP3-forward, 5’-ACTTGCAGAAGCTGGGGTTG-3’, NLRP3-reverse, 5’-AGTTTACAGTCCGGGTGCAG-3’; Caspase-1- forward, 5’-TGCCCAGAGCACAAGACTTC-3’, Caspase-1-reverse, 5’-TCCTTGTTTCTCTCCACGGC-3’; IL-1β-forward, 5’-ACTGACTATACAGCTATAGTG-3’, IL-1β-reverse, 5’-AAGTTAGGTGATTACACAGTT-3’; IL-18-forward, 5’-CTGGTAATCCGCAAAGCGATT-3’, IL-18-reverse, 5’-ACACGCCGACTCAACAGT-3’; and β-actin-forward, 5’-TGACGTGGACATCCGCAAAG-3’, β-actin-reverse, 5’-CTGGAAGGTGGACAGCGAGG-3’. The expression levels were calculated using the Ct method, and were normalized to β-actin.
Detection of inflammatory cytokines
Measurement of the IL-1β and IL-18 levels in both the serum and the liver tissue samples were performed, using an ELISA kit (Anogen, Mississauga, Canada) according to the manufacturer’s protocols. All samples were analyzed in duplicate.
Immunofluorescence staining
For the immunofluorescence analysis, caspase-1 in liver tissues was detected using a primer antibody (Proteintech, Wuhan, China) followed by immunofluorescence staining with a FITC-labeled goat anti-mouse IgG antibody (Jackson ImmunoResearch, West Groove, USA). The nuclei were stained with DAPI (Invitrogen, Eugene, USA), and images were photographed at a magnification of ×200 with a microscope (Leica Microsystems, Wetzlar, Germany).
Western blotting
The total proteins in the liver tissues were extracted using RIPA reagents (Applygen, Beijing, China) supplemented with phosphatase inhibitors and protease (Beyotime, Shanghai, China). Proteins were separated on 10% sodium dodecyl sulfate-polyacrylamide gels and transferred onto a polyvinylidene fluoride membrane. After blocking with 5% skim milk, the membranes were incubated overnight with primary antibodies (1:1000). Antibodies of NLRP3, caspase-1, and GAPDH were purchased from Proteintech Technology (Wuhan, China). The membranes were then incubated for 2 h with the secondary antibody (1:5000; Cell Signaling Technology, Beverly, USA). The bands were exposed using a Millipore ECL Western Blotting Detection System (Millipore, Billerica, USA) and were quantified using the Quantity One System (Bio-Rad, Hercules, USA).
Statistical analysis
All data are expressed as mean ± standard deviation (SD) with six mice in each group to ensure their reliability. Statistical analysis was performed using two-way ANOVA with Bonferroni post hoc correction, employing GraphPad Software (Prism Version 8.01). In each test, the conventional analysis of variance (F test) was used for the ranks instead of the original data. The significance was considered as p < 0.05.
Results
Changes in metabolic parameters in melatonin administrated db/db mice
To investigate the role of melatonin on the metabolic parameters of diabetes mellitus (DM), db/db mice were administrated with melatonin for 8 weeks. As expected, the db/db mice exhibited significant increases in blood glucose, serum insulin, body weight, and related liver weight and upregulated their concentrations of ALT, AST, TC, and TG compared with db/m mice (p < 0.05, Figure 1(a)–(h)). Melatonin administration did not affect these metabolic parameter gains in db/m mice (p > 0.05, Figure 1(a)–(h)). However, blood glucose, serum insulin, body weight, and the related liver weight of the db/db + MEL group were lower than those of the db/db group (blood glucose: 400.5 ± 14.6 mg/dl vs 425.2 ± 23.9 mg/dl, p < 0.05, Figure 1(a); insulin: 12.2 ± 1.1 ng/mL vs 13.4 ± 1.2 ng/mL, p < 0.05, Figure 1(b); body weight: 58.0 ± 0.8 g vs 60.5 ± 1.2 g, p < 0.05, Figure 1(c); liver weight (% of body weight): 4.0 ± 0.05% vs 4.1 ± 0.06%, p < 0.05, Figure 1(d)). In addition, db/db mice had significantly higher ALT, AST, TC and TG levels, which were partly attenuated by melatonin (p < 0.05, Figure 1(e)–(h)). These results show that melatonin can ameliorate the metabolic parameters of db/db mice. Effects of melatonin administration on metabolic parameters in db/db mice. Db/m mice and db/db mice were treated with melatonin (bid, 30 mg/kg/day i.p.) or normal saline for eight consecutive weeks. (a) Blood glucose and (b) serum insulin were measured after melatonin administration. (c) Changes of body weight and (d) relative live weight in mice. Effects of melatonin administration on the serum levels of (e) ALT, (f) AST, (g) total cholesterol, and (h) triglyceride in mice. Values are mean ± SD, (n = 6). *p < 0.05 vs db/m, #p < 0.05 vs db/db. Abbreviations: AST: alanine aminotransferase; ALT: aspartate aminotransferase
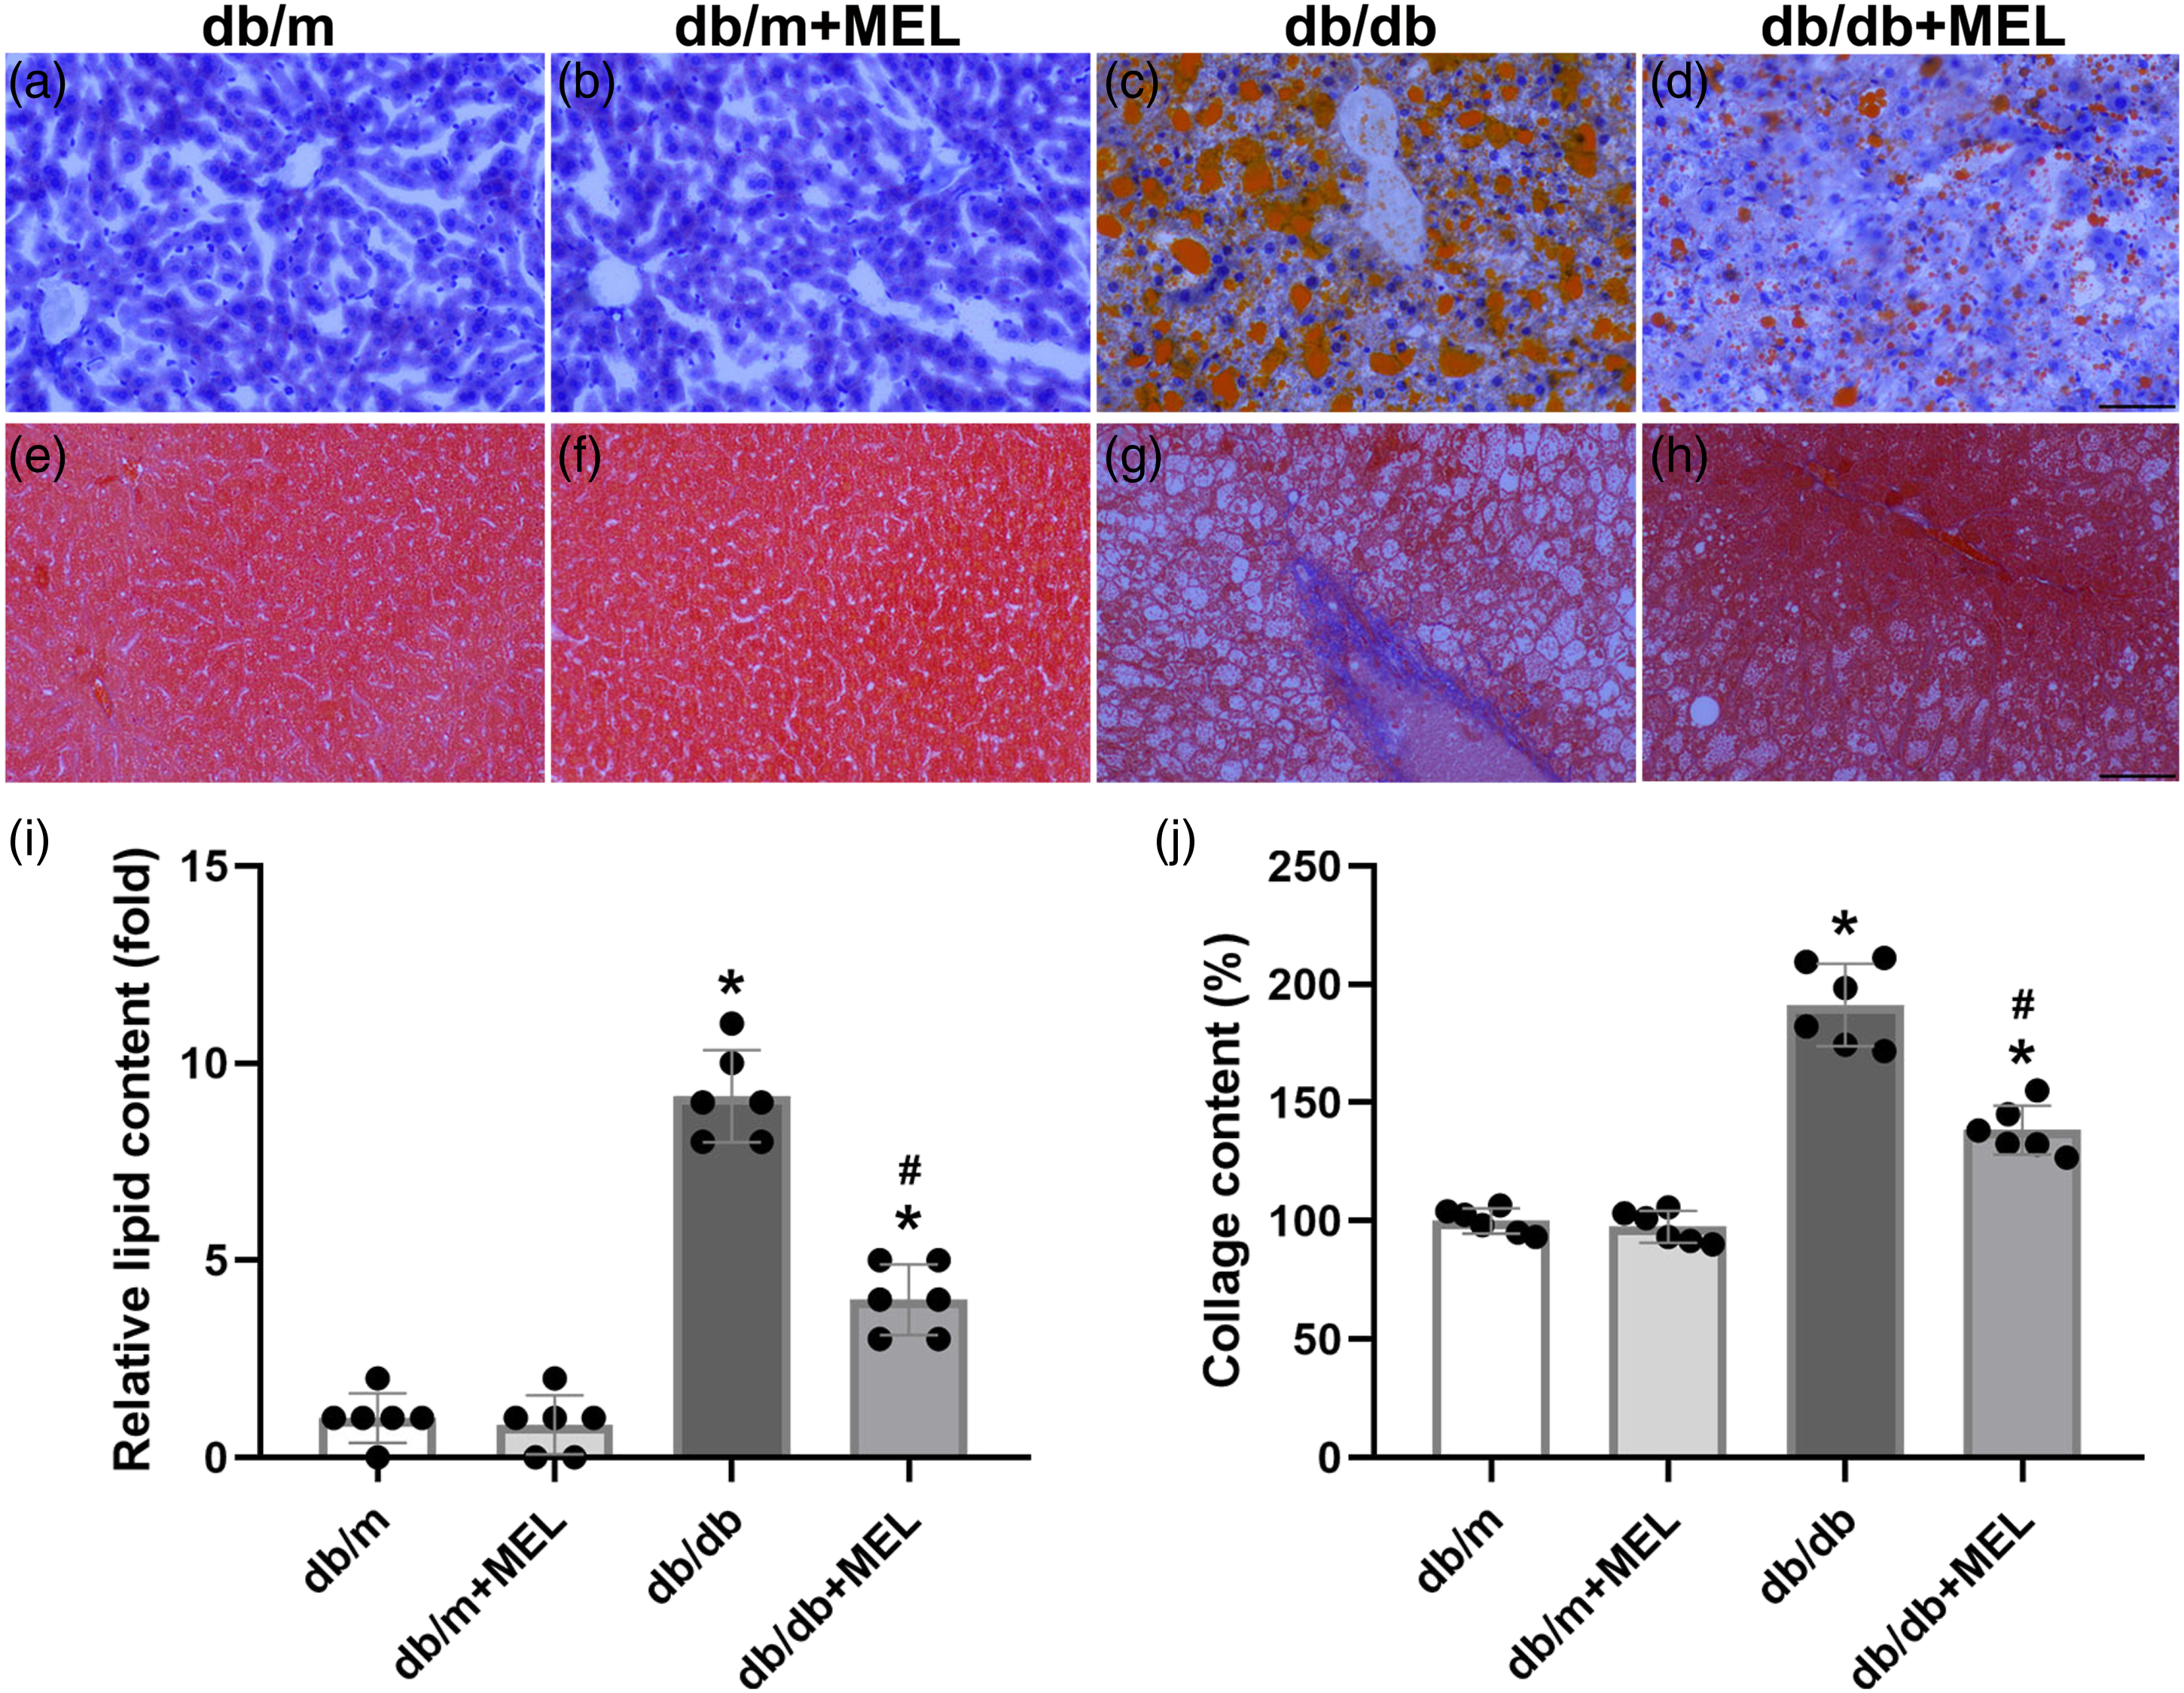
Melatonin attenuates hepatic steatosis and fibrosis in db/db mice
To answer whether melatonin treatment could improve hepatic steatosis in db/db mice, H&E staining of the liver tissue was performed and pathological scores were calculated. The db/db mice clearly exhibited steatosis, ballooning injury, and lobular inflammation. Meanwhile, melatonin treatment successfully attenuated these NAFLD phenotypes (p < 0.05, Figure 2(a)–(g)). In agreement with the above pathological scores, the calculated NAFLD activity score was significantly increased in the db/db mice compared with the db/m mice (p < 0.05, Figure 2(h)). Melatonin treatment greatly reduced the NAFLD activity score (p < 0.05, Figure 2(h)). The Oil Red O staining also indicated severe lipid accumulation in db/db mice, while melatonin significantly improved hepatic steatosis (p < 0.05, Figure 3(a)–(d), (i)). Hepatic fibrosis was notably weakened by melatonin, as demonstrated by Masson’s trichrome staining (p < 0.05, Figure 3(e)–(h), (j)). Taken together, these results suggest that melatonin might improve hepatic steatosis and fibrosis in db/db mice. Effect of melatonin administration on the steatohepatitis and levels of the inflammatory factors in db/db mice. (a–d) Representative images of H&E staining. (×200; scale bar, 100 μm). Histology scores evaluated of (e) steatosis, (f) ballooning, (g) lobular inflammation, and (h) the total non-alcoholic fatty liver disease activity score. Values are mean ± SD, (n = 6). *p < 0.05 vs db/m, #p < 0.05 vs db/db. Effect of melatonin administration on the hepatic steatosis and fibrosis in db/db mice. Representative images of Oil Red O staining (a–d) and (i) quantitative analysis of lipid content. Masson’s staining of livers (e–h) and (j) quantitative analysis of collage content. (×200; scale bar, 100 μm). Values are mean ± SD, (n = 6). *p < 0.05 vs db/m, #p < 0.05 vs db/db.
Melatonin decreases the level of oxidative stress and improves mitochondrial function in db/db mice
We determined the oxidative stress indexes and MMP to analyze the effect of melatonin on oxidative stress and mitochondrial function in db/db mice. As shown in Figure 4(a), the SOD of the liver tissue was at a high level in db/db mice, but MDA was at a low level (p < 0.05). Melatonin administration significantly lowered the SOD level and elevated the MDA concentration (p < 0.05, Figure 4(a)). The MMP was also significantly decreased in the db/db mice compared to the db/m mice, while melatonin obviously upregulated their MMP level (p < 0.05, Figure 4(b)). Melatonin decreases oxidative stress and mRNA levels of the NLRP3 inflammasome in db/db mice. (a) Oxidative stress indexes of SOD and MDA were determined using ELISA kits. (b) MMP level in liver tissue was measured. The mRNA levels of (c) NLRP3, (d) caspase-1, (e) IL-1β, and (f) IL-18 in liver were analyzed by real-time PCR. Serum (g) IL-1β and (h) IL-18 concentrations were determined with ELISA. Values are mean ± SD, (n = 6). *p < 0.05 vs db/m, #p < 0.05 vs db/db. Abbreviation: MMP: mitochondrial membrane potential; SOD: superoxide dismutase.
Melatonin inhibits NLRP3 inflammasome in the liver tissue of db/db mice
To investigate the molecular mechanism by which melatonin regulates hepatic steatosis and fibrosis, the NLRP3 inflammasome at both the mRNA and protein levels was measured. As shown in Figure 4(c)–(f), the mRNA levels of NLRP3, caspase-1, IL-1β, and IL-18 in the livers of db/db mice were markedly upregulated compared to those in db/m mice (p < 0.05, Figures 4(c)–(f)). Although melatonin treatment did not affect the mRNA of NLRP3 inflammasome in db/m mice, it markedly suppressed NLRP3 inflammasome–related mRNA in db/db mice (p < 0.05, Figure 4(c)-(f)). We also found that the db/db mice displayed an increase of IL-1β and IL-18 concentrations in the serum, which were partly suppressed by melatonin (p < 0.05, Figures 4(g) and (h)). Furthermore, the immunofluorescence staining for caspase-1 clearly showed massive caspase-1 expression in the liver tissues of db/db mice, while melatonin administration reduced the expression of caspase-1 (Figure 5(a)–(p)). Consistent with these results, we found that the protein levels of NLRP3, caspase-1, IL-1β, and IL-18 were significantly upregulated in the liver tissues of db/db mice compared with db/m mice (p < 0.05, Figure 5(q)–(u)). Melatonin administration obviously inhibited the expression of NLRP3 inflammasome–related proteins in the db/db mice (p < 0.05, Figure 5(q)–(u)). These results indicate that the activation of NLRP3 inflammasome is upregulated, which may be partly suppressed by melatonin in db/db mice. Melatonin inhibits the activation of the NLRP3 inflammasome in db/db mice. Liver sections were stained with caspase-1 as well as DAPI to monitor caspase-1 expression. (a–p) Representative immunofluorescent staining of caspase-1 in diabetic mice. (×200; scale bar, 100 μm). (q) Protein levels of NLRP3 and caspase-1 were evaluated by western blots and were normalized to GAPDH. The bar graph showed that melatonin administration significantly increased the expression of (r) NLRP3 and (s) caspase-1. Protein levels of (t) IL-1β and (u) IL-18 were analyzed by ELISA. Values are mean ± SD, (A–S: n = 3; T, U: n = 6). *p < 0.05 vs db/m, #p < 0.05 vs db/db.
Discussion
In the current study, we investigated the efficacy of melatonin in the suppression of NAFLD and its underlying mechanisms in the context of diabetes. We found that melatonin treatment corrected deficiencies in db/db mice, such as an increase in the levels of blood glucose, serum insulin, hepatic enzymes, and blood lipids. In addition, melatonin obviously ameliorated hepatic histology, reflected by hepatic steatosis and fibrosis. Notably, melatonin regulated NLRP3 inflammasome activation both at the mRNA and protein levels in db/db mice.
NAFLD is becoming a severe public health challenge that is associated with variety of disorders, such as T2DM and obesity. NAFLD has risen in prevalence, especially in the population with type 2 diabetes. 4 Currently, the first-line recommended interventions for NAFLD are mainly aimed at physical exercise and lifestyle modification. However, there is still no therapy targeting the underlying liver pathology. Pharmacological candidates are therefore urgently needed for NAFLD treatment.
The db/db mice exhibit a mutation on the leptin gene, leading to a diabetic phenotype with hyperglycemia, obesity, and dyslipidemia. 23 In this study, we investigated the anti-NAFLD effects of melatonin in db/db mice, which are a well-recognized diabetes-related NAFLD animal model.24,25 There were significant gains in blood glucose, serum insulin, body weight, hepatic enzymes, and blood lipids in this model. Visible lipid accumulation, mildly inflammatory infiltration, and the appearance of fibrosis were observed in the livers of eighteen-week-old db/db mice, suggesting that a NAFLD-like animal model was successfully built.
A large body of studies have demonstrated that melatonin (N-acetyl-5-methoxytryptamine) contributes to the treatment of metabolic syndromes such as NAFLD and T2DM, as well as dyslipidemia.14,26-28 A clinic research indicated that NAFLD patient treatment with melatonin for 14 months could markedly improve dyslipidemia, including TG and low-density lipoprotein cholesterol. 26 Two-week treatment of melatonin also decreased free fatty acids when compared to cigarette smokers who took a placebo. 27 Previous studies have reported that melatonin attenuates fatty accumulation in leptin-deficient mice and in Apo E mice through the SIRT1-dependent pathway.14,28 It is noteworthy that melatonin administration exhibited distinct improvements on histology in diet-induced NAFLD mice or pigs.29,30 There are barely any studies on db/db diabetic mice that verify the therapeutic action of melatonin for NAFLD. In this study, we found that melatonin slightly reduced blood glucose and ameliorated dyslipidemia, hepatic enzymes, and MMP. In addition, melatonin significantly inhibited lipid deposition and oxidative stress in the livers of db/db mice. These results indicated that melatonin had protective effects during the progression of NAFLD.
In recent years, the pathogenesis of NAFLD has been extensively studied. According to Day and James, 31 who suggested “double hit” theory, inflammation is likely to play a critical role in the induction of inflammatory cell infiltration and in pro-inflammatory cytokine release. Accumulated evidence suggests that the activation of the NLRP3 inflammasome is enhanced in liver tissues compared with controls and that NLRP3 inflammasome activation boosts the development of NAFLD toward fibrosis.32,33 Upon activation, the NLRP3 inflammasome governs the cell secretion of IL-1β and IL-18, which subsequently promotes the development of insulin resistance, dyslipidemia, and lipid deposition. 33 Melatonin has been confirmed to inhibit the activation of the NLRP3 inflammasome in several animal models. It has been demonstrated that melatonin could block the activation of the NLRP3 inflammasome in the prefrontal cortex of morphine-treated mice, while the knockdown or pharmacological inhibition of NLRP3 could abolish inflammasome activation in animals. 34 It also has been reported that melatonin treatment markedly improved cadmium-induced liver injury through TXNIP-mediated NLRP3 inflammasome activation. 35 However, the regulatory role of melatonin in the pathological state of NAFLD remains unknown. In the current study, we found that the mRNA levels of NLRP3, caspase-1, IL-1β, and IL-18 were significantly upregulated in the liver tissues of db/db mice compared with control group. In line with the prior report, the protein levels of the NLRP3 inflammasome were also significantly elevated in the liver tissues. 33 Furthermore, the concentrations of IL-1β and IL-18 were greatly increased in the serum of db/db mice. Melatonin treatment for 8 weeks significantly prevented the above changes. These results suggested that melatonin may protect against diabetes-related NAFLD by suppressing the activation of the NLRP3 inflammasome.
Indeed, the current study had a notable limitation. The sample size of selected in this study was not calculated and justified reasonably. There are six mice in each group, which was used to ensure the data reliability. This limitation may cause bias in this study. Obviously, these results need to be authorized in a large number of mice in the future.
Conclusion
In summary, we investigated the pharmacological effects of melatonin in diabetic mice, showing that melatonin has beneficial effects on interventions for NAFLD and that its pharmacological actions relate to the suppression of NLRP3 inflammasome activation. Supplementary melatonin may be an appropriate strategy to prevent the disease of NAFLD. It is necessary to further assess the efficacy of melatonin in the population that has NAFLD accompanied by DM.
Footnotes
Declaration of conflicting interests
The author(s) declared no potential conflicts of interest with respect to the research, authorship, and/or publication of this article.
Funding
The author(s) disclosed receipt of the following financial support for the research, authorship, and/or publication of this article: This study was supported by the Natural Science Foundation of China (Grant number 81603097).
Ethical approval and consent to participate
This study was approved by the Ethics Committee of Laboratory Animal Care and Welfare, Hangzhou Medical College.