
Abstract
Background
There have been no previous studies comparing the effectiveness of echo-planar imaging (EPI)-diffusion-weighted imaging (DWI) and turbo spin echo (TSE)-DWI for female pelvic imaging on 1.5T and 3.0T magnetic resonance imaging (MRI) systems.
Purpose
This retrospective study compared EPI-DWI and TSE-DWI of the female pelvis at 1.5T and 3.0T MRI to evaluate image quality, geometric distortion, and apparent diffusion coefficient (ADC) values for optimal clinical diagnosis.
Materials and methods
Thirty-nine patients at 1.5T and 71 patients at 3.0T underwent both TSE- and EPI-DWI with b-values of 0 and 1000 s/mm2. Spatial resolution was matched between systems and sequences. Geometric distortion, contrast ((uterine myometrium signal intensity (SI) − gluteal muscle SI)/(uterine myometrium SI + gluteal muscles SI)), and ADC values of the uterine myometrium and lesions were compared. Qualitative assessment included ghosting artifacts, image contrast, and overall image quality.
Results
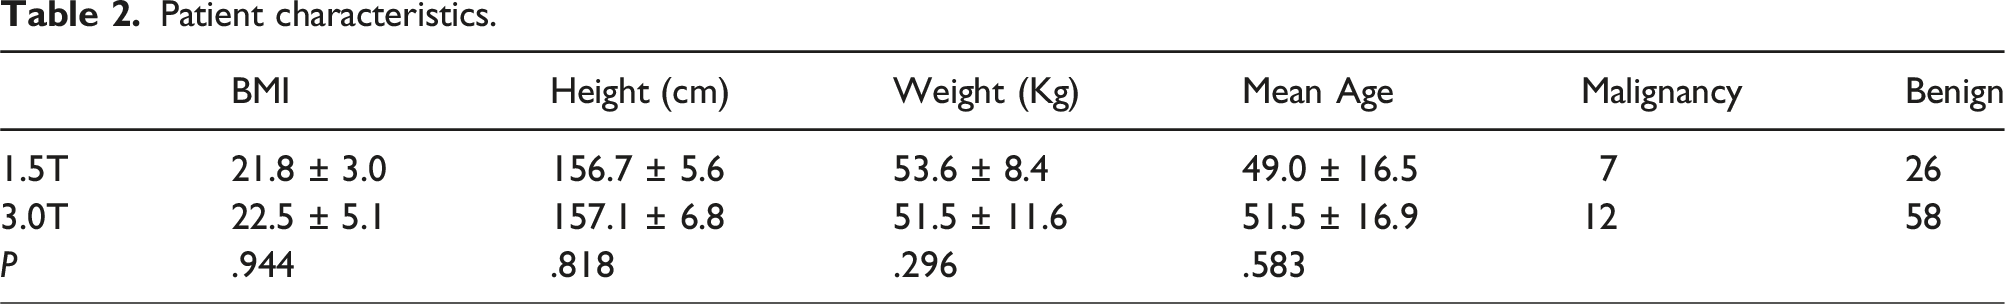
There was no significant difference in patient demographics between 1.5T and 3.0T groups. TSE-DWI demonstrated significantly less distortion than EPI-DWI at both field strengths (p < .05). Contrast was higher with TSE-DWI than EPI-DWI at 3.0T (p < .05) and was greater at 3.0T than 1.5T. ADC values of malignancies differed significantly from the uterus and benign lesions across all sequences and field strengths (p < .05). TSE-DWI showed higher ghosting artifact scores than EPI-DWI at 3.0T (p = .019), but no other significant differences in qualitative evaluation were noted.
Conclusion
TSE-DWI provided superior contrast with reduced distortion compared to EPI-DWI in the female pelvis at both field strengths, with TSE-DWI demonstrating greater effectiveness at 3.0T.
Keywords
Introduction
The quality of female pelvic images acquired by echo-planar imaging (EPI)-diffusion-weighted imaging (DWI) can be unsatisfactory due to intestinal tract air and peristalsis. Because there is no refocusing radiofrequency (RF) pulse with the EPI-based sequence, the spinning protons accumulate phase errors that lead to magnetic susceptibility artifacts. 1 Conversely, turbo spin-echo (TSE)-DWI uses a 180° RF pulse for each measured echo; thus, susceptibility artifacts are smaller and image distortion is lower than observed with EPI-DWI. Previously, a lower signal-to-noise ratio (SNR) and a long acquisition time were considered disadvantages of TSE-DWI previously.2,3 However, recent commercial TSE-DWI sequences have adapted the radiofrequency pulse shape to reduce the echo space, which result in faster scanning, a higher SNR, and reduced blurring. 4
A 3.0T magnetic resonance imaging (MRI) can nearly double the SNR of 1.5T MRI and potentially decreasing scan times without reducing image quality. An increased SNR can be used to improve contrast or spatial resolution, but the increased effects of the magnetic susceptibility differences of tissues scanned at higher fields can result in signal loss in regions of greater signal de-phasing, such as tissue–bone interfaces and tissue–air interfaces. 5
Bowel motion can significantly degrade image quality and affect the accuracy of quantitative measurements such as ADC values. Digestive tract artifacts can mimic malignant lesions, leading to unnecessary biopsies or delayed treatment. 6 To mitigate these effects, various strategies have been proposed, including fasting and the use of bowel preparation agents; however, these methods have limitations. Recent advancements in MRI technology on a 3.0T MRI system, such as TSE-DWI, have shown promise in reducing motion artifacts. 7
The aim of this retrospective study was to compare EPI-DWI and TSE-DWI of the female pelvic region on 1.5T and 3.0T MRI systems by comparing image quality, geometric distortion, and apparent diffusion coefficient (ADC) values to provide the most reliable and informative data for clinical female pelvic imaging diagnosis.
Materials and methods
This retrospective study was approved by our Institutional Review Board, and the requirement for informed consent was waived.
Patients
Between December 2017 and June 2019, 110 consecutive female patients aged 20–86 years (mean age: 49.8 years) with suspected or confirmed malignant pelvic tumors underwent EPI-DWI and TSE-DWI on either a 1.5T or 3.0T MRI system. Thirty-nine patients (malignancies: 7; benign: 26; no findings: 6) were examined on a 1.5T MRI system, and 71 patients (malignancies: 12; benign: 58; no findings: 1) were examined on a 3.0T MRI system. The patients had been randomly assigned to either the 1.5T or 3.0T MRI system previously (retrospective study).
Among the patients examined on the 1.5T MRL system, seven patients had histologically confirmed uterine cancer (two with endometrial cancer and five with cervical cancer). Twenty patients had histologically confirmed benign lesions (12 uterine myoma and 8 benign ovarian lesions), and 6 patients had benign lesions suspected on the basis of their clinical course and repeat imaging (5 uterine myomas and 1 benign ovarian lesion).
Among the patients examined on the 3.0T MRI system, 12 patients had histologically confirmed uterine cancer (6 with endometrial cancer, 5 with cervical cancer, and 1 with carcinosarcoma). Twenty-three patients had histologically confirmed benign lesions (12 uterine myomas, 4 endometrial hyperplasias, and 7 benign ovarian lesions), and 35 patients had benign lesions suspected on the basis of their clinical course and repeat imaging (17 uterine myomas, 7 cervical cysts, 10 benign ovarian lesions, and 1 urethral diverticulum).
MRI protocol
MRI was performed on either a 1.5T or 3.0T scanner (Philips Ingenia 1.5T or Philips Ingenia Elition 3.0T; Philips Medical Systems, Best, The Netherlands) using a 32-element anterior torso phased-array coil coupled with an integrated posterior 20-element array in the tabletop. These coils were positioned so that the patient’s pelvis was located at the center. An intramuscular injection of anti-peristaltic agent (scopolamine butylbromide: 20 mg) was administered to all patients immediately before their entry into the examination room. The MRI protocol consisted of axial and sagittal T1-weighted imaging (T1WI) as well as T2-weighted imaging (T2WI) in three orthogonal planes (transverse, sagittal, and coronal) and axial EPI-DWI and TSE-DWI. Some patients underwent dynamic contrast-enhanced sagittal T1WI, contrast-enhanced axial, and coronal T1WI with fat suppression. On the 1.5T scanner, axial TSE-T2WI was performed with the following parameters: repetition time (TR)/echo time (TE), 4800/100 ms; slice thickness, 5 mm; inter-slice gap, 1 mm; number of slices, 23; field of view (FOV), 22 cm; number of signals acquired (NSA), 2; sensitivity encoding (SENSE) factor, 1; and total scan duration of 2 minutes 41 seconds.
On the 3.0T scanner, axial TSE-T2WI was performed with the following parameters: TR/TE, 3000–8000/100 ms; slice thickness, 5 mm; inter-slice gap, 1 mm; number of slices, 20; FOV, 22 cm; NSA, 1; SENSE factor, 1; and total scan duration of 2 min.
Imaging parameters for DWI sequences.

DWI = diffusion-weighted imaging, EPI = echo-planar imaging, TSE = turbo spin echo, SPAIR = Spectral Attenuated Inversion Recovery.
Diffusion-encoding gradients were applied at b values of 0 and 1000 s/mm2 in the three orthogonal directions of the motion-probing gradients without administration of contrast medium. Maximum intensity projection DWIs were reconstructed in the axial plane with 5-mm reconstruction voxels. The manufacturer’s software was used to automatically generate apparent diffusion coefficient (ADC) maps.
Quantitative evaluation
A radiologist (H.A.) with 16 years of experience who was blinded to the MRI protocols recorded data from the axial-source images. We selected a representative slice that clearly depicted the acetabulum in each patient. Geometric distortion was evaluated by comparing lesion lengths between the axial TSE-T2WI and the corresponding DWI. The anterior–posterior (AP) body-surface length and the left–right (LR) distance between both acetabular floors were measured, and the percent error was calculated as follows:
We also selected a representative slice that clearly depicted the uterus in each patient. The signal intensity (SI) was set for EPI-DWI and TSE-DWI to allow 20 mm2 circular regions of interest (ROI) to be placed on the uterine myometrium (uterus), the gluteal muscles, and lesions.
The CR was determined as the ratio between the SI of the uterus and the SI of the gluteal muscles (CR = (uterus SI − gluteal muscle SI)/(uterus SI + gluteal muscles SI)).
On each ADC parameter map, the ADC values were measured by placing a circular ROI (20 mm2) on the uterine myometrium (uterus) and the lesion. When measuring the SI and ADC, care was taken to only measure the target region without including structural borders or prominent vessels within an anatomic segment.
Qualitative evaluation
Two radiologists (H.A. and T.Y.) performed qualitative assessment of the DWI on an SDS DICOM Viewer (TechMatrix Ltd., Tokyo, Japan). The image data sets were randomized, and the readers were blinded to the acquisition parameters. Adjustment of the window level and width during qualitative assessment was allowed.
Qualitative evaluation was based on a 5-point Likert scale. Ghosting artifacts were rated as follows: 1 = definitely interfering with interpretation, 2 = possibly interfering with interpretation, 3 = present with little effect on interpretation, 4 = faint, or 5 = none. Image contrast was rated as follows: 1 = marked blurring without definable margins, 2 = blurring with definable margins, 3 = minimal blurring, 4 = sharp definition, or 5 = very sharp definition. Overall image quality was rated as follows: 1 = nondiagnostic, 2 = poor, 3 = acceptable, 4 = good, or 5 = excellent. Each reader independently assessed the EPI-DWI and TSE-DWI.
Statistical analysis
The Shapiro–Wilk test was used to determine whether the mean values were normally distributed. Differences in the mean values in the geometric distortion and CR between EPI-DWI and TSE-DWI for each magnetic field strength were analyzed using the Wilcoxon signed rank test for multiplicity of testing. Differences in the mean values of the geometric distortion and CR between 1.5T and 3.0T for each DWI technique were analyzed using the Mann–Whitney U tests for multiplicity of testing. The ADC values of each region on each DWI at each magnetic field strength were compared by using the Kruskal–Wallis test, followed by the Mann–Whitney U tests with Bonferroni’s correction for multiplicity of testing. Differences in the mean ADC values of each region between EPI-DWI and TSE-DWI for each magnetic field strength were analyzed using the Wilcoxon signed rank test for multiplicity of testing. Differences in the mean ADC values of each region between 1.5T and 3.0T for each DWI technique were analyzed using the Mann–Whitney U tests for multiplicity of testing. Interobserver agreement between the two image assessors was estimated by applying kappa statistics, with the following cutoff points for the level of agreement: 0–0.20, poor; 0.21–0.40, fair; 0.41–0.60, moderate; 0.61–0.80, good; and 0.81–1.00, excellent. 8 Qualitative scores were compared by performing the Wilcoxon signed rank test. IBM SPSS version 22.0 for Windows (IBM Corp., Armonk, NY) was used to perform all statistical analyses. Values of p < .05 were considered statistically significant.
Results
Patient characteristics.
Quantitative analysis
The mean percentage error in AP distortion was significantly lower for TSE-DWI than for EPI-DWI on each MRI system (1.5T; 2.4% ± 1.3% vs 0.7% ± 0.6%, 3.0T; 1.8% ± 1.3% vs 0.7% ± 0.6%) (respectively, p = .00). The mean percentage error of LR distortion was significantly lower for TSE-DWI than for EPI-DWI on each system (1.5T: 1.7% ± 1.2% vs 1.1% ± 0.9%; 3.0T: 2.3% ± 1.7% vs 1.1% ± 1.1%) (respectively, p = .00). The mean percentage error in LR distortion of EPI-DWI was significantly lower on the 1.5T system than on the 3.0T system (1.7% ± 1.2% vs 2.3% ± 1.7%, p = .046) (Figures 1 and 2). Box-and-whisker chart showing the geometric anterior-posterior (AP) distortion evaluated by comparing lesion lengths between axial T2WI and the corresponding DWI. The mean percentage error in AP distortion was significantly lower for TSE-DWI than for EPI-DWI on each MRI system (1.5T: 2.4% ± 1.3% vs 0.7% ± 0.6%; 3.0T: 1.8% ± 1.3% vs 0.7% ± 0.6%) (respectively, *p = .00). The boxes show the 25th–75th percentiles, and the horizontal line indicates the median value and show the mean values. Box-and-whisker chart showing the geometric left-right (LR) distortion evaluated by comparing lesion lengths between axial T2WI and the corresponding DWI. The mean percentage error of LR distortion was significantly lower for TSE-DWI than for EPI-DWI on each system (1.5T: 1.7% ± 1.2% vs 1.1% ± 0.9%; 3.0T: 2.3% ± 1.7% vs 1.1% ± 1.1%) (respectively, *p = .00). The mean percentage error in LR distortion of EPI-DWI was significantly lower on the 1.5T system than on the 3.0T system (1.7% ± 1.2% vs 2.3% ± 1.7%, **p = .046). The boxes show the 25th–75th percentiles, and the horizontal line indicates the median value and show the mean values.

The CR of the myometrium to the muscle is shown in Figure 3 and was significantly higher with TSE-DWI than EPI-DWI on the 3.0T system (0.50 ± 0.11 vs 0.47 ± 0.11, p = .008). The CR of TSE-DWI was higher on the 3.0T system than on the 1.5T system (0.50 ± 0.11 vs 0.47 ± 0.11, p = .054). Box-and-whisker chart showing the association of the contrast ratio (CR) between EPI-DWI and TSE-DWI. The CR of the myometrium to the muscle was significantly higher with TSE-DWI than EPI-DWI on the 3.0T system (0.50 ± 0.11 vs 0.47 ± 0.11, *p = .008). The CR of TSE-DWI was higher on the 3.0T system than on the 1.5T system. (0.50 ± 0.11 vs 0.47 ± 0.11, p = .054). The boxes show the 25th–75th percentiles, and the horizontal line indicates the median value and show the mean values.
On the 1.5T system, there was a significant difference in the ADC values for the uterus and benign lesions between the two sequences (p < .05). The ADC values of malignant lesions were significantly different from those for the uterus and benign lesions for both EPI-DWI (uterus: 1.52 ± 0.32 × 10⁻³ mm2/s; benign lesions: 1.46 ± 0.73 × 10⁻³ mm2/s; malignant lesions: 0.71 ± 0.13 × 10⁻³ mm2/s; p = .00) and TSE-DWI (uterus: 1.44 ± 0.27 × 10⁻³ mm2/s; benign lesions: 1.37 ± 0.76 × 10⁻³ mm2/s; malignant lesions: 0.65 ± 0.16 × 10⁻³ mm2/s; p = .00) (Figure 4). Box-and-whisker chart showing the association of the ADC between uterus, the benign lesions, and malignant lesions on EPIDWI and TSE-DWI. On the 1.5T system, there was a significant difference in the ADC values for the uterus and benign lesions between the two sequences (*p < .05). The ADC values of malignant lesions were significantly different from those for the uterus and benign lesions for both EPI-DWI (**p = .00) and TSE-DWI (**p = .00). On the 3.0T system, there was a significant difference in the ADC values for the uterus and benign lesions between the two sequences (*p < .05). The ADC values of the malignant lesions were significantly different from those for the uterus and benign lesions for both EPI-DWI (**p = .00) and TSE-DWI (**p = .00). There was a significant difference in the ADC values for the malignant lesions between the two sequences for the 1.5T and 3.0T systems (*p < .05). The boxes show the 25th–75th percentiles, and the horizontal line indicates the median value and show the mean values.
On the 3.0T system, there was a significant difference in the ADC values for the uterus and benign lesions between the two sequences (p < .05). The ADC values of the malignant lesions were significantly different from those for the uterus and benign lesions for both EPI-DWI (uterus: 1.43 ± 0.25 × 10⁻³ mm2/s; benign lesions: 1.36 ± 0.25 × 10⁻³ mm2/s; malignant lesions: 0.88 ± 0.11 × 10⁻³ mm2/s; p = .00) and TSE-DWI (uterus: 1.39 ± 0.24 × 10⁻³ mm2/s; benign lesions: 1. 26 ± 0.38 × 10⁻³ mm2/s; malignant lesions: 0.89 ± 0.10 × 10⁻³ mm2/s; p = .00) (Figure 4). There was a significant difference in the ADC values for the malignant lesions between the two sequences for the 1.5T and 3.0T systems (p < .05) (Figure 4).
Qualitative analysis
On the 1.5T device, there was no significant difference in image quality between TSE-DWI and EPI-DWI.
Qualitative scores between the two reviewers.


On 1.5T MR system, a 46-year-old female with uterine fibroids. (a) T2WI, (b) EPI-DWI, and (c) TSE-DWI. Intestinal gas on the ventral side of the uterus (arrow) is unclear on (b) EPI-DWI but clear on (c) TSE-DWI.

On 3T MR system, a 30-year-old female with left ovarian cysts. (a) T2WI, (b) EPI-DWI, and (c) TSE-DWI. The boundary between the rectum and the left ovarian tumor (arrow) is unclear on (b) EPI-DWI but clear on (c) TSE-DWI.
The median kappa statistics between the two reviewers were moderate: 0.599 for 1.5T and 0.531 for 3.0T.
Discussion
In our study, distortion was lower for TSE-DWI than for EPI-DWI in the AP and LR direction on each MRI system (1.5T and 3.0T). The CR was higher for TSE-DWI than for EPI-DWI on the 3.0T MRI system and was more effective at higher magnetic fields such as on the 3.0T MRI system, than on the 1.5T MRI system. The ADC values were significantly lower for malignancies than for the uterus and benign lesions on each sequence. In the qualitative analysis, the scores for image quality on the 1.5T MR system were not significantly different between the two DWI sequences. However, the image quality score was higher for TSE-DWI than for EPI-TSE on the 3.0T MRI system. Especially, the scores for ghosting artifacts were significantly higher for TSE-DWI than for EPI-DWI on the 3.0T MRI system, but there were no significant differences between the two DWI sequences on the 3.0T MRI system.
On each MRI system, distortion was lower on TSE-DWI than with EPI-DWI in the AP and LR directions. EPI-DWI lacks refocusing radiofrequency pulse, which causes the spinning protons to accumulate phase errors, leading to substantial magnetic susceptibility artifacts in images. These artifacts often result in image distortion, signal dropouts, and signal heterogeneity that can lead to difficulty in reading DWI. In contrast, TSE-DWI uses a 180° RF pulse for each measured echo, reducing susceptibility artifacts and leading to less image distortion compared to EPI-DWI. These results show that distortion was less for TSE-DWI than for EPI-DWI in the AP phase-encoding direction on each system.1–3
TSE-DWI produces a higher CR than EPI-DWI on a 3.0T MRI system and is more effective at higher magnetic fields, such as on 3.0T MRI systems, than on 1.5T MRI systems. Although both TSE and EPI can benefit from higher magnetic fields, TSE may exhibit a more favorable SNR at higher field strengths due to longer echo times and more efficient signal averaging, which can be achieved with TSE sequences. 9
Physiological and structural characteristics of the uterus might cause significant differences in the ADC values of the uterus between the two sequences on both MRI systems. The ADCs of the malignant lesions were not significantly different between EPI-DWI and TSE-DWI because of the strong associated signal, as shown by the small SD of the malignant lesions.
Although there were no significant differences in image quality between TSE-DWI and EPI-DWI on 1.5T, superior image quality was observed on 3.0T MRI for TSE-DWI. The observed improvement in image quality for TSE-DWI on 3.0T versus that for EPI-DWI probably reflects the amplified effects at higher magnetic field strengths. The increased CR on 3.0T may have accentuated the benefits of the TSE sequences, which are less susceptible to geometric distortions.9,10
A problem is that the acquisition time for TSE-DWI is more than twice that for EPI-DWI at any magnetic field strength. EPI-DWI offers high spatial resolution and short acquisition time, and it is susceptible to artifacts such as geometric distortions. TSE-DWI, on the other hand, provides higher signal-to-noise ratio and less susceptibility to artifacts, but at the cost of longer acquisition time. The optimal choice of sequence depends on the clinical question and the trade-off between image quality and acquisition time. TSE-DWI has been reported to exhibit less motion artifact than EPI-DWI in regions other than the pelvis. 11 Our study demonstrated that TSE-DWI can acquire DWI with less artifact than EPI-DWI even in the female pelvis. TSE-DWI was considered to be more useful than EPI-DWI, especially on the 3.0T system. However, TSE-DWI has a disadvantage of longer acquisition time. Therefore, it may be a good strategy to use TSE-DWI as an additional sequence when EPI-DWI is insufficient.
Our study had some limitations. First, this study was limited by its retrospective design, which may introduce recall bias and limit our ability to establish causality. Future prospective studies were needed to confirm these findings. Second, this was a single-center study with a small patient population and there may be a risk of sample bias. We did not evaluate the diagnostic accuracy because our focus was to compare the image quality between different acquisition protocols. Therefore, our findings and conclusions should be considered as preliminary and need confirmation by additional investigations. Thirdly, different scanning parameters were used for the two DWI sequences. Theoretically, it would have been better to use identical parameters. However, we used clinically applicable sequences and performed imaging within a limited time in a routine clinical setting. Fourth, this study limited to a single MRI manufacturer and series (1.5T and 3.0T), focused on the impact of magnetic field strength on TSE-DWI and EPI-DWI sequences under relatively consistent conditions. Further research across different manufacturers and series is warranted.
In conclusion, we found that female pelvic image quality was better with TSE-DWI than for EPI-DWI. TSE-DWI proved to be an effective method for reducing artifacts and improving the quality of female pelvic MRI. Our findings showed that TSE-DWI produced more useful female pelvic images on the 3.0T system compared to the 1.5T system.
Footnotes
Author contributions
All authors provided substantial contributions to the manuscript and approved the last version of the article to be published.
Declaration of conflicting interests
The authors declared no potential conflicts of interest with respect to the research, authorship, and/or publication of this article.
Funding
The authors received no financial support for the research, authorship, and/or publication of this article.