
Abstract
Background
Hip dysplasia (HD) is a prevalent cause of non-traumatic hip pain, which may result in osteoarthritis. Radiological measurements of HD exhibit variability based on reader and imaging modality, why it is important to know the agreement between different measurement methods.
Purpose
To estimate agreement between measurements of lateral center edge angle (LCEA) and acetabular inclination angle (AIA) made, respectively, on Computed Tomography (CT) scans by humans and radiographs analyzed by an algorithm. To estimate impact of pelvic rotation on agreement between CT and radiographic measurements.
Material and Methods
CT measurements were retrospectively extracted from 172 radiology reports. Radiographs were analyzed using an algorithm. Bland-Altman analysis assessed agreement between CT and radiographic measurements. Regression analyses estimated impact of pelvic rotation on inter-modality agreement.
Results
Mean measured bias (95% confidence interval [CI]) between CT and radiographs for LCEA of right/left hip was 5.53° (95% CI: 4.81 to 6.24) and 5.13 (95% CI: 4.43 to 5.83), respectively. Corresponding values for right/left AIA were 1.08 (95% CI: 0.49 to 1.67) and −0.03 (95% CI: −0.60 to 0.05). Pelvic rotation affected right LCEA and AIA measurements, with a change in obturator foramen index of, respectively, 0.35 and 0.6 resulting in approximately 2° change in values.
Conclusion
There was a significant difference in agreement of 5° between CT and radiographs for the LCEA bilaterally. The difference for the AIA was between 0 and 1°, probably of little clinical significance. Pelvic rotation slightly affected bias of the right LCEA, suggesting minimal clinical impact of a slightly rotated pelvis.
Introduction
Hip dysplasia (HD) is a common radiographic finding with prevalence in asymptomatic patients reported to range from 3.6% to 12.8%. 1 Patients with untreated HD may risk onset of osteoarthritis and are at a higher risk of requiring total hip arthroplasty.2,3 Therefore, early and accurate diagnosis of HD in young adults is important for timely intervention and improved patient outcomes. The initial diagnosis of HD is often made on a weight-bearing anterior-posterior (AP) radiograph of the pelvis. 4 It is typically evaluated by two radiographic measurements, the lateral center edge angle (LCEA) and the acetabular inclination angle (AIA) which, respectively, quantify the acetabular coverage of the femoral head and the inclination of the acetabular roof.4,5 However, considerable human reader inter- and intra-observer variability has been demonstrated for the radiographic measurements of LCEA and AIA. 6 One possible explanation for these measurement variances may arise from the inherent difficulty in precisely identifying anatomical landmarks and adjusting for pelvic position. Using an algorithm (AI) for analyzing radiographs of the pelvis and computing the LCEA and the AIA angles has demonstrated to minimize measurement variance. 6 It has however also been reported that cross-sectional imaging modalities, such as computed tomography (CT), improve characterization of anatomical findings related to HD 4 and are perhaps therefore often performed in the HD patient. 4 Measuring the LCEA and the AIA on radiographs is both time-consuming and repetitive which, coupled with the reported measurement variability, suggests that employing an AI for this task could be advantageous.6,7
The primary aim of this study was to assess agreement in measurements of the LCEA and the AIA between CT scans interpreted by expert human readers and radiographs analyzed using AI. Secondly, to estimate the influence of pelvic rotation on the agreement between the CT measurements and the radiographic measurements obtained by the algorithm.
Methods
Study design
In this retrospective agreement study, we compared measurements of LCEA and AIA made, respectively, by human readers on CT scans of the hips and an algorithm trained to analyze radiographs of the pelvis. The study was approved by the institutional review board (ID: 23/39538) and reported according to the Checklist for Artificial Intelligence in Medical Imaging 8 and the Guidelines for Reporting Reliability and Agreement Studies. 9
Study population
Patients aged 18–45 with no signs of prior surgery, referred for a CT scan of the pelvis with non-traumatic hip pain between January 1st, 2019 and September 21st, 2023 were eligible for inclusion if they had undergone a weight-bearing pelvis radiograph within ±3 years of the CT scan.
Imaging
All pelvic radiographs had been taken while the patient was standing with instructions to evenly distribute their weight on both legs. The legs were internally rotated by approximately 15° according to department protocol. The LCEA, the AIA, and the obturator foramen index (OFI) were obtained from the radiographs by the algorithm (Figure 1). The OFI quantifies rotation of the pelvis as the ratio of the widths of both foramina.10–12 Anatomical horizontal plane is defined by a reference line connecting the most distal parts of both inferior pubic rami (dotted blue line). The LCEA (orange lines) is the angle between two lines from the center of the femoral head, one perpendicular to the reference line (dotted blue line) and one that extents to the lateral sourcil of the acetabulum. The AIA (green lines) is the angle between two lines extending from the medial part of the acetabular sourcil, one parallel to the reference line and one that extends to the lateral part of the sourcil. The OFI is the ratio between the widths of the foramina (yellow lines).
The CT scans were made with the patient in the supine position, both legs internally rotated so the patellae faced anteriorly and the legs positioned flat against the table. The images were reconstructed using the AW VolumeShare 4 software (General Electrics, Chicago, USA) by trained radiologists or reporting radiographers. The center of the femoral head was found by fitting a circle to the outer circumference of the femoral head and aligning it in the coronal, sagittal, and axial planes. In the coronal plane, the rotation of the slice was adjusted so that both centers of the femoral heads were aligned in the same plane. On this reconstructed coronal-plane image, the measurements of LCEA and AIA were performed (Figure 2). On the reconstructed coronal plane CT image, the reference line is an anatomical horizontal line connecting the centers of the femoral heads (dotted blue line). The LCEA (orange lines) is the angle between two lines from center of the femoral head, a line perpendicular to the reference line (dotted blue line) and one that extends to the most lateral bony aspect of the acetabulum. The AIA (green lines) is the angle between two lines, one parallel to the reference line (dotted blue line) and one that extends from the medial sourcil to the most lateral bony aspect of the acetabulum.
Algorithm
The non-commercial algorithm (RBhipTM, Radiobotics, Copenhagen, Denmark) automatically analyzed the radiographs using deep learning and computer vision. It independently segments the pelvis, acetabulum, femoral head, and neck using a modified U-Net architecture with ResNet34 as a backbone. The algorithm was trained on over 2900 pelvis radiographs. The algorithm has previously been found reliable when measuring the LCEA, the AIA, the OFI, and the width of the hip joint space.6,13
Data collection
The algorithm was installed as a Software as a Service (SaaS) within the hospital firewall. All radiographs were analyzed and measurements returned as individual annotated DICOM files and as a collated dataset. The dataset was imported into a Research Electronic Data Capture (REDCap) database. To ensure consistency, two separate analyses were made of all included radiographs.
The CT measurements of the LCEA and the AIA that had been made by human experts at the time of scanning were gathered from the radiology reports. Additionally, data on gender and age at the time of the CT scan were collected and stored in the REDCap database alongside all CT measurements.
Statistics
Descriptive statistics were used to summarize patient characteristics of age and sex. Values of LCEA and AIA by both modalities were described as mean with standard deviation (SD). Agreement between measurements made on CT scans and radiographs were estimated and illustrated with Bland-Altman (BA) plots and 95% limits of agreement (LoA). Assuming normality of data, the LoA estimate is the range within which 95% of all differences between CT (human readers) and radiographs (AI) will fall. Bias (defined as the mean measured difference between CT and radiographs) and respective 95% confidence intervals (CIs) were reported. 14 The BA LoA analysis was used to compare algorithm double analyses to estimate consistency of output. Impact of OFI on agreement between CT (human readers) and radiographic (AI) measurements was estimated using a linear regression analysis and depicted in scatter plots.
To assess potential algorithm selection bias, differences in sex, LCEA, and AIA between radiographs analyzed by the algorithm and those excluded due to technical reasons were estimated by the student’s t test. For all analyses, p-values <0.05 were considered statistically significant. The Stata version 18 (StataCorp. 2023, College Station, TX, USA) was used for all statistical analyses.
Results
In total, 243 patients who had obtained a CT of the hips and a weight-bearing radiograph of the pelvis were eligible for analyses. The algorithm was not able to analyze 71 of the radiographs due to incompatible DICOM format resulting in 172 included radiographs (Figure 3). The mean age of included patients was 25 years and 137 (80%) were female. In three cases, the algorithm computed unilateral analyses of the LCEA, while in 10 cases, the algorithm did not provide an AIA measurement, and in two cases, an OFI was not measured. Using the CT measurements to compare the group of analyzed and not analyzed radiographs, no significant differences between the groups were found in distribution of sex (p = .38), LCEA right/left (p = .74/p = .40), and AIA right/left (p = .54/p = .489). CT, computed tomography.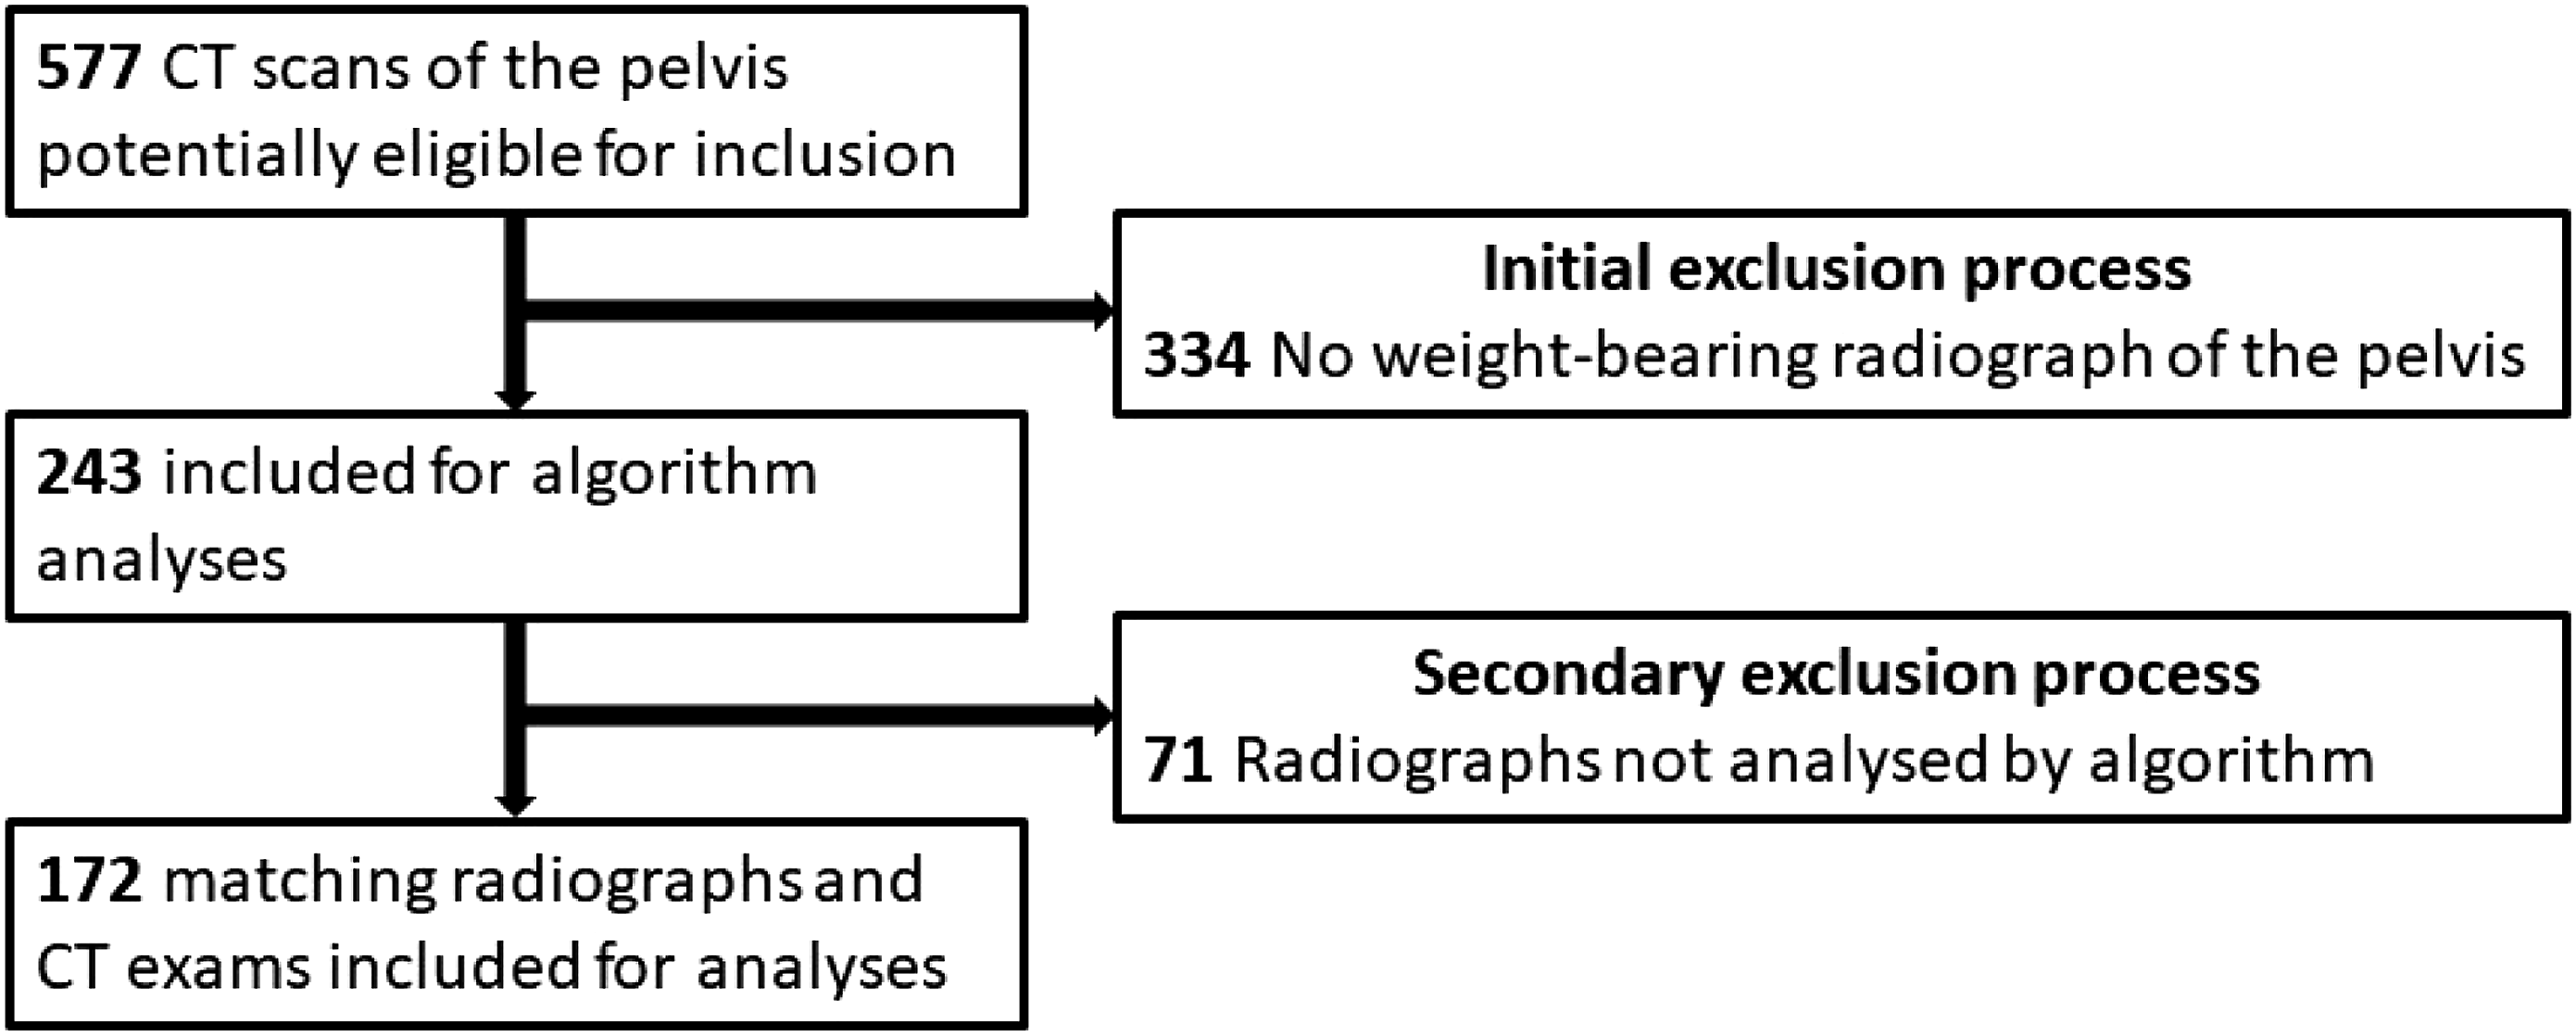
Bland-Altman analysis with limits of agreement estimating mean differences between CT (humans) and radiographic (AI) measurements of LCEA and AIA.

CT, computed tomography; CI, confidence interval; LCEA, lateral center edge angle; AIA, acetabular index angle.

BA, Bland-Altman; LCEA, lateral center edge angle; AIA, acetabular index angle; CT, computed tomography; XR, radiograph.
Linear regression analysis. Rotation of the pelvis (obturator foramen index) influences the right LCEA and AIA measurements.
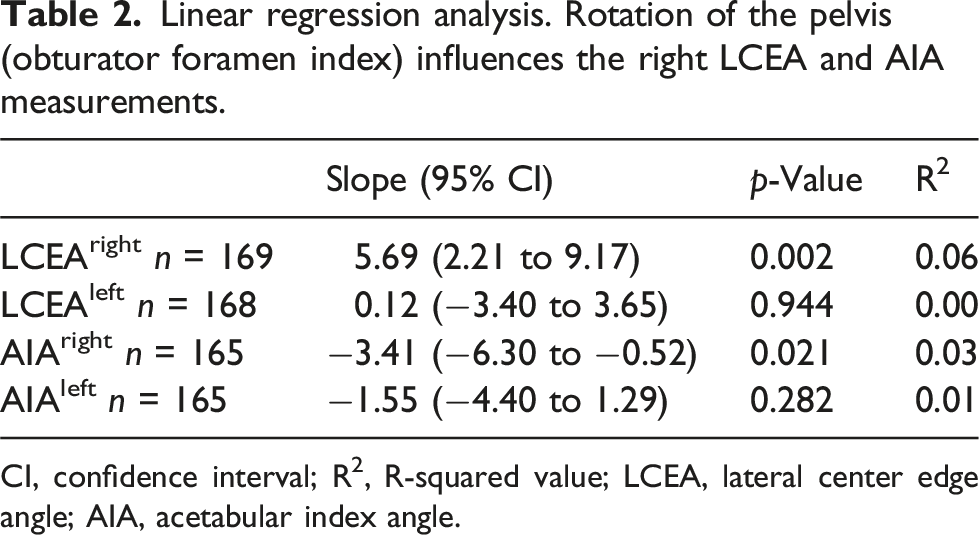
CI, confidence interval; R2, R-squared value; LCEA, lateral center edge angle; AIA, acetabular index angle.

OFI, obturator foramen index; CT, computed tomography; XR, radiograph; LCEA, lateral center edge angle; AIA, acetabular index angle.
Discussion
To the best of our knowledge, no study has compared measurements of LCEA and AIA between CT and radiographs using a deep learning algorithm to compute the radiographic measurements. We found a significant difference in all measurements between CT and radiographs except for left AIA; however, for the AIA of the right hip, the bias was approximately 1°, which is likely not a clinically significant finding. Bias for the LCEA bilaterally was approximately 5°. Pelvic rotation only influenced the measurements of LCEA and AIA for the right hip.
In our study, the mean measured LCEA was significantly higher (approximately 5°) when measured on CT as compared to the radiographic measurement. Similar findings have been reported albeit with measurements made by human readers on both radiographs and CT.15,16 Substantial variances in measurements have previously been reported when expert human readers measure the radiographic LCEA with repeatability coefficients ranging from approximately 12 to 15°. 6 However, in our study an algorithm with proven consistency was used6,13; it is therefore fair to assume that the radiographic measurements were not influenced by measurement variance. Difference in measurement methodology may, however, have influenced the mean measured differences between the CT and the radiographic measurements found in our study. When defining the lateral aspect of the acetabulum, two anatomic landmarks have been suggested, the bone-edge, that is, the most lateral extend of the acetabulum, and the edge of the sourcil, defined as the most lateral sclerotic delineation of the weight-bearing aspect of acetabular roof. 15 When comparing radiographic measurements using those two anatomical definitions of the lateral extent of the acetabulum, differences of up to 7° for the LCEA have been shown, naturally with the method applying the most lateral bony aspect of the acetabulum yielding the highest center edge angles. 15 The algorithm used in our study defines the edge of the sourcil as anatomical measuring point when analyzing the radiographs where the CT scans were measured using the most lateral bony aspect as a landmark. This may in part explain the systematically higher LCEA measured on CT in our study.
In contrast to our study, Salih et al. 17 reported a bias of −3.1° for LCEA, indicating that the measured value of LCEA was smaller when measured on CT images as compared to on radiographs. One possible explanation for this discrepancy could be that their study focused on patients admitted for periacetabular osteotomy, and the mean LCEA measured on CT was 19.7° as opposed to a combined mean of 31.1° in our study. However, their LoA was comparable to the ones found in our study spanning approximately 17.5° versus a span of approximately 18° in our study. 17
Jacobsen et al. 12 explored the impact of pelvic rotation on LCEA measurements using a cadaver model and found that in order to detect a ±2° difference in LCEA, the OFI needed to be below 0.5 or exceed 1.9. Data from our study indicated that to detect a similar difference of ±2° in LCEA, OFI would need to be below 0.65 or exceed 1.35 for the right hip. Measurements of the left LCEA and the left AIA showed no significant slope. One possible explanation for this difference between left and right might be the low R2 values suggesting that the slopes might have been influenced by outliers.
The HD reference values for LCEA and AIA are typically based on radiographic measurements. 18 Therefore, the lower measured values of LCEA by the algorithm could indicate that a larger cohort would be suspected for HD when analyzed by the AI. This highlights the potential of the algorithm as a screening tool. However, this remains to be proven in future studies correlating AI measured values of LCEA and AIA to clinical findings. Moreover, the complexity of HD extends beyond the measures presented in this study; the radiographs are also examined for signs of retroversion such as the crossover sign, the ischial spine sign, and the posterior wall sign.19,20 An effective algorithm employed in a representative cohort of patients with suspicion of HD should preferably be able to identify these signs. However, the use of LCEA and AIA as a tool for triaging patients in a symptomatic population might be beneficial, and perhaps it is in this application that a deep learning algorithm such as this might have its eligibility.
Human measurements of both the LCEA and the AIA have been reported with significant intra- and interobserver variability.6,21 Therefore, the impeccable repeatability exhibited by the algorithm in this study establishes a robust and reliable standard for the radiographic measurement. To assess clinical validity of the algorithm, future studies are needed. The retrospective nature of collecting the CT measurements is a limitation in the current study, as we were not able to control measurement procedure and we have no data on potential observer variance. All CT measurements, however, were made according to a standardized protocol and were routinely double-checked by experienced professionals.
An inherent limitation in the current study is that we compared measurements with the patient in the supine position (CT) to measurements obtained in the upright position (radiographs). This difference in patient positioning, that is, upright versus supine, has been shown to affect the measurements of LCEA and AIA where the LCEA was approximately 1° smaller on a weight-bearing radiograph and oppositely the AIA was 0.4° to 2.3° higher when obtained from weight-bearing radiographs.22–24 Moreover, the reference line on CT and radiographs was, respectively, connecting the center of the femoral heads and the inferior delineation of the inferior pubic rami. This difference in definition can potentially have affected our results. Due to technical constraints, the algorithm did not analyze 71 out of the 243 radiographs, introducing a potential selection bias to the study’s results. Nonetheless, no significant differences between the two groups of radiographs, that is, analyzed and not analyzed, were evident.
In conclusion, agreement between CT and radiographic measurements, estimated by bias, was approximately 5° for the LCEA bilaterally with the higher values measured on CT. For AIA, the bias was, respectively, 1° and 0° for the right and left hip. Pelvic rotation slightly affected bias between CT and radiographic measurements of the right LCEA and AIA with a change in OFI of, respectively, 0.35 and 0.6 corresponding to approximately 2° change in measured value of LCEA and AIA, indicating that a slightly rotated pelvic radiograph has limited clinical effect on the measurements of LCEA and AIA.
Footnotes
Declaration of conflicting interests
The author(s) declared no potential conflicts of interest with respect to the research, authorship, and/or publication of this article.
Funding
The author(s) received no financial support for the research, authorship, and/or publication of this article.