
Abstract
Background
The left piriform cortex and amygdala (PC&A) tend to be slightly hyperintense relative to the right PC&A on T2-weighted fluid-attenuated inversion recovery (T2W-FLAIR) images in patients with probable Alzheimer’s disease (pAD). This likely represents the antecedent and thus advanced degeneration of the left PC&A.
Purpose
To investigate the relationship between left PC&A hyperintensities and cerebral cortical atrophy on magnetic resonance (MR) voxel-based morphometry in patients with pAD and discuss how this finding could relate to AD progression.
Material and Methods
Patients with pAD (n = 47; age range = 68–93 years, mean = 80.8 ± 6.7 years; 14 men and 33 women) who underwent T2W-FLAIR imaging and MR morphometric study using a voxel-based specific regional analysis system for AD (VSRAD) were retrospectively examined. To measure signal intensity ratios of the left to right PC&A (L-PC&A/R-PC&A), regions of interest (ROIs) were set on the transaxial images in which both PC&As were most broadly depicted; the ROIs were defined as large as possible. Correlations between the L-PC&A/R-PC&A and medial temporal lobe cortical atrophy (MTLCA) as well as whole cerebral cortical atrophy (WCCA) on VSRAD were determined. Correlation between the L-PC&A/R-PC&A and age was also determined.
Results
The L-PC&A/R-PC&A correlated with both MTLCA (r = 0.375, p = .010, 95% confidence interval [CI] = 0.095–0.600) and WCCA (r = 0.576, p < .001, 95% CI = 0.343–0.742). The L-PC&A/R-PC&A did not correlate with age (r = 0.013, p = .932, 95% CI = −0.282–0.305).
Conclusion
Left-sided dominance of PC&A degeneration appeared to accelerate with the progression of AD stages.
Keywords
Introduction
The left piriform cortex (anterior part of the parahippocampal cortex including entorhinal cortex) and amygdala (PC&A; Figure 1) are recognized to exhibit the earliest degeneration (neuroinflammation and atrophy) in patients with Alzheimer’s disease (AD)/probable AD (pAD) in neuropathological and MR morphometric studies.2–6 The left PC&A tend to become slightly hyperintense relative to the right PC&A on T2-weighted fluid-attenuated inversion recovery (T2W-FLAIR) magnetic resonance (MR) images in patients with pAD
7
; this finding presumably represents a precursory and thus more advanced neuroinflammation of this region. The neuroinflammation occurs with interstitial immune cell infiltration and edema, accompanied by blood–brain barrier (BBB) disruption, which is considered a trigger of neural degeneration.8–10 Therefore, interstitial edema associated with BBB disruption might serve as a biomarker for AD activity. A schematic illustration of the piriform cortex and amygdala (PC&A, area filled in gray) in the left medial temporal lobe, originally created by referring to a cytoarchitectonic mapping study.
1

This study aimed to investigate the relationship between left PC&A hyperintensities and cerebral cortical atrophy using voxel-based morphometry and discuss how this finding could relate to the stage of AD.
Materials and methods
Participants
Data of patients with pAD (n = 47; age range = 68–93 years [mean = 80.8 ± 6.7 years]; 14 men and 33 women) who underwent T2W-FLAIR imaging and MR morphometric studies using the voxel-based specific regional analysis system for AD (VSRAD; Advance 2; Eisai, Tokyo, Japan)11–14 during 2022–2024 were consecutively retrieved from the PACS database. T2W-FLAIR images with blurred artifacts, and those in patients receiving chemotherapy and/or with uncontrolled diabetes (n = 3), which are important causes of cerebral atrophy, were excluded from the evaluation. The database did not include patients with alcohol abuse or localized cerebral atrophy caused by previous cerebrovascular or inflammatory diseases. pAD was diagnosed by certified neurologists (AS et al.) at our hospital using the National Institute of Aging/Alzheimer’s Association criteria15,16 based on neurological and neuropsychological examination results, including the Mini-Mental State Examination (n = 40; score range: 11–27) or Revised Hasegawa’s Dementia Scale (n = 7; score range: 18–26), brain imaging, and laboratory test results to exclude other causes of cognitive impairment.
The study protocol was approved by our Institutional Review Board. The requirement for informed consent was waived due to the retrospective nature of this study.
MR imaging procedure
MRI was performed using a 3-T magnet (Ingenia; Philips Medical Systems, Best, Netherlands) with a phased-array 16-channel head coil. Transaxial images analyzed were 2D-T2W-FLAIR images (TR/TI/TE = 110000/2800/130 ms; flip angle = 90°, echo-train length = 39) obtained using the following imaging parameters: section thickness = 5 mm, interslice gap = 1 mm, field of view (FOV) = 230 × 230 mm, matrix size = 288 × 234, and number of excitations (NEX) = 1.
Regarding the VSRAD analysis, sagittal 3D-T1-weighted turbo field echo images were obtained using the following parameters: TR/TE = 4.7/2.3 ms, flip angle = 10°, section thickness = 1.6 mm, FOV = 240 × 240 mm, matrix size = 268 × 268, and NEX = 1.
Processing and statistical analysis
The signal intensity ratios of the left to right PC&A (L-PC&A/R-PC&A) were calculated using a DICOM viewer interlinked to a PACS (Radiforce RX660-ARBK; EIZO; Hakusan, Japan; 21 in, 5-MP screen). Regions of interest (ROIs) were set on the transaxial images in which both PC&As were most broadly depicted; ROIs were defined as large as possible, ensuring that they did not extend to the edges, by referencing to the PC&A areas on T1-weighted (T1W) images, which provided optimal gray/white matter contrast (Figure 2(a) and (b)). The mean of the left-right ratio of ROI sizes per individual was 1.04 ± 0.22. (a) T2W-FLAIR image of a patient with probable Alzheimer’s disease (pAD). The left piriform cortex and amygdala (PC&A) appear visually hyperintense compared with the right PC&A. ROIs are defined as the bilateral PC&A to measure signal intensities, and signal intensity ratio of the left to right PC&A (L-PC&A/R-PC&A) is 1.08 (b) T1W-SE image at the same level as (a).
All measurements were performed by a certified diagnostic radiologist (HI). Additionally, the L-PC&A/R-PC&A measurements were independently performed by a radiological technologist (SN) with 13 years of experience. Both observers measured ROIs without knowing about the VSRAD results. Intraclass correlation coefficients (ICCs [1,1]) were used to assess the inter-observer reliabilities of the measurements.
Subsequently, we calculated the correlations between the L-PC&A/R-PC&A and following two VSRAD results: (1) medial temporal lobe (MTL) cortical atrophy (MTLCA): the mean value of positive Z-scores (based on a database of age-matched cognitively healthy individuals) in the target volume-of-interest (VOI: parahippocampal cortex, amygdala, and hippocampus) and (2) whole cerebral cortical atrophy (WCCA): the percentage of voxels with a Z-score of >2 in the whole cerebrum. Additionally, the correlations between the MTLCA and WCCA, and that between L-PC&A/R-PC&A and age were calculated. (a) Relationship between signal intensity ratios of the left to right PC&A (L-PC&A/R-PC&A) and medial temporal lobe cortical atrophy (MTLCA). (b) Relationship between signal intensity ratios of the left to right PC&A (L-PC&A/R-PC&A) and whole cerebral cortical atrophy (WCCA).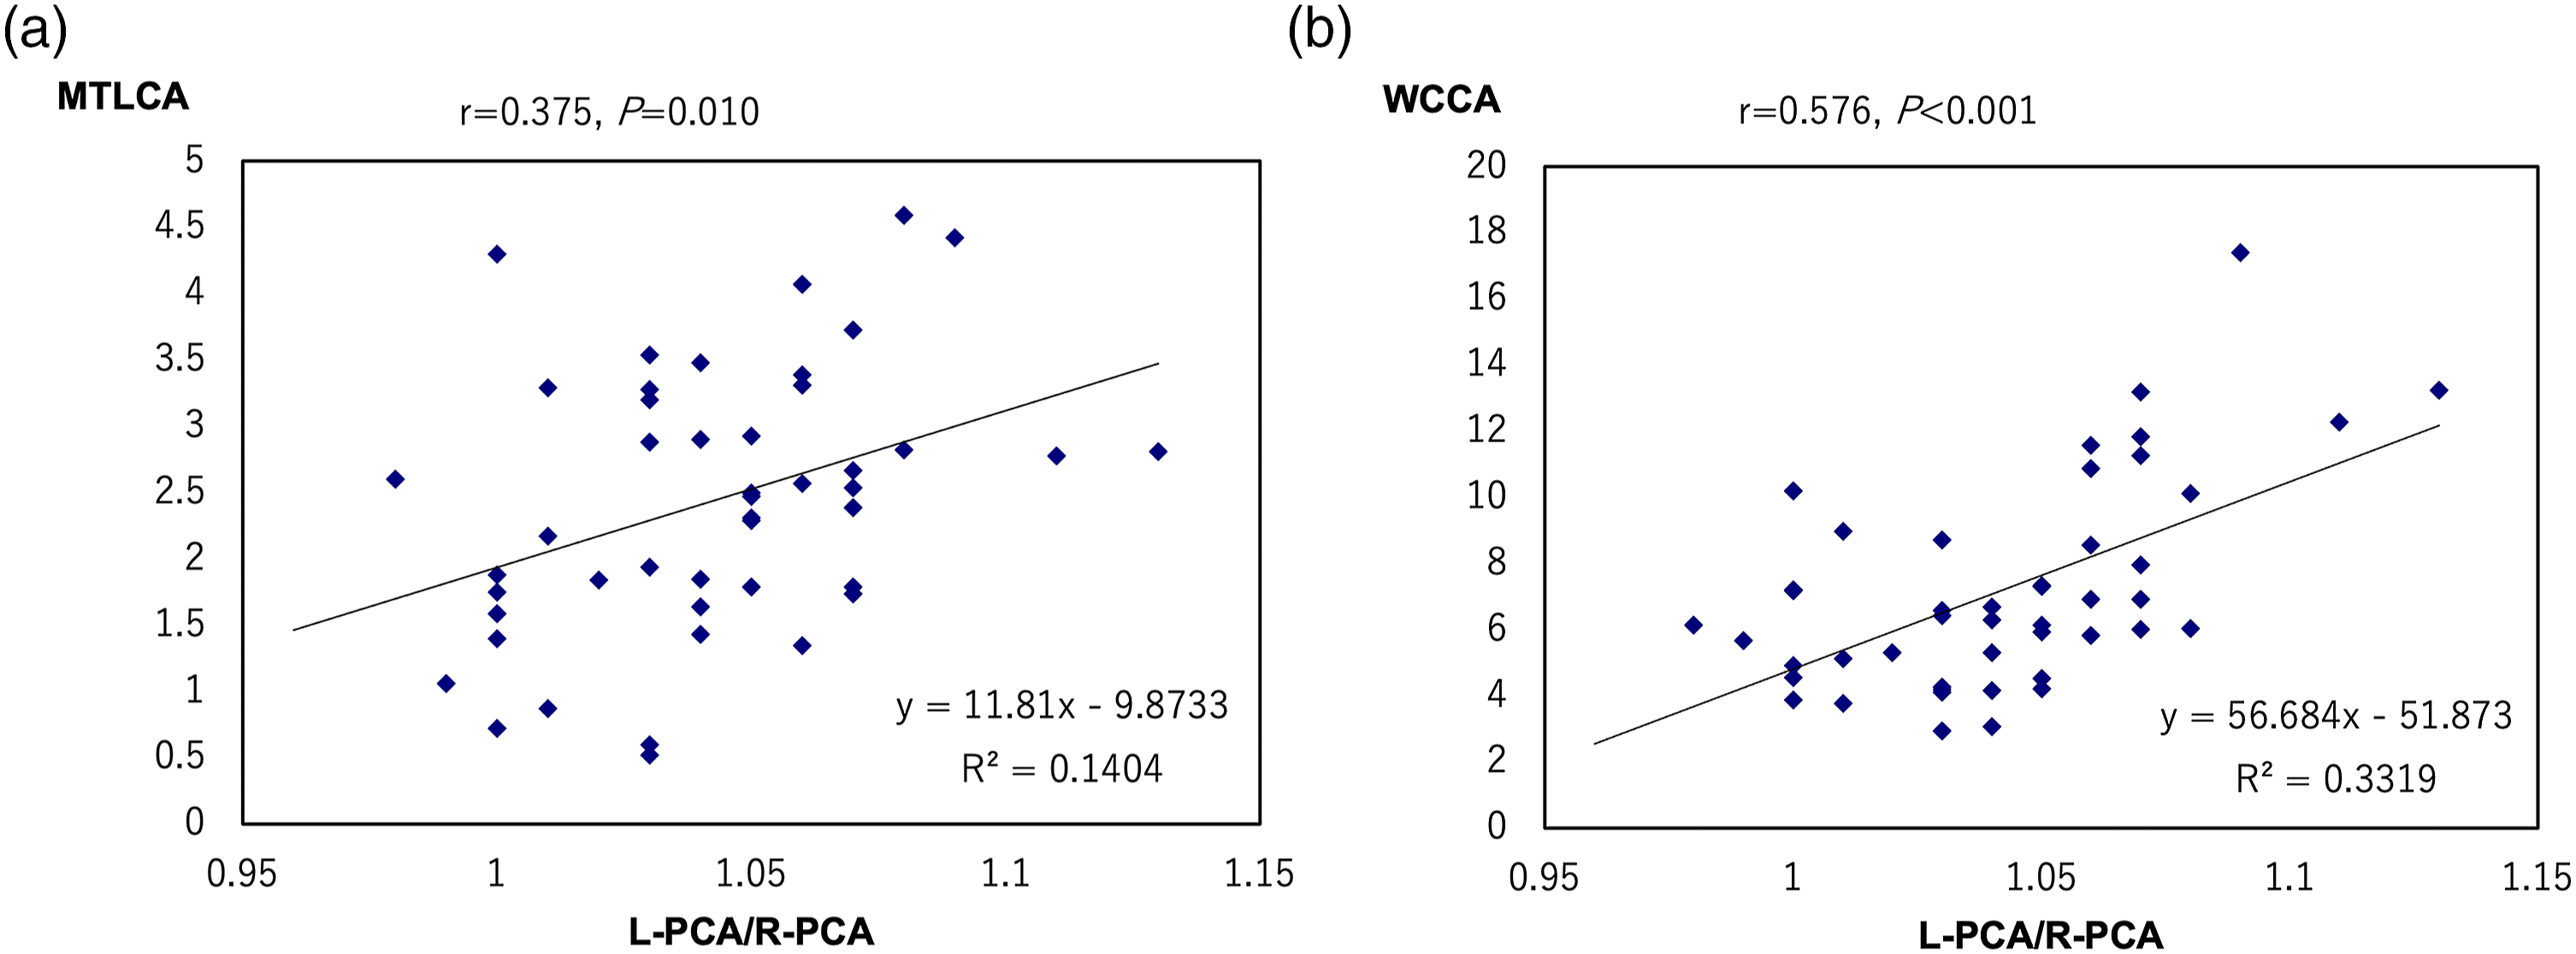
All statistical analyses were performed using SPSS version 29 (IBM Corp., Armonk, NY, USA). Statistical significance was set at p < .05.
Results
The ICC for the inter-observer reliabilities of the L-PC&A/R-PC&A measurements was 0.925 (p < .001), indicating the high reliability of the measurements.
The L-PC&A/R-PC&A correlated with both MTLCA (r = 0.375, p = .010, 95% CI = 0.095–0.600) and WCCA (r = 0.576, p < .001, 95% confidence interval [CI] = 0.343–0.742) (Figure 3). MTLCA correlated with WCCA (r = 0.596, p < .001, 95% CI = 0.370–0.756). The L-PC&A/R-PC&A did not correlate with age (r = 0.013, p = .932, 95% CI = −0.282–0.305).
Discussion
The neuropathological stages of AD correlate with the distribution of neurofibrillary tangles (NFTs) containing aggregated tau proteins within the neuron, which is associated with microglia-mediated neuroinflammation, neuronal death, and cortical atrophy.6,17,18 NFTs are primarily confined to the MTL of the limbic cortex; this stage corresponds to the pre-clinical phase of AD. NFTs then spread widely to other limbic cortices, manifesting as mild cognitive impairment, followed by extensive involvement in the neocortex and clinically overt dementia. 6
In the present study, we found significant correlation between left PC&A hyperintensities on T2W-FLAIR images and both MTLCA and WCCA, which suggests that left PC&A hyperintensities (neuroinflammation) continue to progress with the advancing stage of AD. This probably means that the left PC&A neuroinflammation appears to progress more rapidly than does the right PC&A with advancing stage of AD.
The correlation of left PC&A hyperintensities with MTLCA is relatively weak compared with that with WCCA, despite finding of moderate correlation between MTLCA and WCCA. Prominent interstitial edema accompanied by neuroinflammation in the PC&A region might counteract atrophy as a cause of this phenomenon.
Although we previously demonstrated that the left PC&A tend to be slightly hyperintense due to normal aging as well, 7 no correlation was found between left PC&A hyperintensity and aging in the patient with pAD in the present study.
The present study did not include participants who were diagnosed with early-onset AD, which is known to have a different pattern of progression from that observed in late-onset AD; early-onset AD has been reported to show widespread neocortical atrophy from the initial stage, followed by limbic cortical atrophy. 19
This study has the following limitations: 1) Relatively small number of cases. (2) As previously indicated, the degree of atrophy on VSRAD is identified without distinguishing between left and right cerebral hemispheres. Separate evaluation on each side would be ideal. (3) The study used 2D- rather than 3D-T2W-FLAIR images for evaluation. Future studies using thinner slices, such as 3D high-resolution imaging, would be beneficial for more accurate delineation of the PC&A and SI analyses.
In conclusion, left-sided dominance of PC&A degeneration appeared to accelerate with the progression of AD stages.
Footnotes
Declaration of conflicting interests
The author(s) declared no potential conflicts of interest with respect to the research, authorship, and/or publication of this article.
Funding
The author(s) received no financial support for the research, authorship, and/or publication of this article.