
Abstract
Background
Computed tomography (CT) contributes to 60% of the collective dose in medical imaging. Literature has demonstrated that patient dose varies across regions and countries. Establishing diagnostic reference levels (DRLs) contributes to the optimization of clinical practices and radiation protection.
Purpose
To survey the dose indices (CTDIvol and dose-length product) for frequently performed CT examinations from the chosen hospitals in Norway and Canada and to determine local DRLs (LDRLs) based on the collected data.
Material and Methods
The survey included eight scanners from two Norwegian hospitals and four scanners from four Canadian hospitals. Dosimetry data were collected for the following routine CT examinations: head, contrast-enhanced thorax, and abdomen and pelvis. Overall 480 adult average-sized patients from Norway and 360 from Canada were included in the survey. The LDRLs were determined as the 75th percentile of distributions of median values of dose indicators from different CT scanners. The differences in dose between scanners were determined using single-factor ANOVA.
Results
The LDRLs determined in Norway were higher overall than in Canada. The obtained values were compared to the national DRLs. The dose from several scanners in Norway exceeded national Norwegian DRLs, while Canadian LDRLs were below the Canadian reference levels. The differences between the means of the dose distributions from each scanner were statistically significant (p < 0.05) for all examinations with exception of identical scanners located in the same hospital and using the same protocols.
Conclusion
Observed dose variations even in the same hospital, or from the same scanner model confirmed the need for CT protocol optimization.
Introduction
In recent years, computed tomography (CT) has expanded immensely due to the accuracy and reliability of detecting disease. 1 Given its continuous evolution, CT remains a valuable and indispensable tool for diagnosing abounding diseases within medical imaging.2,3 The radiation exposure received by a patient is considered intentional because the radiation is used to obtain the necessary information to complete the diagnosis. 4 Still, CT scans can contribute up to 60% of the collective dose in medical imaging, which is disproportionate to the number of scans performed. 5 Literature has demonstrated that patient dose varies across regions and countries due to several factors, including CT scanner design, diagnostic protocols, and local-based choices of technical parameters. 6 Therefore, opportunities exist for optimization to ensure that patients do not receive unnecessarily high doses of ionizing radiation.7,8
Diagnostic reference levels (DRLs) are used in medical imaging to optimize clinical examinations. In accordance with the International Commission on Radiological Protection (ICRP), DRLs are applied to an easily measured quantity. 9 In CT such quantities are specific dosimetry indices, volume CT dose index (CTDIvol) and dose-length product (DLP). DRLs are typically set at the 75th percentile of the distribution of the quantity obtained from the surveys. DRLs can facilitate the identification of abnormally high doses within specific institutions allowing hospitals to compare patient doses for CT examinations, and if median doses exceed these DRLs, it can help to identify how the facility can benefit from optimization.9,10 It has been shown that there is a reduction of dose in the clinical setting with the implementation of DRLs. 11
Many countries have implemented National DRLs (NDRL) and Local DRLs (LDRL), which have demonstrated a reduction in patient dose over time.12,13 National reference levels in CT were established in 2018 in Norway 14 and in 2016 in Canada. 15 The diagnostic imaging department can use NDRLs and LDRLs as a guide to optimizing CT scanning protocols according to patient characteristics to reduce patient dose to meet the ‘as low as reasonably achievable’ (ALARA) principle while maintaining acceptable image quality. 5 Both, Canada and Norway have similar health care systems, therefore a comparison of clinical practices will provide valuable suggestions for CT dose and protocol optimization.
This study aims to survey dose indices (CTDIvol and DLP) for frequently performed CT examinations from the chosen hospitals in Norway and Canada and to determine local DRLs based on the collected dosimetry data.
Materials and methods
Computed tomography scanners
Characteristics of the CT scanners included in the survey.

Superscript DS indicates a dual-source.
aNotation of the detector configuration: the number of active detector rows x the detector element thickness; an additional factor of 2 indicates that a z-flying focal spot is used to double the number of slices acquired in one rotation.
Patients population
Acquisition parameters for CT examinations on each scanner.

aDynamic volume scan.
Data analysis
Data were collected retrospectively from Picture Archiving and Communication Systems (PACS) and contained the CTDIvol, mGy, and DLP, mGy·cm, from each patient study in the survey. The following PACS solutions were employed in Norway and Canada respectively: Sectra IDS7, Version 20.2 (Linköping, Sweden) and Agfa Impax, Version 6.6.1.6014 (Agfa HealthCare, Mortsel, Belgium). The analysis of collected data was performed using Microsoft Excel 2019 (Microsoft Corporation, Redmond, WA, USA). Descriptive statistical analysis of the collected dosimetry parameters CTDIvol and DLP were performed for each CT scanner and each type of examination. The differences in radiation doses between scanners were determined using a single-factor ANOVA statistical test, with p < 0.05 indicating statistical significance. The ANOVA test was performed using Excel for each examination from all scanners, and also separately for the Canadian and Norwegian CTs, as well as for the groups consisting of the same scanner models, or the scanners using identical protocols (Table 2). According to the ICRP recommendations, the DRLs for the selected CT examinations were determined as the 75th percentile of distributions of median values of dose values from different CT scanners. 9 The results represent the local reference levels for each country included in this study. These were compared with NDRLs for Norway 14 and Canada 15 and data from the United States of America (USA), 17 Switzerland 18 the United Kingdom, 19 France, 20 and Australia 21 to represent an international set of NDRLs. It is important to mention that there is no set NDRL for abdomen and pelvis examinations in Norway.
Results
The exposure parameters for all protocols from each scanner are listed in Table 2. All considered examinations, except the head CT on Aquilion One, used helical scanning and implemented Automated Exposure Control. Aquilion One utilized a 16 mm wide dynamic volume scan allowing to image head (brain) in one rotation. All scanners included in the survey employed iterative image reconstruction techniques specific to the model and the manufacturer.
Results of statistical analysis showing the min/max range, the mean, and standard deviation for the CTDIvol and DLP values for all examinations on each scanner.

Dash (—) indicates not applicable.
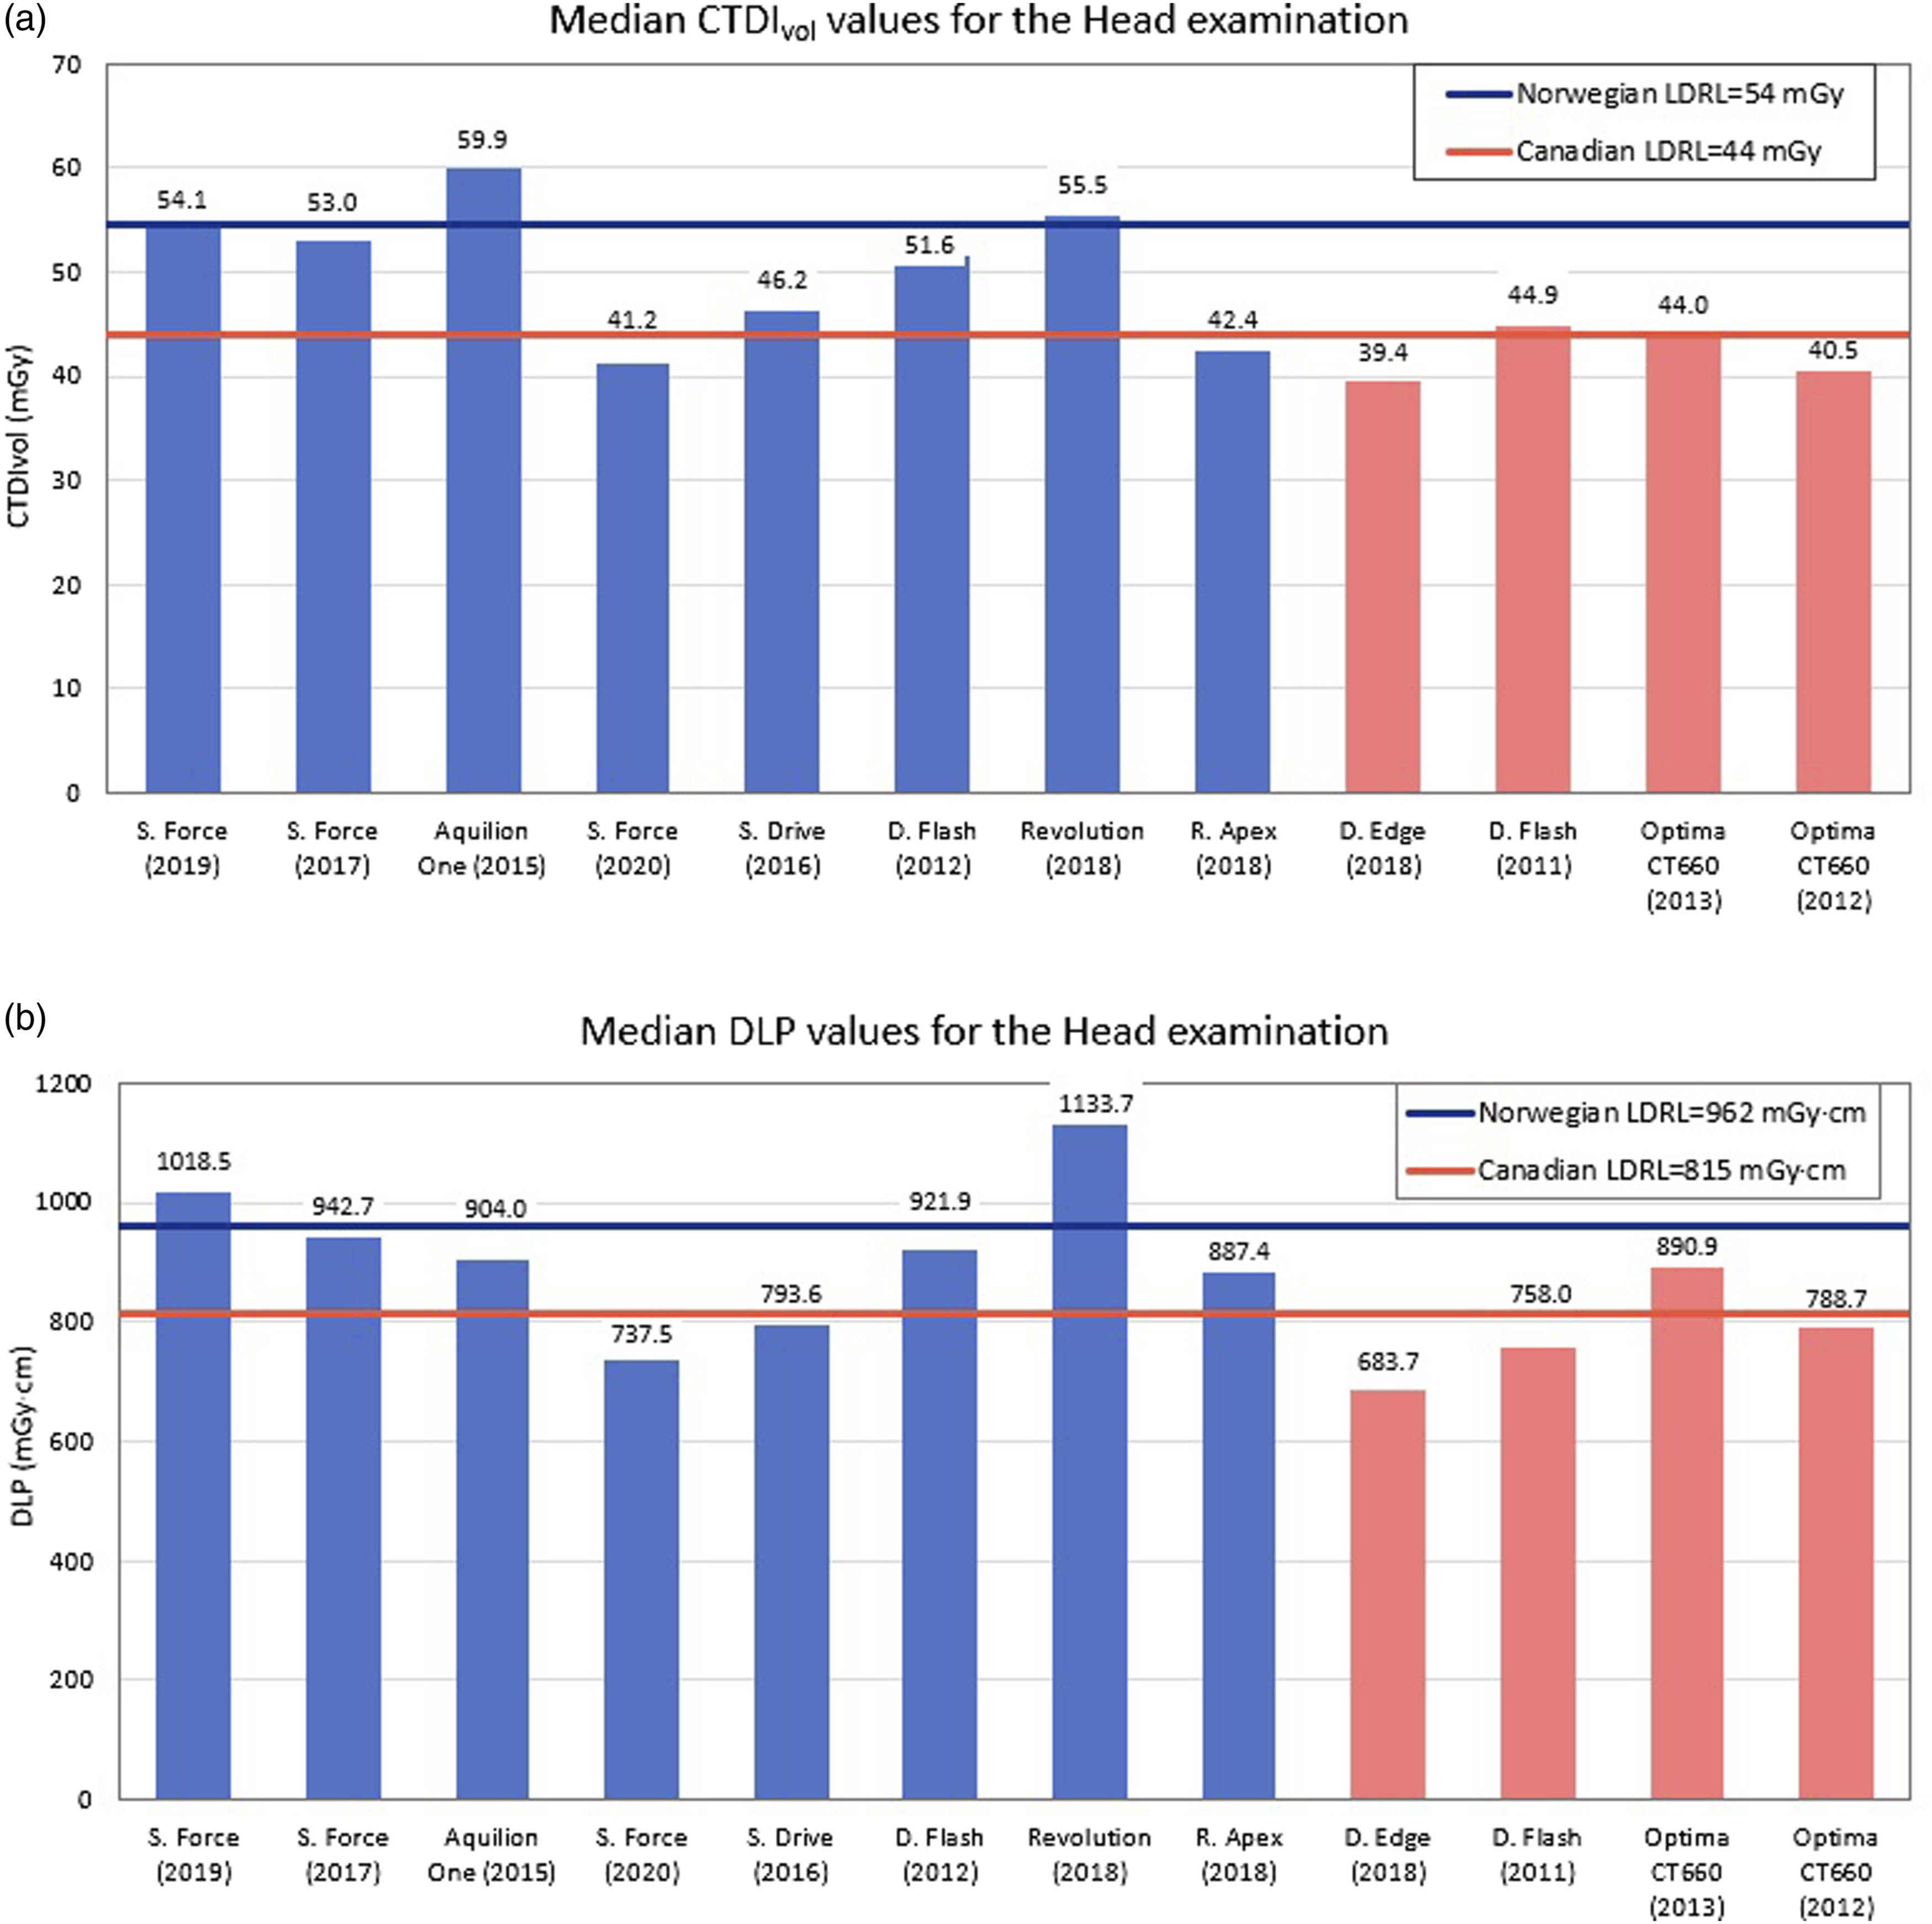
Distribution of the median CTDIvol (a) and DLP (b) values from all individual scanners for the head examination. The first eight bars correspond to the Norwegian hospitals and the last four to the Canadian sites; horizontal lines correspond to the determined local DRLs from each country.

Distribution of the median CTDIvol (a) and DLP (b) values from all individual scanners for the thorax examinations. The first eight bars correspond to the Norwegian hospitals and the last four to the Canadian sites; horizontal lines correspond to the determined local DRLs from each country.
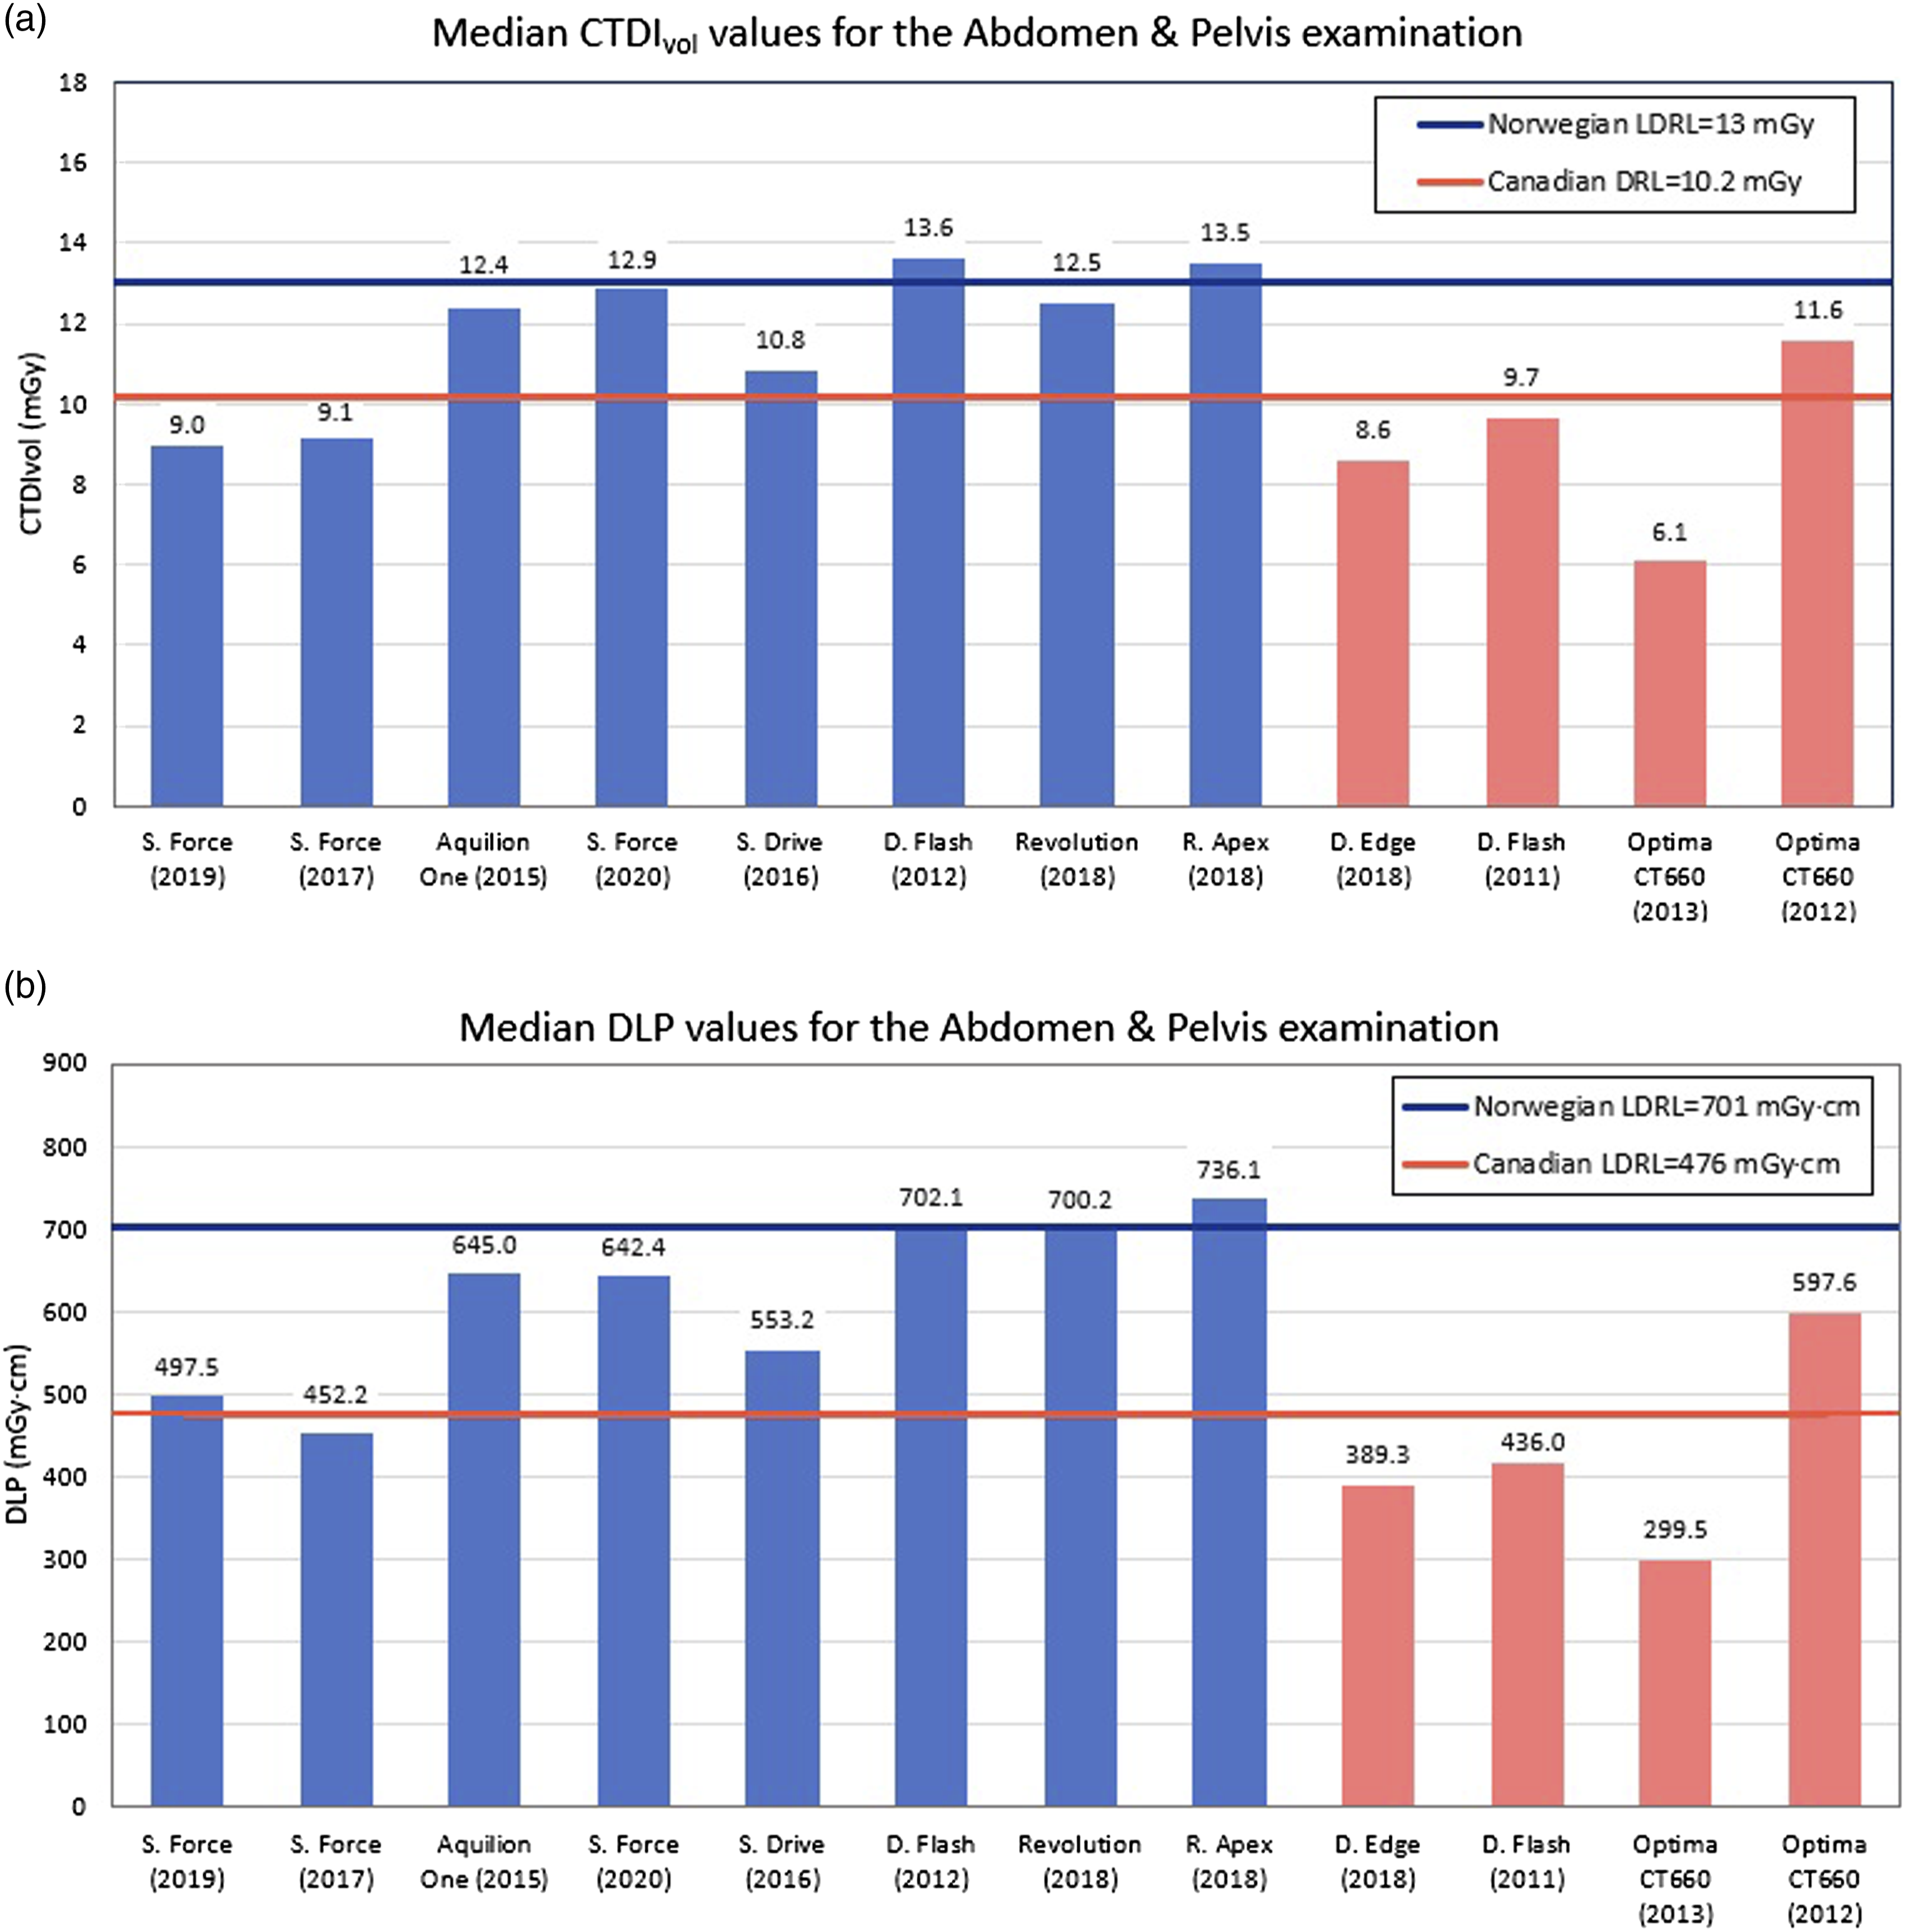
Distribution of the median CTDIvol (a) and DLP (b) values from all individual scanners for the abdomen and pelvis examinations. The first eight bars correspond to the Norwegian hospitals and the last four to the Canadian sites; horizontal lines correspond to the determined local DRLs from each country.
The differences between the means of the dose distributions from each scanner were statistically significant (p < 0.05) for all examinations not only between the countries but within the Canadian and Norwegian groups as well. Significant differences were also found between the mean values collected from the identical scanner models located at different hospitals. However, for some examinations, the scanners from the same hospitals and using the same protocols demonstrated non-significant differences in doses (p > 0.05). Thus, similar doses were collected from the two Somatom Force scanners in hospital # 1 with the p-values of 0.31, 0.74, and 0.90 for the head, thorax, and abdomen and pelvis examinations, respectively. Similarly, for the two GE scanners from hospital # 2, p = 0.12 for the thorax and p = 0.62 for the abdomen and pelvis, with a significant difference for the head examination.
The local and national Norwegian and Canadian DRLs are demonstrated in Figure 4 in comparison with the published international data. It should be noted that Norway has no established reference levels for the abdomen and pelvis examination. The NDRLs for the head and thorax in Norway are in the same range as the international data. Canadian NDRLs for the head CT are the highest among compared countries. For the thorax and abdomen and pelvis examinations, Canadian NDRLs are closer to the international values; however, they are still at the higher end of the spectra.
Discussion
The local reference levels in Canada were lower than the LDRLs in Norway for all considered examinations, although the doses from some individual Norwegian scanners were below the Canadian LDRLs. The Canadian LDRLs were also below the Canadian national reference levels for all considered examinations. From the head scans completed in Norway, it was evident that the local reference level for the DLP is slightly higher than the Norwegian NDRL value, but the CTDIvol is marginally lower than the national standard. The LDRL values for thorax were higher than the NDRLs. One of the reasons for the difference between the determined LDRLs and NDRLs is that the national reference levels in Canada are older than the Norwegian NDRLs. While the Norwegian national data was collected in 2017 and published in 2018, 14 the Canadian national survey was conducted in 2014 and the results were published in 2016, 15 therefore Canadian NDRLs don’t reflect the latest development in CT technology that allows a reduction in dose. Furthermore, an explanation for why the local doses from Canada are lower than the local Norwegian doses is that there have been measures to reduce doses in Nova Scotia after a provincial survey in 2017. 11 This publication states that the results were distributed to the facilities and included dose reduction measures recommended to the hospital sites with the highest radiation exposures.
The comparison between individual scanners also demonstrated wide variations in the dose indicators confirmed by the statistical analysis (p < 0.5). The Canadian Siemens Definition Flash was installed in 2011, and the same model Norwegian scanner in 2012. However, the canadian scanner is producing lower doses than the Norwegian scanner for the considered examinations. All three scanning protocols are very similar with exception of quality reference mAs (tube current-time product/pitch), which is higher on the Norwegian scanner (Table 2). Siemens uses a quality reference mAs (tube current-time product/pitch) to establish the desired image noise level when automatic exposure control (AEC) is used. The AEC is a scanner feature that automatically adapts the x-ray tube current to the overall patient size to achieve a specified level of image quality.22,23 The lower quality reference mAs allowed reducing radiation dose even for larger patients. For instance, the patient group surveyed at the Canadian scanner has a higher mean thorax thickness of 25.2 cm, which is 23.2 cm in the group from the Norwegian Definition Flash. However, the radiation dose resulting from the thorax examination is 40% lower on the Canadian scanner (Figure 1(c) and (d)).
When investigating the different scanners in this study, it is apparent that even scanners under the same protocol vary in produced dose across the different examinations. As shown in Table 2, there are three different Siemens scanners under the same protocol at hospital # 2. These are the Somatom Force2020, Somatom Drive2016, and Somatom Flash2012 (Siemens Healthineers). The only variation in parameters listed in the protocols between these scanners is the iterative reconstruction (IR) used. The Force and Drive utilize Admire, while the Flash makes use of Safire which is the more dated algorithm of the two.
For the head examination, the CTDIvol and DLP values increased according to scanner age and version of IR with the lower dose corresponding to the newer scanners (Figure 1), as there are no considerable variations in the head size of adult patients and a fixed 120 kV is used. Unlike head CT examinations, the weight and thickness of the patients have a stronger impact on the dose received from other included body parts imaging. Therefore, for the thorax examination, the scanners use Care kV which has the advantage of automatically selecting the optimal kV settings to potentially save dose. 24 The abdomen and pelvis protocol makes use of SEMI kV which allows for a user-defined kV setting to be implemented that could result in different choices of kV for patients of the same weight.
In Canada, the two GE Optima 660 machines from hospital # 6 and hospital # 5, installed in 2012 and 2013, respectively, are the same model but they were still significantly different in doses for all examinations (Figures 1–3). This is due to the differences in the scanning protocols reflecting differences in clinical practices and preferences of the local imaging staff. The same applies to the three Norwegian scanners consisting of the Siemens Somatom Force models, installed in 2017 and 2019 at the hospital # 1, and in 2020 at hospital # 2. As expected, the collected doses reflected differences in the protocols implemented at each hospital. It should additionally be emphasized that hospital # 1 uses dual-energy (DE) on its Somatom scanners for the abdomen/pelvis examinations and dual-source (DS) acquisition for the thorax examinations, while hospital # 2 does not. This is most probably the reason for the dose differences between these two hospitals for both the thorax and abdomen/pelvis examinations.
A significant limitation of this study is the number of scanners included from Nova Scotia, Canada. Nova Scotia had four scanners surveyed, while Norway had eight. In order to make this study as accurate as possible, scanners of the same age and from the same manufacturer were included, therefore limiting the number of scanners available in Nova Scotia. Another limitation encountered was the number of conducted examinations with the standard protocol for abdomen and pelvis in 2021 on the Norwegian Canon Aquilion One2015 scanner. Therefore, to have a sample of 20 average patients, data dating back to October 2018 were collected. However, the protocols in 2021 were identical to the protocols in 2018 reducing the impact on the collected DRLs. The patient exclusion criteria were also limitations of this study. As it was indicated above, the patient height for the BMI calculation, and even the weight for thoracic imaging, were not part of the patient study on PACS in Canada and therefore could not be extracted for the retrospective data collection.
In conclusion, it was evident that the local DRLs in Norway were higher overall, and many exceeded the national and international determined DRLs, while Canadian LDRLs were below the NDRLs. When comparing the median doses from the same scanner manufacturer, or even the same model, the variation in dose values was evident in both counties, demonstrating the potential for protocol optimization.
Footnotes
Acknowledgments
The authors are grateful for help and assistance from the hospitals involved in this study, and the Norwegian Directorate for Higher Education and Skills for support which made this study possible.
Declaration of conflicting interests
The author(s) declared no potential conflicts of interest with respect to the research, authorship, and/or publication of this article.
Funding
The author(s) received no financial support for the research, authorship, and/or publication of this article.