
Abstract
Background
Magnetic Resonance Imaging (MRI) is considered a vital in depicting multiple sclerosis (MS) lesions. Current studies demonstrate that proton density (PD) weighted images (WI) are superior to T2 WI in detecting MS lesions (plaques) in the spinal cord.
Purpose
To evaluate the diagnostic value of filtered fused PD/T2 weighted images in detecting cervical spinal cord MS lesions.
Material and Methods
In this retrospective study, we selected a sample size of 50 MS patients. Using contrast limited adaptive histogram equalization (CLAHE), a digital image processing filter was used on the (PD/T2) fused images. The produced images were inspected and compared to the original PD images by two experienced neuroradiologists using interobserver and intraobserver. An ROI analysis was also performed on the processed and original PD images.
Results
The repeatability measurement of the match between the two examinations was highly consistent for both neuroradiologists. The repeatability for both neuroradiologists was 96.05%, and the error measurement was 3.95%. The reproducibility measurement of the neuroradiologist’s evaluation shows that the processed images could help to identify lesions better [excellent (84.87%)] than PD images [good (61.19%)]. ROIs analysis was performed on 113 MS lesions and normal areas in different images within the sample size. It revealed an enhanced ratio of 2.2 between MS lesions and normal spinal cord tissue in processed fused images compared to 1.34 in PD images.
Conclusion
The processed images of the fused images (PD/T2) have superior diagnostic sensitivity for MS lesions in the cervical spine than PD images alone.
Keywords
Introduction
Multiple Sclerosis (MS) is a chronic demyelinating disorder of the white matter of the central nervous system (CNS) that could typically progresses to neurological disabilities. 1 It is characterized by damage to the insulating coverings of nerve cells in the brain and spinal cord. It usually begins with episodic attacks of neurological symptoms and then progresses. It mainly affects young adults aged 15 to 50 (average age of 30). Multiple Sclerosis lesions can appear in any part of the central nervous system that is serviced by myelinated neurons, including “the central white matter, the brain stem, and the spinal cord.”2,3
Magnetic resonance imaging (MRI) is the gold standard imaging method for detecting demyelinating lesions. 4 The value of MRI in assessing multiple sclerosis (MS) goes far beyond diagnosis. In terms of predicting disease severity or prognosis, MRI has added significant value to the evaluation of MS. 5 Magnetic resonance imaging scans can assist MS patients and monitor disease progression regularly. 6
Conventional MRI sequences are highly sensitive to the presence of white matter disease and can evaluate the dissemination of MS lesions in space and time. The conventional MRI MS protocol consists of a set of widely available, well-characterized, and highly standardized MRI techniques that were first incorporated into diagnostic criteria with the International Panel of Experts' first set of guidelines, known as the “McDonald criteria” become a standard reference for MRI protocol for MS. 7
A conventional MRI protocol includes numerous sequences, such as the PD-weighted imaging sequence, which measures the number of protons per unit volume in the tissue. In addition to PD, T2-weighted image sequences that aid in pathology evaluation and Fluid Attenuated Inversion Recovery (FLAIR) sequences that suppresses cerebrospinal fluid (CSF) in T2-weighted images are utilized. 8 Many MRI techniques have been developed to improve the detection of MS lesions and monitor disease progression in the CNS, 5 including double inversion recovery (DIR), 9 phase-sensitive inversion recovery (PSIR), 10 diffusion-weighted imaging (DWI), diffusion tensor imaging (DTI), 11 and Magnetization Transfer (MT). 12
Current studies indicate that the PD-weighted image is superior to the T2-weighted image in detecting MS lesions (plaques) in the spinal cord.13,14 In the standard MS spinal cord imaging protocol, the Consortium of MS Centers Consensus (CMSC) guidelines recommend 2D sagittal PD or STIR weighted sequences. 15 Proton density fast spin-echo imaging is superior to T2 fast spin-echo MR imaging for the detection of cervical cord MS lesions. Proton density fast spin-echo shows cord lesions in patients whom T2 fast spin-echo findings appear normal.14,16
Single-echo or dual-echo techniques can be used to generate PD-weighted images. In dual-echo, two echoes are generated from the same 90-degree radio-frequency excitation pulse, the first echo is developed with a first 180-degree refocusing radiofrequency (RF) pulse and generates PD images with a short TE (TE1), and the second echo is developed by a second 180-degree refocusing RF pulse and generates T2 images with long TE (TE2), (Figure 1). Timing diagram for standard dual-echo spin-echo sequence.
Dual spin-echo is particularly beneficial for two reasons. First, it acquires two echoes with differing echo times within a single TR, allowing it to use the lengthening of TR wisely. Second, it is ideal for image fusion since there is no possibility of patient movement between the two acquisitions, preventing misregistration between the two generated images.17,18
Image contrast enhancement improves the appearance of an image by raising the dominance of specific features or reducing the ambiguity between different regions of the image. Image enhancement techniques are a set of approaches that aim to improve the visual quality of an image or post-process it into a format that is best suited for human or computer analysis. 19
The basic goal of image enhancement is to increase the consistency of the image to improve its visual appearance. This will help the radiologist better differentiate image details and detect any abnormalities. Image enhancement methods commonly highlight specific features of interest in a picture. 20
Image enhancement techniques encompass a variety of methods for improving the visual appearance of images, including background noise reduction, enhancing image contrast, de-blurring, smoothing, sharpening, and edge enhancement, among others. The most common image enhancement techniques used in medical imaging are noise reduction, edge enhancement, and contrast enhancement.
Histogram equalization (HE) is a popular image processing technique. 21 It is a computer image processing technique used to improve image contrast. It accomplishes this by spreading the intensities of an image pixel based on the entire image information. 22 It employs the cumulative density function (CDF) to flatten the input image’s histogram and stretch the dynamic range of gray levels. 21
The histogram of an image reflects the relative frequency of gray-level occurrences to maintain the input image’s mean brightness. The HE method remaps the gray levels of an input image by reassigning pixel intensity values to produce a consistent intensity distribution. 21
Adaptive Histogram Equalization (AHE) is a computer image processing technique that enhances image contrast. The adaptive approach creates each histogram of a sub-image to redistribute the brightness values of the images. Therefore, AHE is adapted to increase local contrast and display more details in an image. 23 Contrast Limited Adaptive Histogram Equalization (CLAHE) better adapts the AHE process. Because a narrow range of pixels is mapped to an entire visualization range, the AHE approach has the practical drawback of causing over-amplifying noise in homogeneous regions of an image. 21 CLAHE was developed to prevent inhomogeneous noise regions from being over-amplified. CLAHE helps to reduce image noise distortion. This technique is also useful for video broadcasting, which requires a high degree of brightness. CLAHE increases the brightness level to a particular range, allowing you to compare distinct image areas. Contrast Limited Adaptive Histogram Equalization has the advantages of being simple to computation, producing good results in specific local areas of the image. Contrast Limited Adaptive Histogram Equalization makes less noise and can avoid brightness saturation, which is a common problem with histogram equalization. 21
Proton density is not always sensitive enough to detect all types of demyelinating plaques with varying degrees of parenchymal destruction. 18 The purpose of our study is evaluating the fused (PD/T2) weighted image processed with well-designed filter known as CLAHE in detecting more spinal cord MS lesions than proton density images or T2 images alone.24,25
Materials and methods
Demographics of patients with multiple sclerosis (n = 50).

Note: Data are shown as mean ±SD.
The cervical MRI MS protocol includes sagittal and axial PD/T2 and sagittal and axial pre-contrast and post-contrast. For the sagittal dual-echo fast spin-echo sequence, the parameters used were the following: repetition time (TR) of 3000 ms, an echo time TE1/TE2 of 12/124 ms, Echo Train length (ETL) of 24, a field of view (FOV) of 250x250 mm2, slice thickness/spacing of 3/0.3 mm, an image matrix of 320/224, and two signal averages.
Digital image processing and analysis in Java (ImageJ) version 1.53 were used in digital image processing.
26
ImageJ performs arithmetic and logical operations between two images (image calculator (Max and Difference).
27
It is also used to apply a contrast-limited adaptive histogram equalization (CLAHE) filter to enhance the local contrast of an image. The method for CLAHE on ImageJ has three parameters: block size, which is the size of the local region around a pixel for which the histogram is equalized; histogram bins, which is the number of histogram bins used for histogram equalization; and max slope, which is used to limit the contrast stretch in the intensity transfer function. To optimize the image contrast, those parameters were selected to be 127, 256, and 3.00, respectively. Figure 2 shows the processing steps followed to get the final filtered images. Schematic diagrams of image processing steps.
We compared the processed images to the original proton density images after obtaining the processed image, which is [(maximum signal of fused (PD+T2) image + CLAHE filter)-PD image].
The images were evaluated using two methods: the first was by measuring the interobserver and intraobserver agreement of two experienced neuroradiologists “7 years’ experience for each reviewer,” 28 and the second method was based on the results of ROI (Region of interest) analysis.
We designed a questionnaire for neuroradiologists to evaluate and compare the quality of the processed and native images. The reviewers were requested to review images and complete a questionnaire with two questions; the first was “Is there MS lesion in the cervical spine” (Yes or No), and the second question was, “how clear is the appearance of the MS lesion in comparison to the spinal cord” (1. Poor; 2. Good; 3. Very Good; and 4. Excellent). The scan and patient information were anonymized, so 100 images were displayed. After rearranging the images in the same order, the same process was repeated with both reviewers. We use classical percentage method to compare grading of each reviewer intra-observer and inter-observer.
The ROI analysis was used in the second method of evaluation. It was done with the ImageJ program (version: ImageJ 1.53).
29
The image was subjected to two ROI analyses: one was selected to be in the middle of the lesion, and the other ROI was selected from the adjacent normal spinal cord area, Figure 3. ROI selection, comparison of the ROI areas on the MS lesion (a) and normal cord tissues, (b) of the proton density image compared to ROIs on the MS lesions, (c) and normal cord tissues, and (d) on the processed image. MS: multiple sclerosis.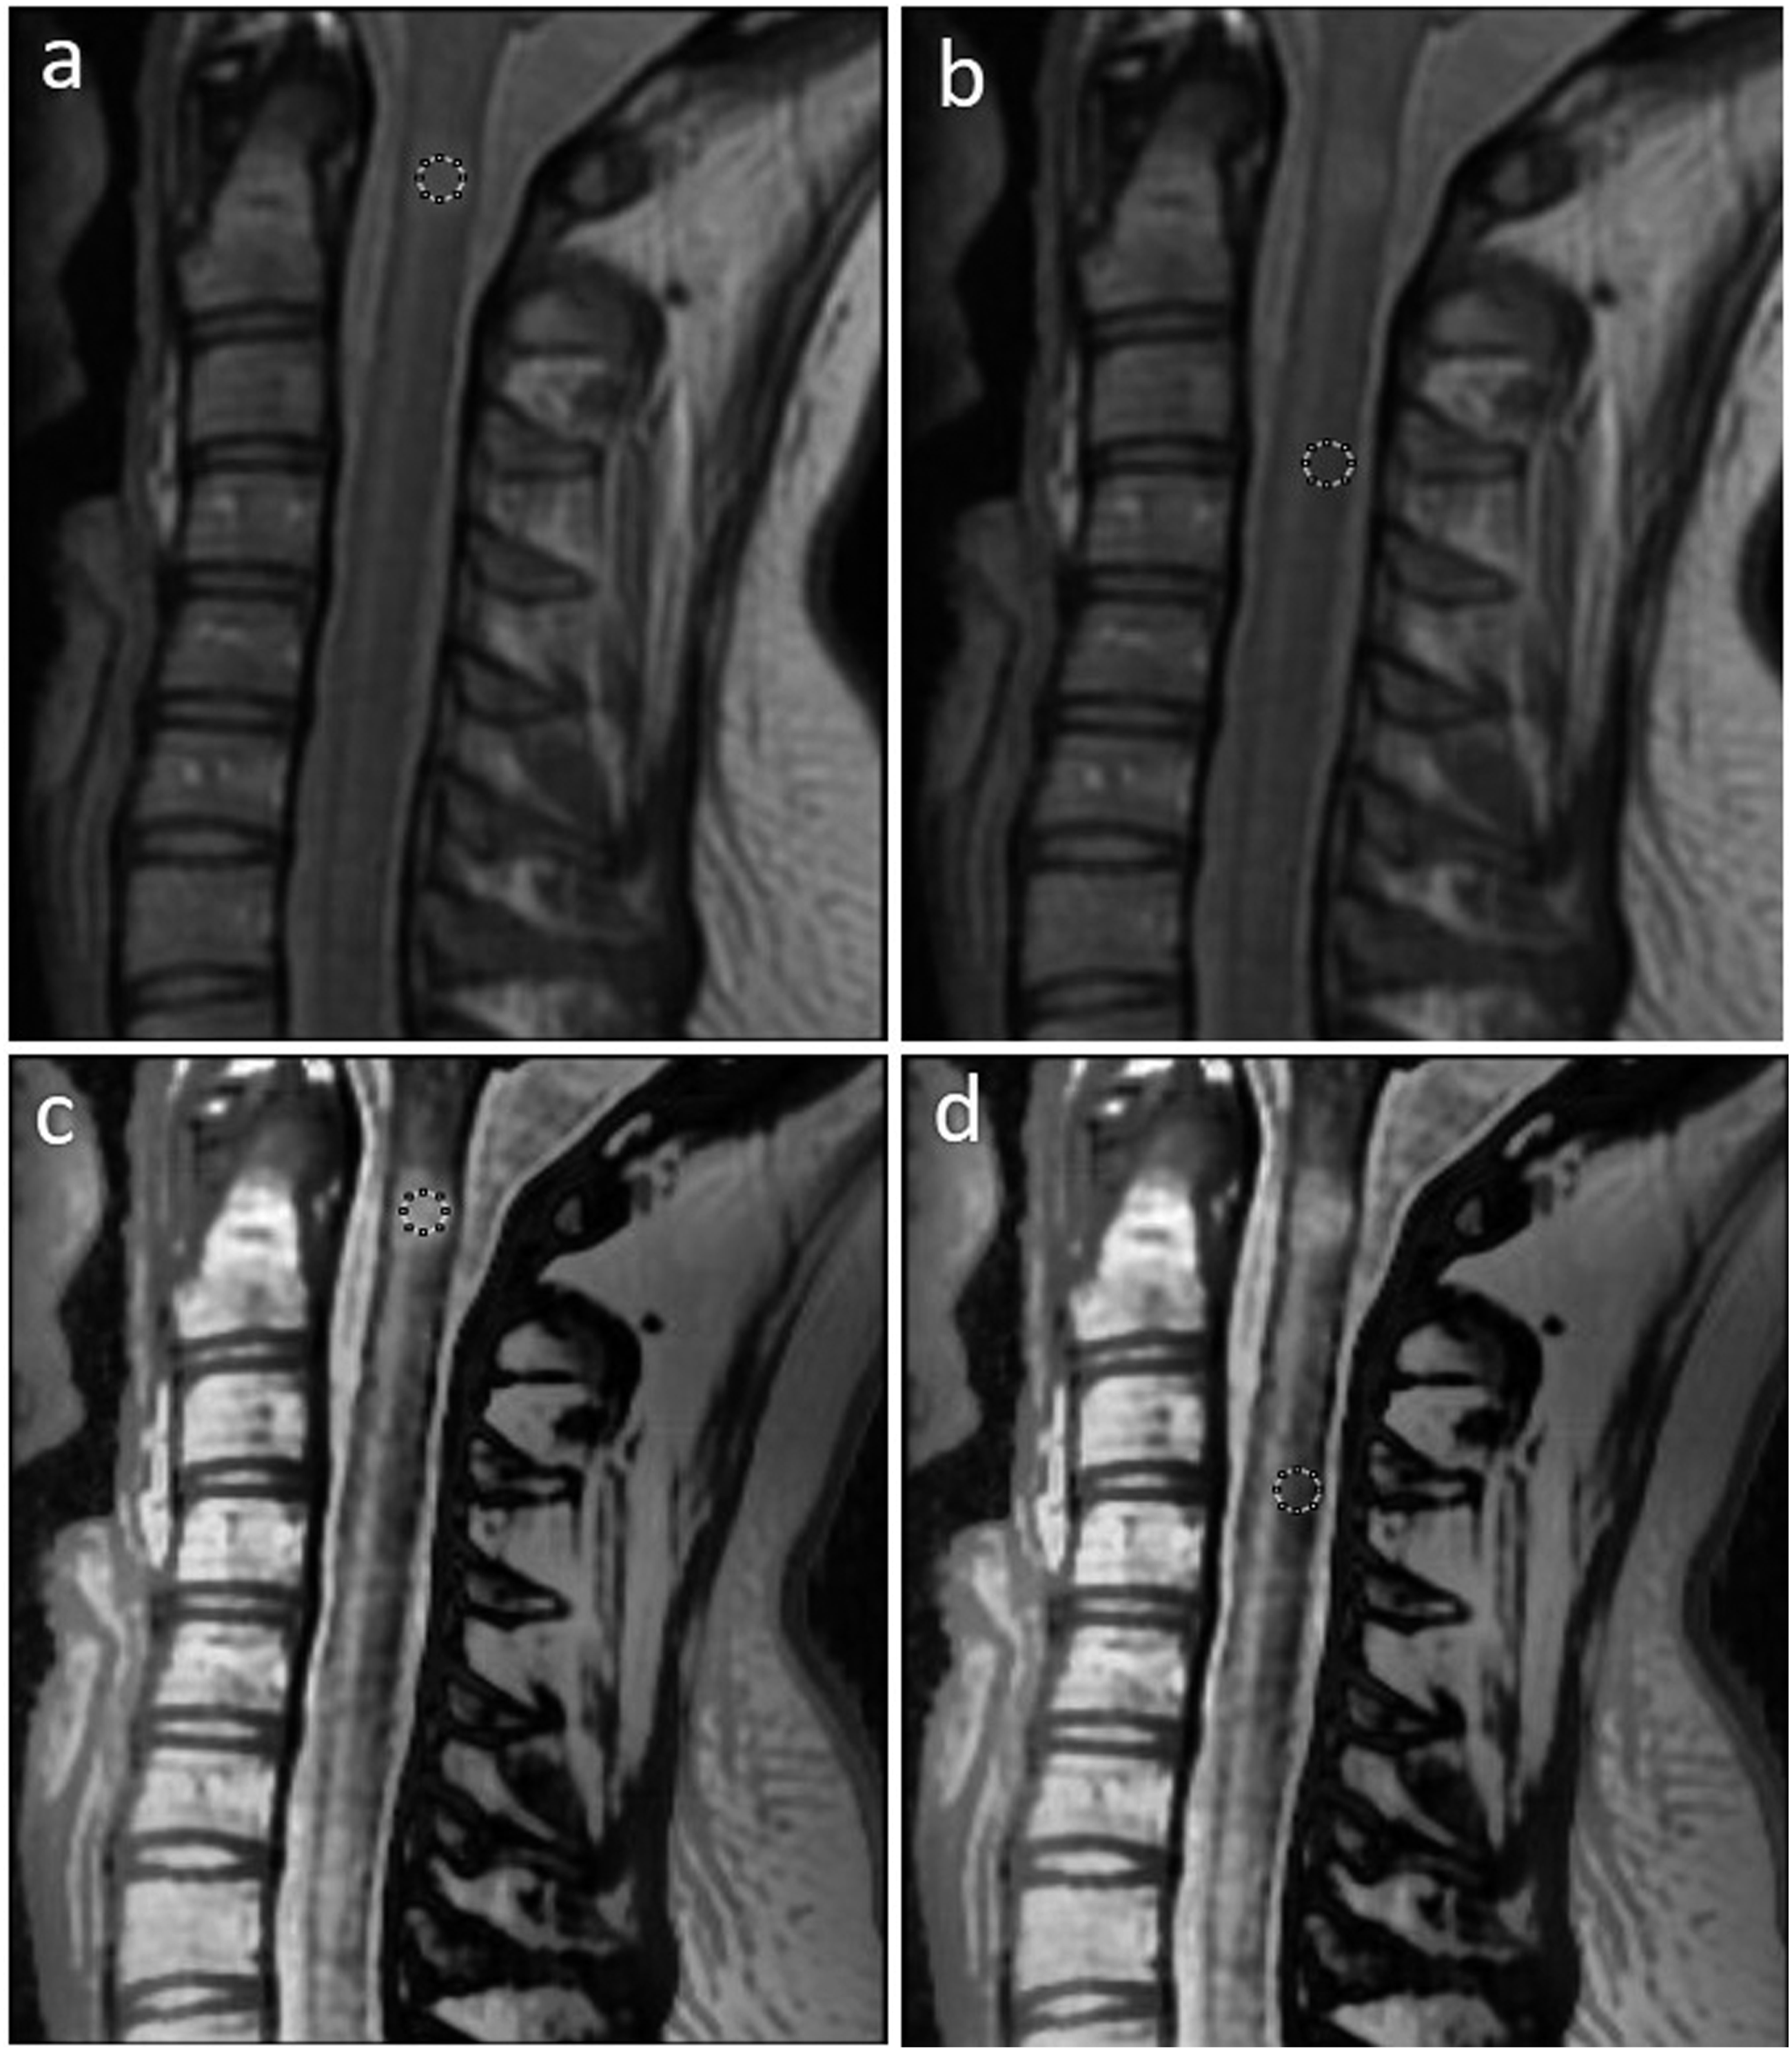
The analysis was carried out using Microsoft Office Professional Plus Excel (version. 2016) and SPSS software (IBM Corp. Released 2013, IBM SPSS Statistics for Windows, Version 22.0. Armonk, NY: IBM Corp.). The ROI statistics include the area of the ROI, mean grey value, standard deviation, and integrated density. The mean ratio between the ROI of the processed image and the ROI of the PD image was also calculated.
Results
The sample size was set at 50 patients (8 cases normal, 3 cases excluded due to motion artifact, and one case diagnosed as not MS).Table 1 shows demographic data of MS patients.
The first evaluation resulted in the following for reviewer I: In PD images, 2.62% of the lesions had poor appearance, and 97.37% had an excellent appearance. In T2-PD filtered images, 2.63% had a good impression, 2.63% had a very good appearance, and 94.74% had an excellent appearance. After the rearrangement of the cases for the first reviewer, the results showed that 100% of the lesions were classified as having a good appearance in PD images, compared to 2.63% having a good appearance and 97.37% having an excellent appearance in the fused T2-PD filtered images.
Comparison between lesions appearance from the two rounds of the two reviewers’ evaluation.

PD: proton density.
Reproducibility measurement and matching the Evaluation of the Two Neuroradiologists.

PD: proton density.
Figure 4 depicts the reproducibility measurement of the match between the neuroradiologist’s evaluations, revealing that the PD image evaluation was (None (3.29%), poor (7.23%), good (61.19%), very good (15.13%), and excellent (13.16%)). In contrast, the evaluation of the processed image was (none (3.29%), good (2.63%), very good (9.21%), and excellent (84.87%)). Chart of reproducibility measurement of the matching between the neuroradiologists evaluations for proton density and processed images.
ROI analysis results for signal intensity ratio values of lesion/normal in proton density images compared to corresponding processed images.

Region of interest (ROI) analysis
Discussion
Magnetic resonance imaging (MRI) is a medical imaging method that produces high-resolution images of the inside of the body. Each MRI test includes several sequences, such as (the PD-weighted image sequence, which measures how many protons per unit volume are in the tissue, and the T2-weighted image sequence, which aids in pathology evaluation. 8 Many centers include PD and T2 arrangements in their MS MRI scanning protocol, either separately or using dual-echo acquisition. The series used in this study, dual-echo spin-echo, has the benefit of being less sensitive to patient movements between the two acquisitions.16,17
Image contrast enhancement improves the appearance of an image by boosting the dominance of specific features or decreasing the uncertainty between different regions of the picture. Histogram Equalization (HE) is a commonly used technique for enhancing contrast. The purpose of this study was to compare the contribution of employing the enhancement filters on the fused image (PD and T2) to improve and highlight spinal cord lesion detection in multiple sclerosis to native proton density imaging.
Lesions varied in appearance from patient to patient, which might be attributed to patient size, exam quality, patient cooperation, nature of the lesion, and its location within the spinal cord. Two experienced neuroradiologists reviewed all the images, and the neuroradiologists evaluated two hundred anonymized images (one hundred processed images and one hundred PD images). The reproducibility measurement of the neuroradiologist evaluation demonstrates that the processed images assisted the neuroradiologist in better identifying MS lesions. Eighty-four percent of the lesions had an excellent appearance in the PD images compared to 13.16%.
One hundred thirteen ROI analysis showed that the mean value of the ratio of the ROIs signal intensities of the processed images was 2.20 compared to 1.34 for those obtained from PD images. The lesions' average improvement to the normal signal intensity ratio was 60.9%.
The repeatability and reproducibility of neuroradiologist’s evaluation and measurement and ROI analysis showed that the processed image has more enhanced MS lesions than the PD image, Figure 5. A sagittal slice of a cervical spine magnetic resonance imaging scan for MS patient, PD image of the cervical spine (a), T2 image (b), and the processed image (c). In the processed image (c), MS lesions (white arrows) can be easily identified and differentiated from the normal spinal cord tissues compared to PD and T2 images. PD: proton density; MS: multiple sclerosis.
Gupta S. et al. 21 reported that “AHE improves the local contrast but tends to raise the noise level.” Contrast Limited Adaptive Histogram Equalization improves this by boosting brightness to a specific range and making it easier to compare different areas of an image.” According to Vij, K. et al., 20 “Histogram processing is an effective method for image enhancement.” This study demonstrates that using the CLAHE filter compared to the fused T2/PD images provides higher diagnostic sensitivity for MS lesions in the cervical spinal cord than using the PD image alone. The advantage of using T2/PD images is that it improves CSF to cord contrast since CSF appears brighter in T2 than in PD images.
Dual echo spin-echo sequence has the advantage of being available in practically all MRI scanners and not requiring a lengthy scan duration. Another advantage of having the two echoes of PD and T2 acquired at the same excitation is that it helps to avoid patient movement between the two images during image fusion and expression. The processed images also have superior improved contrast between the CSF and spinal cord because the resultant image combines T2 and PD image contrast, as shown in Figure 6. A sagittal slice of a cervical spine magnetic resonance imaging scan for MS patient, PD image of the cervical spine (a), T2 image (b), and the processed image (c). The contrast between spinal cord lesion and CSF is better delineated in white arrows in the image (c). PD: proton density; MS: multiple sclerosis.
One of the limitations of this study was the small number of patients. Furthermore, the scans were limited to the field strength (1.5T). In the future, the processed image may be compared to other sequences employed in the cervical spine, such as double inversion recovery (DIR) and images acquired from 3T scanner.5,29,30
The presence of focal spinal cord lesions can help confirm a clinical diagnosis of MS or indicate if a clinically isolated condition would progress to definite MS. Quantification of disease activity is critical for assessing therapy efficacy in MS patients. Using filtered PD/T2 fusion will help in improving the accuracy of MS lesions detection in the spinal cord, this can be very helpful in the diagnostic confidence if it is integrated in the reporting process. 31
In conclusion, this study evaluated the effectiveness of applying a post-processing filter on fused T2/PD images to enhance the appearance of MS lesions in MRI scans of the spinal cord. Two methods were used: the interobserver and intraobserver methods of two experienced neuroradiologists, and the second method based on ROI analysis. The processed images had superior diagnostic sensitivity for cervical spine cord MS lesions.
Footnotes
Acknowledgements
Authors thank the College of Applied Medical Sciences Research Center and Deanship of Scientific Research at King Saud University for support and providing resources. Author Khalid Obaid Alharbi acknowledges the Saudi Ministry of health for the Scholarship. The funders had no role in study design, data collection and analysis, decision to publish, or preparation of the manuscript.
Declaration of conflicting interests
The author(s) declared no potential conflicts of interest with respect to the research, authorship, and/or publication of this article.
Funding
The author(s) received no financial support for the research, authorship, and/or publication of this article.
Ethical approval
Data for all cervical spine MRI examinations performed in patients with multiple sclerosis at King Saud University’s medical city in Riyadh, Saudi Arabia, were collected retrospectively from January 2017 to December 2019. The study was approved by the institutional review board (Ref. No. 20/0956/IRB).