
Abstract
Prostate Magnetic Resonance Imaging (MRI) is increasingly being used in men with a clinical suspicion of prostate cancer (PCa). Performing prostate MRI without the use of an intravenous contrast (IV) agent in men with a clinical suspicion of PCa can lead to reduced MRI scan time. Enabling a large array of different medical providers (from mid-level to specialized radiologists) to evaluate and potentially report prostate MRI in men with a clinical suspicion of PCa with a high accuracy could be one way to enable wide adoption of prostate MRI in men with a clinical suspicion of PCa. The aim of this pictorial review is to provide an insight into acquisition, quality control and reporting of prostate MRI performed without IV contrast agent in men with a clinical suspicion of PCa, aimed specifically at radiologists starting reporting prostate MRI, urologists, urology/radiology residents and mid-level medical providers without experience in reporting prostate MRI. Free public access (http://petiv.utu.fi/improd/and http://petiv.utu.fi/multiimprod/) to complete datasets of 161 and 338 men is provided. The imaging datasets are accompanied by clinical, laboratory and histopathological findings. Several topics are simplified in order to provide a solid base for the development of skills needed for an unsupervised review and potential reporting of prostate MRI in men with a clinical suspicion of PCa. The current review represents the first step towards enabling a large array of different medical providers to review and report accurately prostate MRI performed without IV contrast agent in men with a clinical suspicion of PCa.
Keywords
Introduction
Prostate cancer (PCa) is characterized by a spectrum of aggressiveness that ranges from minimal clinical significance to highly aggressive disease. 1 Biopsy procedures as well as the treatments of prostate cancer are not devoid of short- and long-term complications and adverse effects.2,3 Thus, optimal risk stratification of men with a clinical suspicion of PCa is of utmost importance to limit unnecessary biopsies and treatment-related complications while appropriately detecting clinically significant PCa (csPCa), for example a commonly used definition of Gleason score >3+3/Gleason Grade Group >1. After decades of insufficient ability of prostate specific antigen (PSA) and systematic transrectal ultrasound (TRUS) biopsy for detecting csPCa, prostate Magnetic Resonance Imaging (MRI) and prostate MRI targeted biopsy are currently increasingly being used in men with a clinical suspicion of prostate cancer (PCa). Both AUA and EAU guidelines recommend the use of prostate MRI and targeted biopsy in biopsy-naive men as well as in men with prior negative prostate biopsy with a clinical suspicion of prostate cancer (PCa) (https://uroweb.org/guidelines/; https://www.auanet.org/guidelines).
Multiple trials 4 (PROMIS, 05/2012–10/2015 5 ; PRECISION, 02/2016–08/2017 6 and MRI-FIRST, 07/2015–08/2016 7 ) demonstrated that multiparametric MRI performed using intravenous contrast agents as a triage test could reduce unnecessary biopsies, over-detection of insignificant PCa and increase detection of csPCa compared to the standard systematic biopsy pathway. However, adopting multiparametric MRI as triage pathway for all men with a clinical suspicion of PCa will require a lot of imaging time and radiology resources. The associated costs and ensuring MRI availability to all men with a clinical suspicion of PCa are major issues of concern. Several single (IMPROD, 03/2013–02/2015 8 ; BIDOC, 10/2015–07/20179,10) and multicenter (MULTI-IMPROD, 02/2015–05/2017 11 ; STHLM3-MR trial 05/2016–05/2017, 12 ) trials as well retrospective studies 13 demonstrated similar findings for prostate MRI performed without an intravenous contrast agent.
Currently, prostate MRI in routine clinical practice is reported by radiologists. However, the use of an optimized prostate MRI acquisition and reconstruction protocol at 1.5 Tesla (T) or 3 T with continuous quality control and performance measures could hypothetically lead to a wider array of prostate MRI readers and ultimately lead to reduction of cost associated with wide-spread adoption of prostate MRI in men with a clinical suspicion of PCa. Enabling urologists and mid-level medical providers such as dedicated prostate MRI trained physician assistants to report prostate MRI could potentially lead to a cost reduction and population-based application of prostate MRI in men with a clinical suspicion of PCa. However, this is purely hypothetically and a robust evidence to support cost effectiveness of prostate MRI reported by and MRI targeted biopsy performed by dedicated prostate MRI trained physician assistants remains to be explored.
The aim of this review assay is to provide an insight into the reporting of prostate MRI performed without an intravenous contrast agent in men with a clinical suspicion of PCa. Specifically, this pictorial review article with free public access to full prostate MRI datasets is aimed at radiologist starting to report prostate MRI, radiology residents, urologists, urology residents and mid-level medical providers such as physician assistants without experience in reporting prostate MRI. Several topics will be simplified and geared towards this audience in order to provide a solid base for development of skills needed for an evaluation and reporting of prostate MRI in men with a clinical suspicion of PCa. After reading this pictorial assay, the readers should gain knowledge in acquisition, quality control and reporting of prostate MRI performed without an intravenous contrast agent in men with a clinical suspicion of PCa.
Where to start: access to prostate MRI acquisition protocol and imaging datasets
Application of prostate MRI in the diagnostic pipeline for csPCa starts with high quality prostate MRI acquisition and reconstruction protocol. Using high quality prostate MRI is of utmost importance especially for less experienced readers who are the target audience of this pictorial review. Current clinical MRI scanners provide very homogeneous magnetic field with high gradient performance. Thus, end-users can obtain high quality prostate MRI with a wide range of different MRI scanners from different MRI vendors. The current review article provides access to IMPROD bpMRI protocol which was an independent and a parallel development to the European Society of Urogenital Radiology and PI-RADs guidelines since the development put strong emphasis on MRI physics.14–17 The IMPROD bpMRI (Figure 1) protocol was developed in 2012–2013 before the start of the IMPROD trial (NCT01864135) and free public access to the imaging datasets and protocol is provided at http://petiv.utu.fi/improd/and http://petiv.utu.fi/multiimprod Teaching point - Example of all sequences acquired using a routine mid-to lower end 1.5 Tesla MRI scanner in scan time under 15 min (without shimming and calibration): IMPROD bpMRI consists of localizer, sagittal T2-weighted imaging (T2W Sag), axial T2-weighted imaging (T2W Axial) and three separate Diffusion Weighted Imaging (DWI5b500, DWI2b1500, DWI2b2000) acquisitions. Shown images represent imaging data sets of IMPROD study number 99, all images available at http://petiv.utu.fi/improd/.
Basics of MRI physics with emphasis on prostate MRI
Magnetic resonance imaging uses radiofrequency energy (pulse) emitted by the RF coil to generate a magnetic field with subsequent excitation and relaxation processes. Details are well beyond the scope of the current review. Briefly, ‘most common’ (hydrogen proton) MRI works mainly because of hydrogen protons, which are placed in an external static magnetic field, are subjected to a turning force (torque), causing them to generate their own small magnetic field, or magnetic moment. Multiple different tissue contrasts can be generated. Most commonly used for prostate images are: T2-weighted images and T1-weighted images (Figures 2 and 3). Teaching point - Normal zonal anatomy: Axial T2-weighted, sagittal T2-weighted and transversal T1-weighted images of a 67-year-old man with a PSA value of 4.1 ng/mL. In this cross-section the normal PZ has a high signal intensity and the central gland has (central and transition zone) an intermixed signal intensity with presence of benign prostatic hyperplasia. No zonal anatomy is visible on the T1-weighted image (C). Axial images were acquired with no image tilt. Teaching point - Prostate cancer in peripheral zone: Transversal and sagittal T2-weighted images from the same 67-year-old man as in Figure 1. In this cross-section a low-signal-intensity lesion, indicated by the arrow, is present in the left peripheral zone at the level of the apex. The lesion was confirmed to be Gleason score 3+4 prostate cancer at targeted biopsy.

T2-weighted images and T1-weighted images: Anatomic magnetic resonance imaging of the prostate
T2-weighted images enable to depict prostate zonal anatomy (Figure 2). The normal peripheral zone has homogeneous high signal intensity on T2-weighted images in older men at least partly due to its relatively high-water content. However, normal peripheral zone in younger men can have diffuse intermediate to low signal intensity on T2-weighted images so it is important not to confuse it with a prostate cancer. The central portion of the prostate is called the central gland and consists of the central zone and transition zone; both have a lower signal intensity compared to the peripheral zone and a heterogeneous signal intensity at least partly due to its stroma-rich composition (Figure 2). Central gland, consisting of central zone and transition zone, is separated from the peripheral zone by a hypointense ‘pseudocapsule’. The neurovascular bundles are predominantly located posterolaterally to the ‘true’ outer prostate capsule at about the 5- and 7-o’clock positions on an axial images. The seminal vesicles are hyperintense on T2-weighted images and appear as tubular structures visible posteriorly to the base of the prostate, degree of distension varies based on amount of stored fluid. However, seminal vesicles can be hypointense on T2-weighted if they contain, for example, blood products.
No zonal anatomy can usually be seen on T1-weighted images. T1-weighted images are useful for the detection of blood products which can appear hyperintense in T1-weighted images depending on the type of blood products. T1-weighted images should be obtained if a patient has history of recent prostate biopsy. In general, prostate MRI should not be performed within 8–12 weeks following prostate biopsy to allow sufficient time for resolution of blood products related to prostate biopsy, although large variations in presence and resolution of post-biopsy blood products in individual patients have been reported.19–21 In the presence of blood products, prostate cancer can appear as hypointense area what some authors call as ‘haemorrhage exclusion sign’ which is defined as presence of a well-defined area of low signal intensity surrounded by areas of high signal intensity on T1-weighted images.
Diffusion weighted imaging
Diffusion behaviour, at the tissue level, can be measured using MRI and special gradient acquisition schemes; this method is called Diffusion weighted imaging (DWI). Essentially all clinical MRI scanners can acquire DWI. The strength of diffusion weighting is controlled by the so-called b-value (Figure 4). In simple terms, DWI consists of two parts (Figure 5): A. gradient scheme which controls b-values and B. read-out method which measures signal following radiofrequency excitation. Prostate DWI is most commonly acquired using a so-called echo planar (epi) read-out. This is a very fast approach but epi read-out is susceptible to artifacts caused for example by A. main magnetic field inhomogeneities which can be caused by air in the rectum (Figure 6) or hip prosthesis, B. insufficient fat suppression (Figure 7). These limitations can be overcome by different methods which are outside of scope of this review.
22
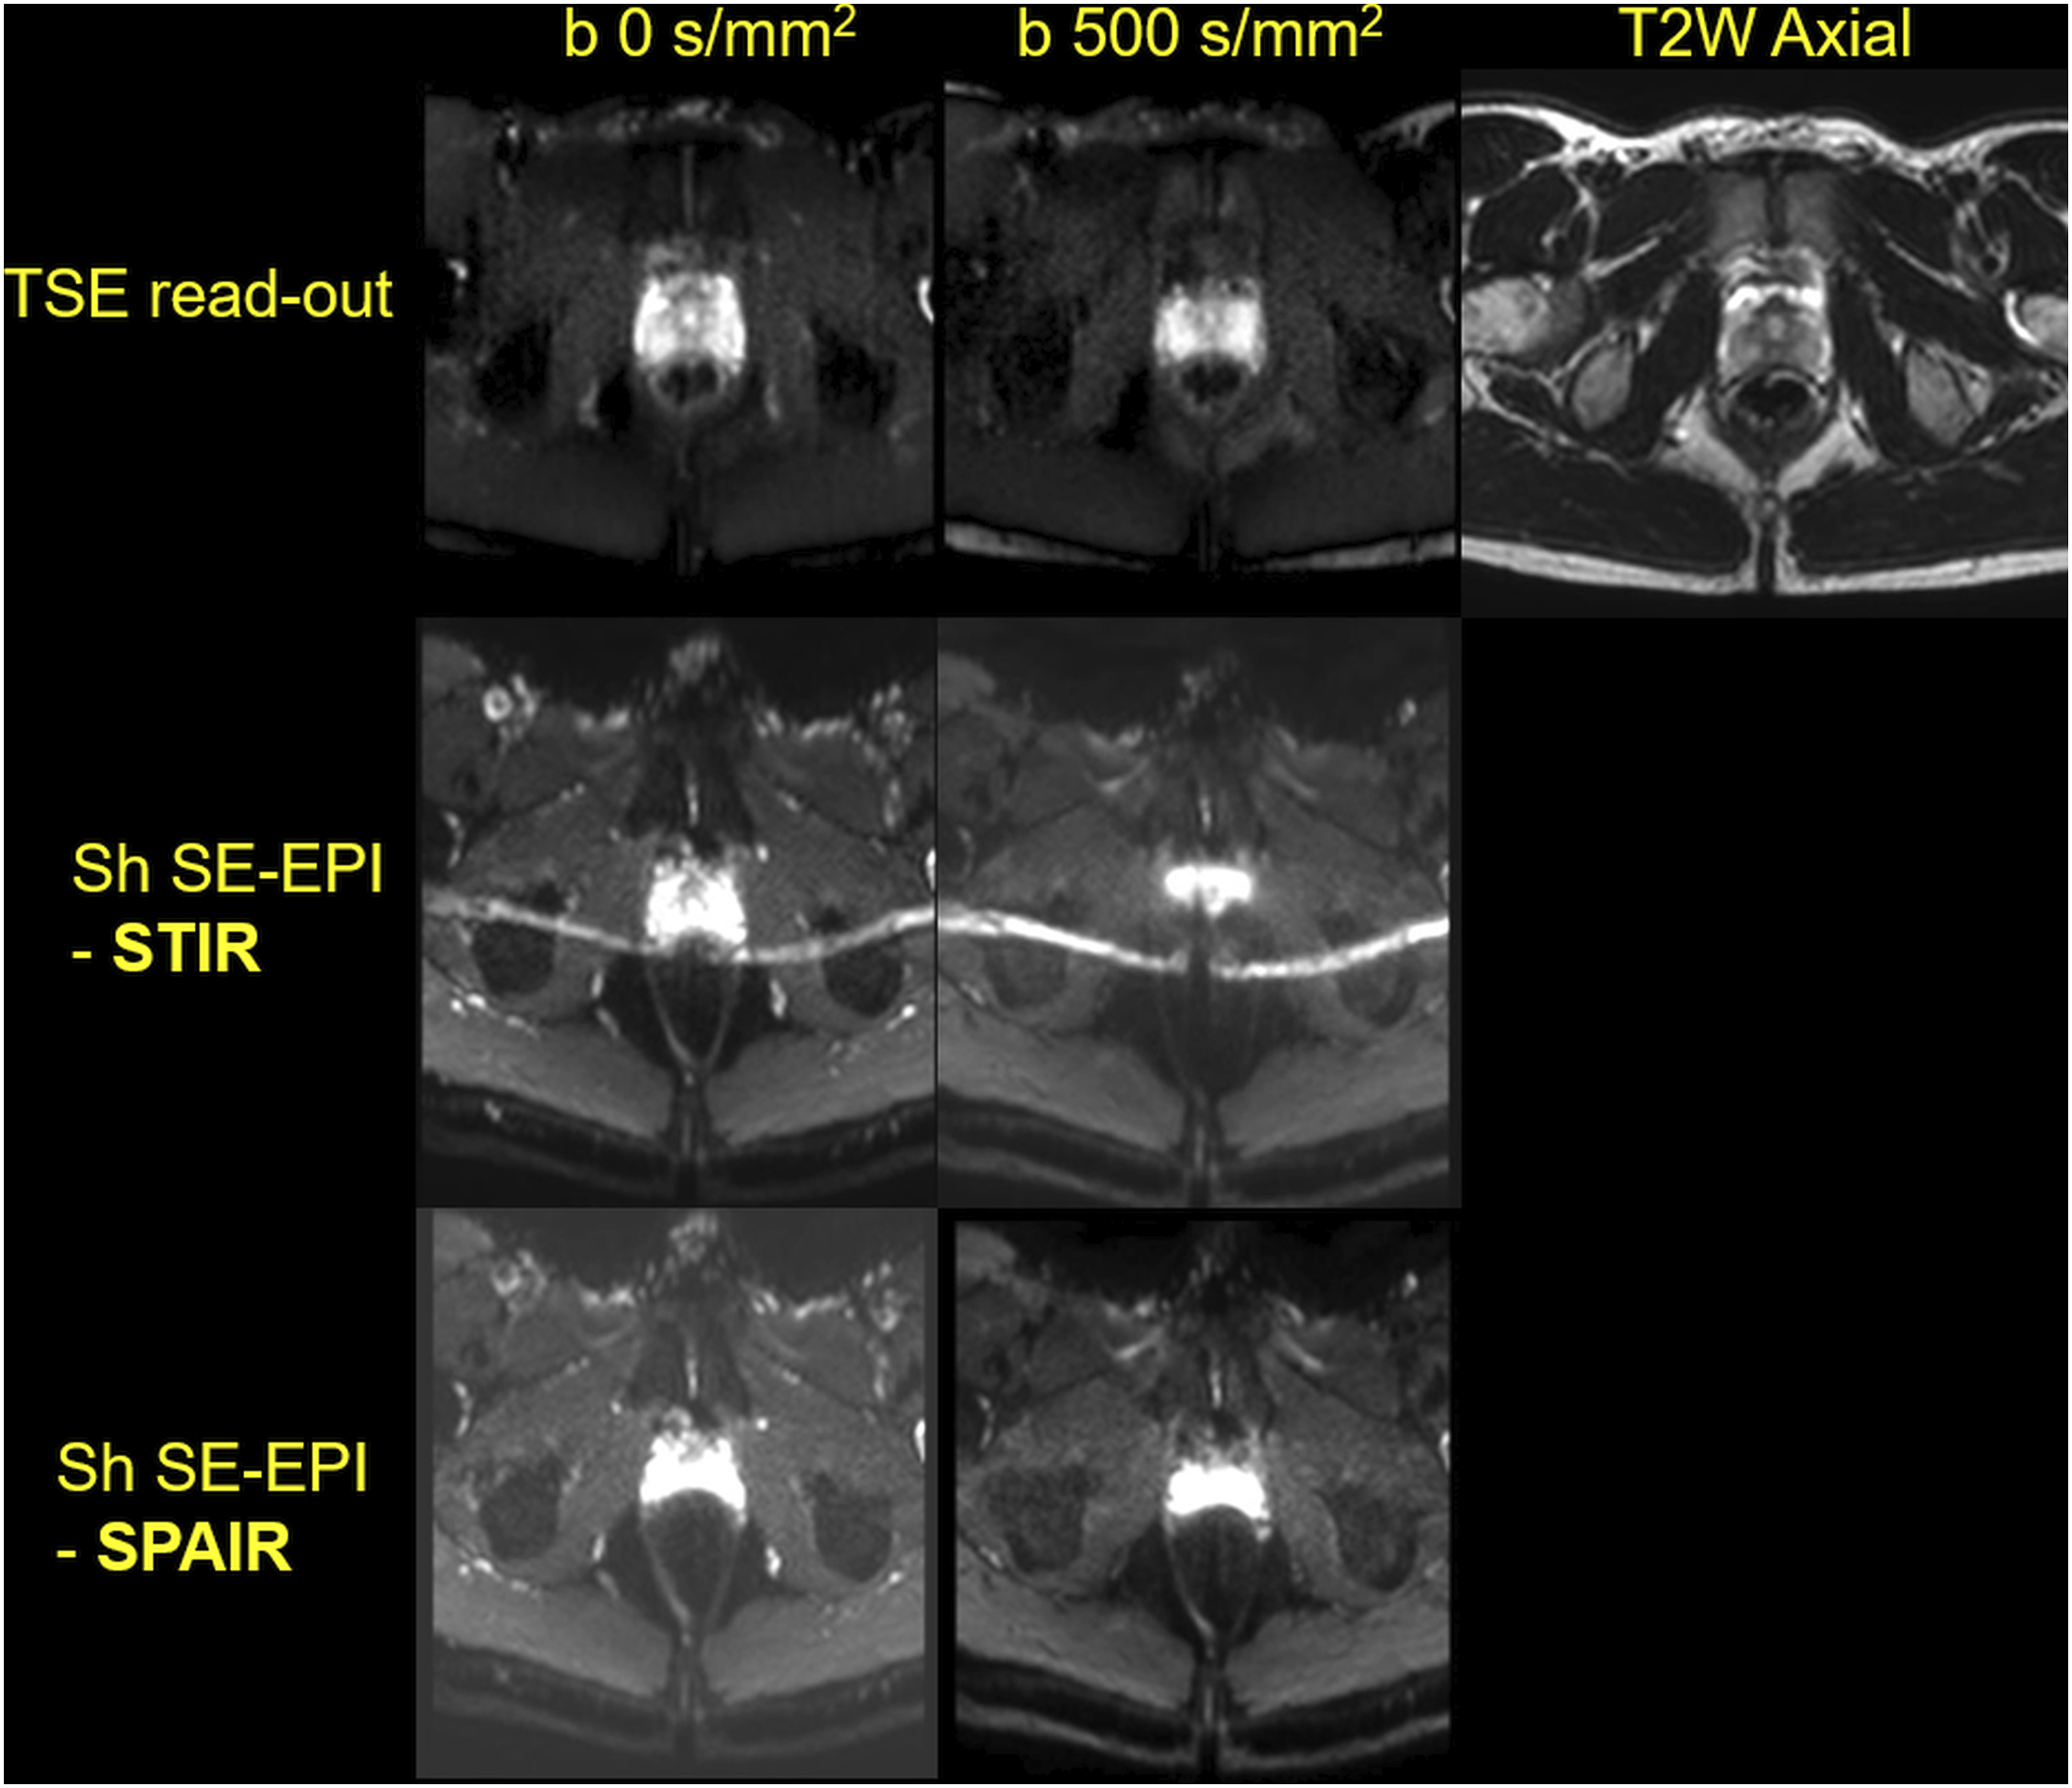
It is important to stress that, DWI acquisition methods which are more robust for main magnetic field inhomogeneities (e.g. caused by air in rectum), takes significantly more time to be acquired (Figure 8) and some of these methods are not available at older scanner hardware/software versions. Thus, the simplest approach is to ensure patients do not have rectal gas. A sample instruction on patient preparation before prostate MRI is provided at IMPROD and MULTI-IMPROD servers (http://petiv.utu.fi/improd/and http://petiv.utu.fi/multiimprod Teaching point - Each individual b-values in prostate DWI can provide different tissue contrast and signal-to-noise ratio, even images with the same b-values can look totally different, thus, attention to details of prostate MRI acquisition protocol is needed: Multiple different Diffusion Weighted Imaging b-values with corresponding whole mount prostatectomy section, axial T2-weighted images and axial T2-relaxation values maps of a patients with Gleason score 3+4 prostate cancer in the left transition zone. Teaching point - Quality of DWI images is impacting by both gradient scheme as well as read-out: Representative Diffusion Weighted Imaging acquisition scheme. Teaching point - Degree of prostate distortion due to susceptibility depends on the type of DWI acquisition protocol: Degree of susceptive artifacts depends on acquisition parameters: In this example, Diffusion Weighted Imaging of prostate was performed using echo planar (epi) read-out and a turbo spin echo (TSE) read-out. Due to rectal gas and resulting main magnetic field inhomogeneities, images acquired using epi read-out are severely distorted in contrast to images collected using TSE. Yellow arrow points to sharply delineated peripheral zone with a small müllerian duct cyst which cannot be seen on images acquired using epi read-out. Teaching point - Degree of imaging artefacts, such as fat shift, depends on the type of DWI acquisition protocol: Example of different fat suppression methods for prostate Diffusion Weighted Imaging: In the middle row (Sh SE-EPI STIR) bright line in the middle of images is due to insufficient fat suppression. Teaching point - Acquisition time for different DWI acquisition protocols can be very different: Comparison of Diffusion Weighted Imaging performed using a commonly used single-shot spin echo planar read-out (Single-shot SE-EPI) versus multi-shot spin echo planar read-out (Multi-shot SE-EPI) which is more robust for B0 (main magnetic field) variation, leading to less susceptibility artefacts, but can tends have longer acquisition time. Teaching point - Impact of rectal air on prostate DWI performed using echo planar read-out, rectal air related susceptibility artefacts can limit prostate cancer detection: Due to rectal air (part F), trace DWI of b-value 2000 s/mm2 acquired using echo planar read-out is distorted and these distortions are obscuring Gleason score 4+3 prostate cancer in the left peripheral zone (encircled in green on whole mount prostatectomy section – part I). Sagittal T2-weighted image collected during the same acquisition as the part F trace DWI of b-value 2000 s/mm2 demonstrate rectal air in contrast to sagittal T2-weighted image (part B) collected as part of IMPROD bpMRI protocol (parts B, C, D, H). Images in parts A, F, G and E were collected using on a different day and using a different MRI scanner than images in parts B, C, D, and H. Following collection of images in part F, patient was asked to go on toilette and new DWI images were collected (part G) which did clearly show PCa in the left peripheral zone without presence of distortions. Teaching point - Same b-values can provide different tissue contrast and signal to noise, thus, end user should be familiar with NMR physics and/or use protocol specifically developed for prostate MRI: Multiple different trace DWI images of two prostate cancer lesions (right peripheral zone Gleason score 3+4 and left peripheral zone 3+3 - whole mount prostatectomy section, part E). Trace DWI image in part C had the same b-value as image in part D, however, tissues contrast is different. The right peripheral zone Gleason score 3+4 lesion can be seen on part B, F and G while cannot be seen in part C (due low signal-to-noise ratio), part D (due to low prostate cancer to normal tissue contrast) and part H (due to low prostate cancer to normal tissue contrast). The small left peripheral zone Gleason score 3 + 3 lesion was not detected on any DWI trace images. Teaching point - Different appearance of prostate cancer depending on MRI acquisition protocol: Images in parts A, B, C, D and E were collected using a different MRI protocol and scanner than images in parts F, G, H and I. As can be seen, tissues contrast between prostate cancer (Gleason score 3+4 prostate cancer encircled on whole mount images, part J) is different even though the same b-values were collected. However, all images were collected at 3 T. Similar relative image windowing was applied between corresponding DWI trace images. The shown images in parts F, G, H and I are imaging data sets of IMPROD study number 90 and all MRI images available at http://petiv.utu.fi/improd/.


Each b-value of prostate DWI is collected individually and called trace DWI image (Figures 1 and 4). These trace DWI images are designated by their b-value which is commonly expressed in units of s/mm2. There are many different ways how these individual b-values can be post-processed. Details of those methods are we well beyond the scope of this manuscript and interested readers are referred elsewhere.16,23 The simplest and most commonly used method to post-process trace DWI images is monoexponential function which leads to generation of so-called Apparent Diffusion Confidents (ADC or ADCm) map (Figures 1 and 12).
24
Some authors prefer to use ADCm to specifically denote the Apparent Diffusion Coefficient maps calculated using monoexponential function since Apparent Diffusion Coefficient maps can be calculated using different mathematical function, for example, kurtosis (ADCk). Teaching point - Typical imaging appearance of prostate cancer in both peripheral zone and anterior fibromuscular stroma: Axial T2-weighted image (part A), trace DWI images (parts B, C, D) and corresponding Apparent Diffusion Confidents (ADC/ADCm) maps (parts F, G, H). The shown images represent imaging data sets of IMPROD study number 99. All MRI images are available at http://petiv.utu.fi/improd/ Additional images and videos of IMPROD study number 99 are presented in supporting material. Please note, an example of viewing hanging protocol for IMPROD bpMRI is shown in Figures 15–20 and 23–28.
How to view prostate MRI images
Prostate MRI images are commonly collected in Digital Imaging and Communications in Medicine (DICOM) file format and stored in a Picture Archiving and Communication System (PACS). There are a lot of different clinically used DICOM viewers as well as a large arrays of free DICOM viewers. Weasis (used at IMPROD and MULTI-IMPROD server) is one of many options for Windows users while Osirix for Mac OS users.
How to quality control prostate biparametric MRI: minimal requirements
Quality control of prostate MRI images is of pivotal importance and any radiologist, radiology resident, urologist, urology resident, mid-level medical providers should be able to understand differences between good quality MRI and bad quality MRI especially when performed within and outside her/his own institution. Unfortunately, PIRADs recommendation provides only a very limited general suggestion regarding MRI acquisition protocols and image quality can vary across different institutions. Quality control of prostate biparametric MRI could be performed in multiple different ways, a sample example is detailed below:
A. Make sure all MRI sequences were collected (Figure 1). A complete study should have the following: 1. T2-weighted images (axial and sagittal), 2. DWI, if IMPROD bpMRI protocol was used, then the following three DWI acquisitions: 2a. DWI with 5 b-values (0–500 s/mm2), 2b. DWI with 2 b-values (0–1500 s/mm2), 2c. DWI with 2 b-values (0–2000 s/mm2). If patient had prior history of prostate biopsy, a fast T1-weighted imaging should be performed as well. Fast T1-weighted imaging performed using volume interpolated gradient echo can be added to routine IMPROD bpMRI protocol (Figure 1) to enable detection of blood products. T1-weighted sequences can be acquired in under 10 s covering whole prostate. 25 Thus, this is well-invested time in men with prior history of prostate biopsy.
B. Review all individual trace DWI images. Routinely clinical MRI scanners calculate ADC/ADCm map automatically but a person reading prostate MRI cannot blindly rely on ADC/ADCm maps. ADC/ADCm maps are as good as individual trace DWI images. Thus, the person reading prostate MRI needs to ensure the following: 1. Each individual trace DWI image has sufficient signal-to-noise (e.g. part C in Figure 10 has too low signal-to-noise), 2. Compare prostate shape on each axial individual trace DWI image with axial T2-weighted images – if axial trace DWI images are distorted it suggests the presence of susceptibility artifacts if DWI was performed using an echo planar read-out, for example, part F of Figure 9 demonstrates rectal distension with distortions of prostate shape. If individual trace DWI images are of low quality, calculated ADC/ADCm maps will be of low quality as well. Since ADC/ADCm maps calculation commonly takes into account all acquired trace DWI data, it is important to review each individual trace DWI series to ensure good data quality.
How to read prostate biparametric MRI
Each readers of prostate MRI can create her/his own systems and search pattern. Below is presented a standard way to view prostate MRI images: 1. Create 2 × 2 image window matrix 2. Perform quality control of data as stated in ‘How to quality control prostate biparametric MRI: minimal requirements’. 3. If T1-weighted images were collected, review those images first to ensure there are no haemorrhage related products which, depending on timing, would appear as T1 hyperintense areas. 4. Once T1-weighted images have been reviewed, place axial T2-weighted images in the upper left-hand corner, ADC/ADCm of first IMPROD bpMRI DWI, DWI5b500, in the upper right-hand corner and in the lower corners place the trace DWI images of b-values 1500 and 2000 s/mm2, respectively (Figure 13). Some DICOM Viewer use image sync between series, when reviewing images first, disable this feature since prostate can move in cranio-caudal direction and the use of image sync between series could be misleading. 5. Review DWI images of b-values 1500 and 2000 s/mm2 first. All high signal areas in these images need to be explained – there are four basic options: 1. PCa, 2. Artifact, 3. Benign Prostatic Hyperplasia, 4. Other rare benign conditions such as granulomatous prostatitis especially following Bacillus Calmette-Guérin (BCG) treatment. 6. Differentiate peripheral zone from central gland (transition zone and central zone). A simplified scheme is shown in Figure 14. Normal peripheral zone (PZ) has high signal intensity on T2-weighed images (Figures 2, 3 and 15) while central gland (transition zone and central zone) can have heterogeneous appearance related to BPH nodules (Figure 15). 7. Use/develop own and/or standardized reporting systems. It is important to communicate with all stakeholders in the diagnostic pipeline of csPCa to ensure that reporting system is well understood and provides the best diagnostic performance. One option is to use PIRADs version 2.1 systems in addition to other systems. In the current review, all findings are reported using PIRADs version 2.1 system as well as IMPROD bpMRI Likert scoring systems.
26
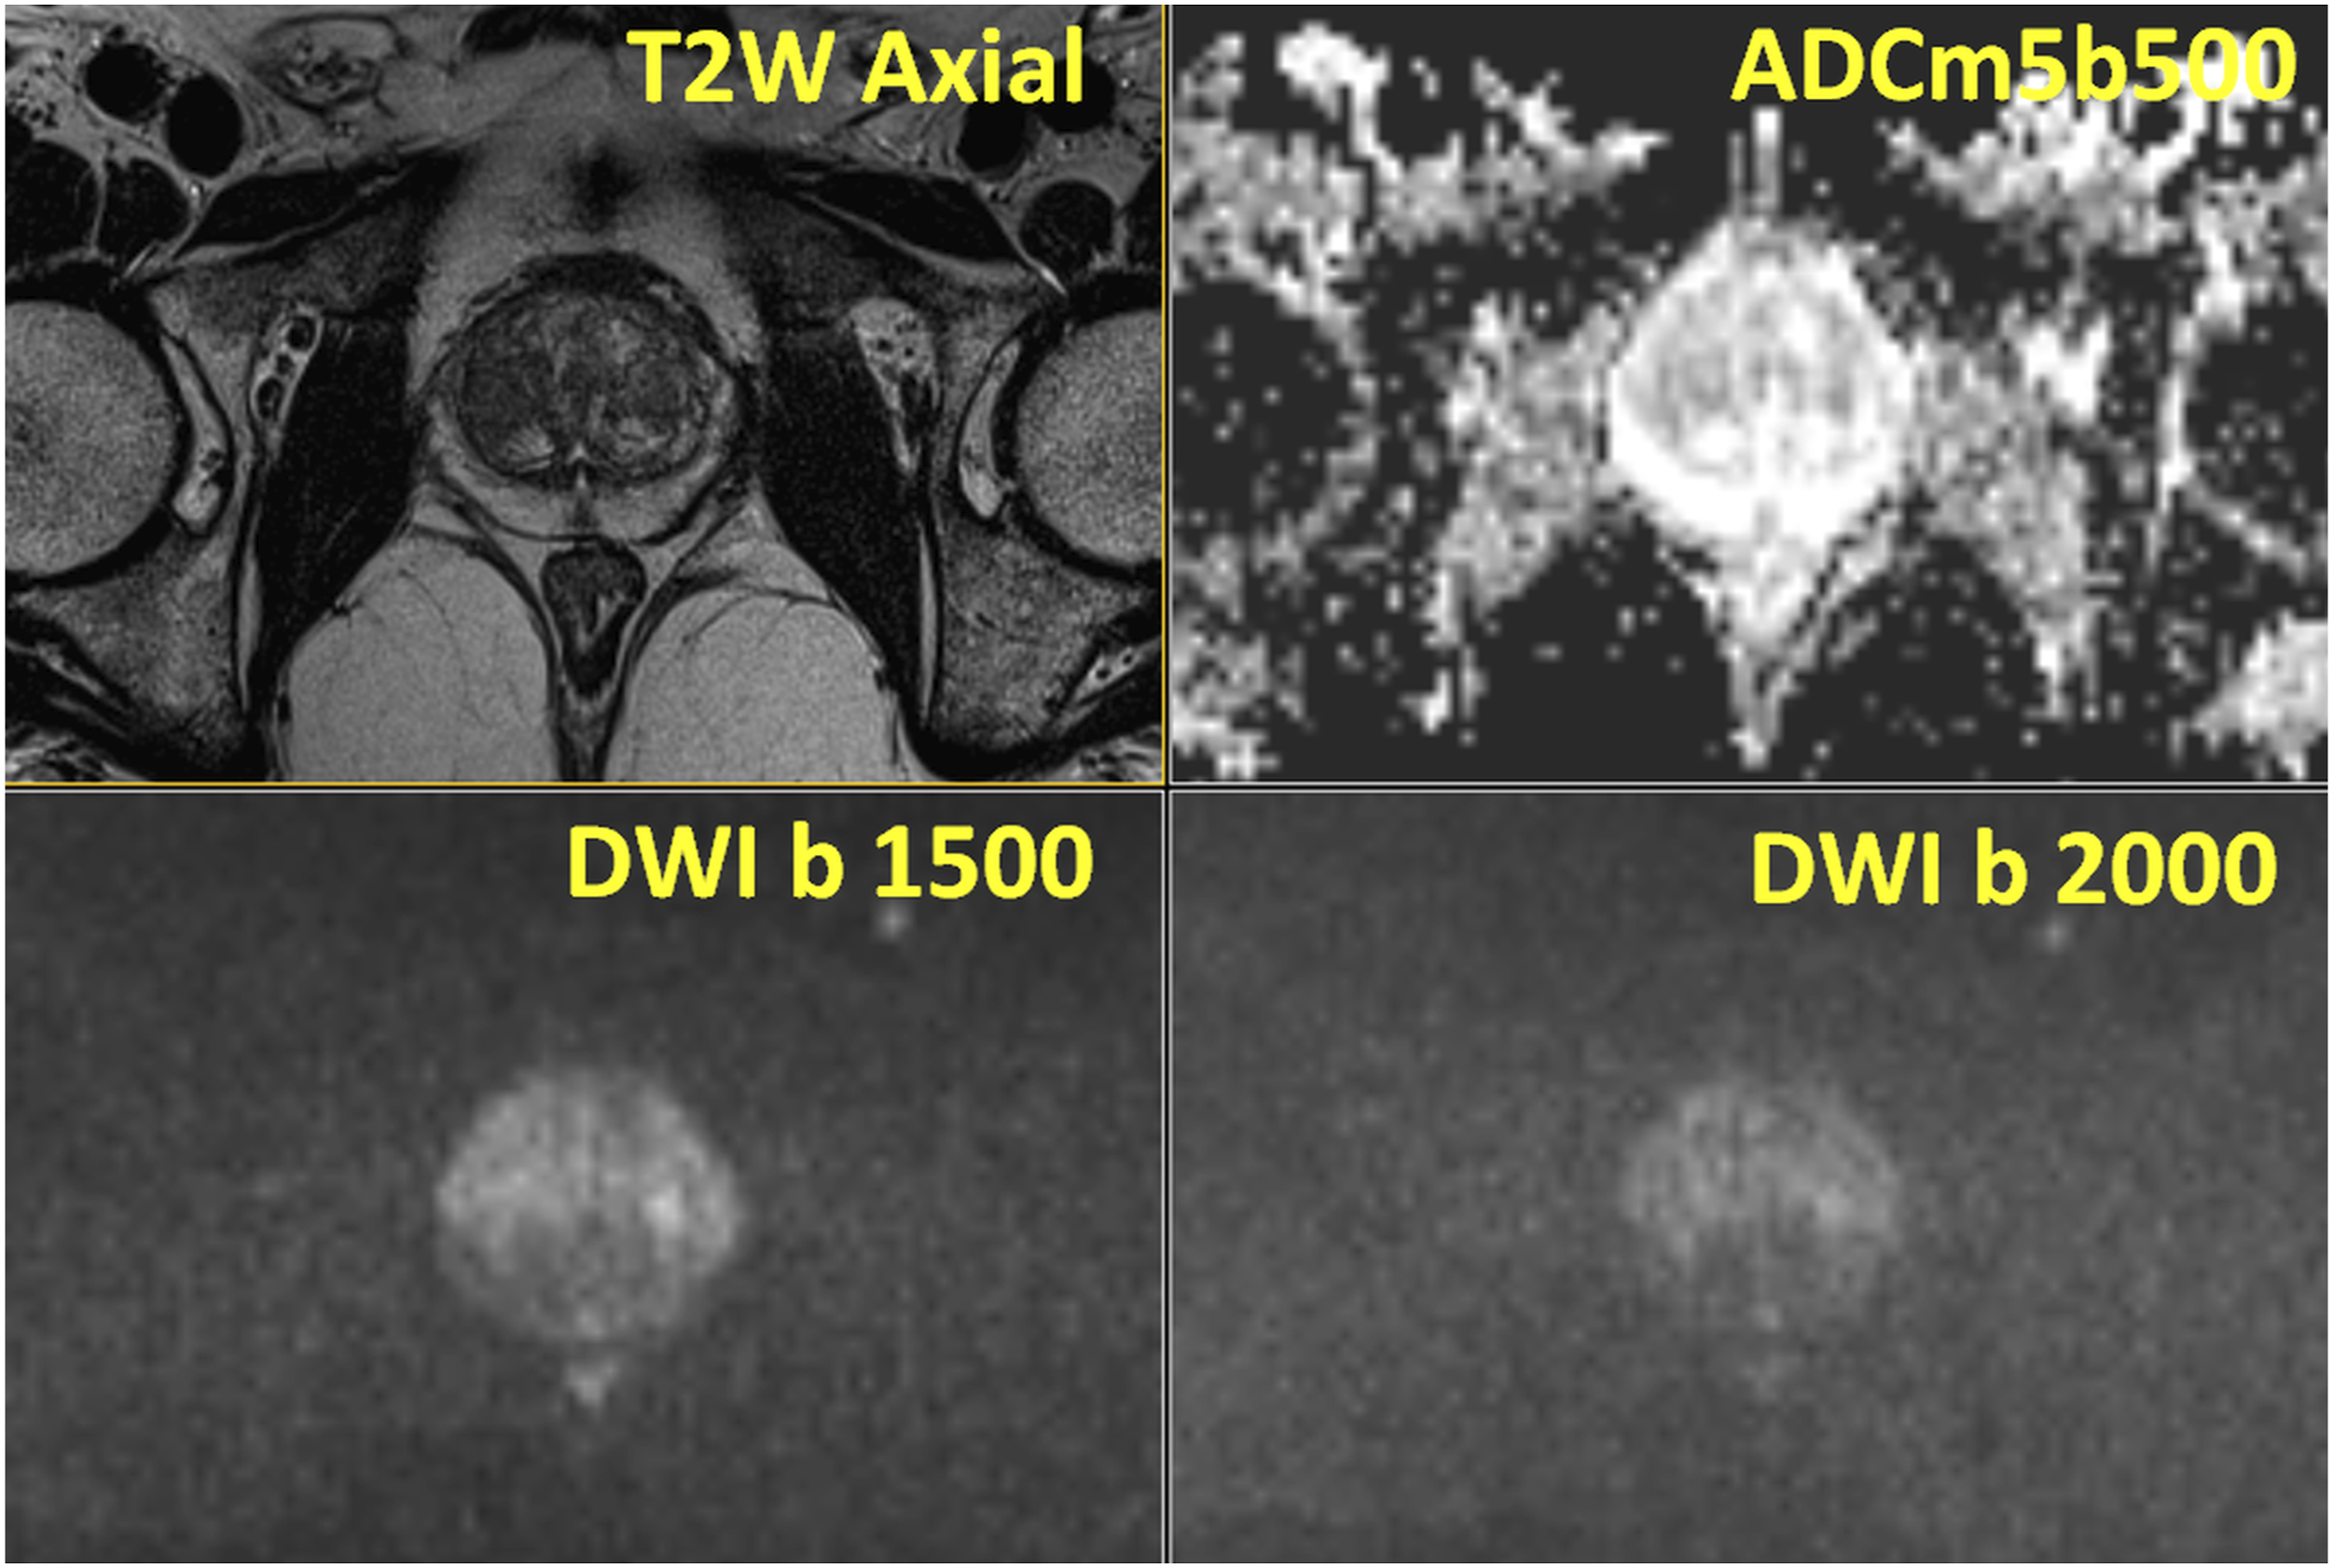
Teaching point - Typical imaging appearance of prostate cancer in peripheral zone: IMPROD study number 3: Focal area of low signal on T2-weighted (T2W Axial), low signal intensity of apparent diffusion coefficient maps (ADCm5b500) and high signal intensity on trace diffusion weighted imaging b-values of 1500 (DWI b1500) and 2000 (DWI b 2000) s/mm2 was present in the right peripheral zone corresponding to Gleason score 3+4 prostate cancer. Prostatectomy was performed with wide margins on the right side and negative surgical margins were found on whole mount prostatectomy sections. All MRI images available at: http://petiv.utu.fi/improd/ Additional images and videos of IMPROD study number 3 are presented in supporting material. Teaching point - It is important to communicate imaging finding with referring physicians and a simplified prostate imaging reporting scheme can be of help: Simplified prostate zonal anatomy. Peripheral zone is marked as hashed light grey, central zone as light grey and transition zone of dark grey. Teaching point - Typical BPH: IMPROD trial number 167: Normal peripheral zone and normal central gland with multiple nodules of benign prostatic hyperplasia were present on T2-weighted images (T2W Axial), apparent diffusion coefficient maps (ADCm5b500) and trace diffusion weighted imaging b-values of 1500 (DWI b1500) and 2000 (DWI b 2000) s/mm2, in the central zone. All central gland (transitional and central zone) lesions have a well-defined capsule. No prostate cancer was found in any cores of systematic biopsy. All MRI images are available at http://petiv.utu.fi/improd/ Additional images and videos of IMPROD study number 167 are presented in the supporting material.


It is crucial to develop a standardized way to communicate imaging findings in a reporting system which can be easily interpreted by all stake-holders, including men undergoing prostate MRI. This is especially important if a person reading MRI scan is different from a person performing biopsy. Moreover, creating and maintaining a database of imaging, clinical and histopathological findings is an important part of quality-control/improvement process. As an example of a publicly available database, readers are referred to a PROMOD database. 27
Reporting findings in the peripheral zone
Details on peripheral zone findings using PIRADs version 2.1 are presented elsewhere. Two recent studies compared different prostate MRI reporting systems and did not find any major differences between prostate MRI studies reported using different reporting systems (PIRADsv2.0 versus Likert reported using clinical information, PIRADsv2.1 vs IMPROD bpMRI Likert) when applied by the same readers.26,28 The major difference in using IMPROD bpMRI Likert scoring systems is integrating all available information rather than relying on ‘dominant sequences’ as per PIRADs version 2.1. In studies acquired using IMPROD bpMRI protocol, there was rather small difference between PIRADs version 2.1 and IMPROD bpMRI Likert scoring system. 26 Specifically, in 161 patients who took part in the IMPROD trial, the decision to perform systematic biopsy or systematic targeted biopsy would be different depending on reporting system only in 4 men (2%, 4/161). All 4 cases are presented in this 15-tweet series: https://twitter.com/jambor_ivan/status/1185272940671180800
Either extremes of reporting spectrum are rather easy to detect – score 1: no suspicion areas (Figure 15); score 4 or 5: Prostate cancer appears as focal area of decreased signal on T2-weighed images with decreased signal on ADC/ADCm images and increased signal on trace DWI b-values acquired with strong diffusion weighting, such as 1500 and 2000 s/mm2 (Figures 13 and 16). However, abscess and blood products (which could be hyperintense on T1-weighted images depending on the timing of biopsy/hemorrhage) could also appears as decreased signal on ADC/ADCm images and increased signal on trace DWI b-values acquired with strong diffusion weighting, such as 1500 and 2000 s/mm2. Please note, the b-value is just one of many parameters affecting contrast between tissues, thus, images with the same b-values can have very different tissue contrast. Teaching point - Typical prostate cancer in peripheral zone: IMPROD study number 45: One lesion with low signal intensity on T2-weighted images (T2W Axial), low signal intensity on apparent diffusion coefficient maps (ADCm5b500) and high signal intensity on trace diffusion weighted imaging b-values of 1500 (DWI b1500) and 2000 (DWI b 2000) s/mm2 was present which corresponded to Gleason score 4+3+5 prostate cancer with extra-capsular extension on the right-side. All MRI images are available at http://petiv.utu.fi/improd/ Additional images and videos of IMPROD study number 45 are presented in the supporting material.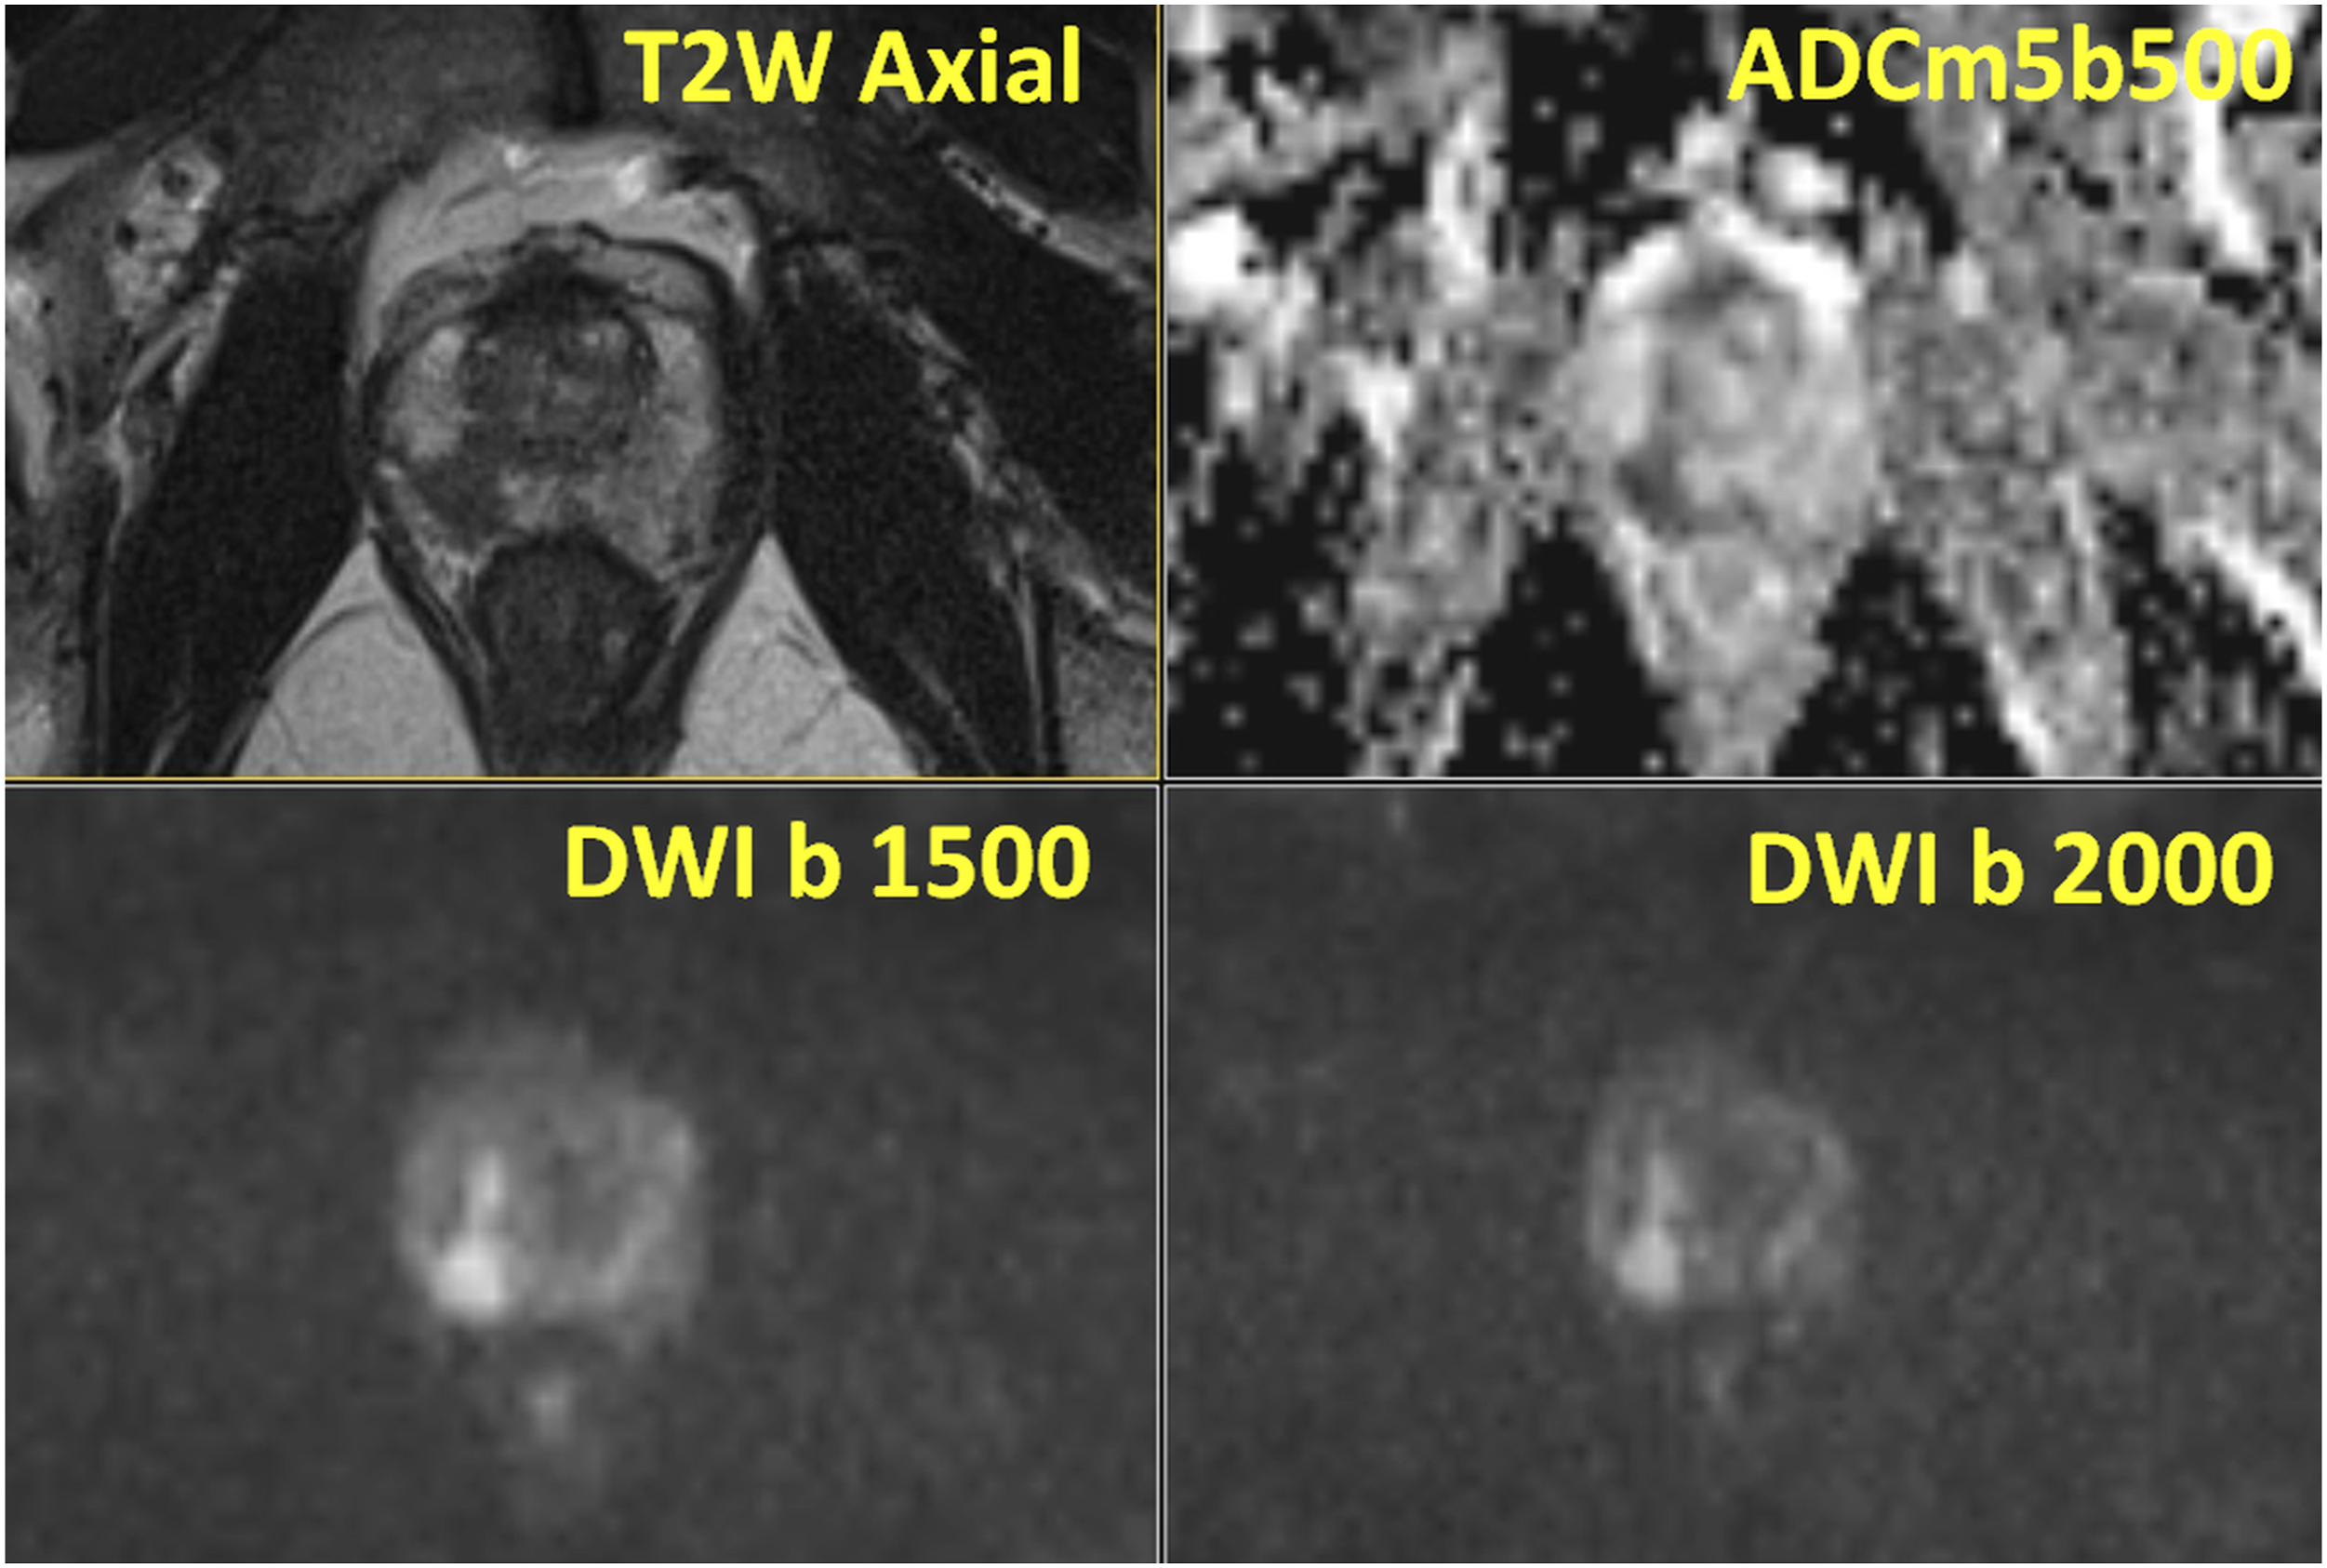
The presence of prostatitis or prior episodes of prostatitis and/or biopsy can lead to diffuse decrease signal on T2-weighted images without a focal decreased signal on ADC/ADCm images and no focal increased signal b-values acquired with strong diffusion weighting, in IMPROD bpMRI protocol those trace DWI images are b-values of 1500 and 2000 s/mm2 (Figure 17). These areas could be reported as PIRADs version 2.1 and/or IMPROD bpMRI Likert scoring systems score of one or 2, implying low probability of SPCa and routinely does not require biopsy. When in doubts regarding the nature of the lesion, follow up MRI scans in 6-12-24 months, could be considered taking into account lesion appearance and location on MRI (possibility of sampling errors) and patients’ risk factors (PSA density [dPSA], family history, …) and patient’s preference (Figure 18). Different methods for measuring prostate gland has been proposed and we recommend readers to develop and validate own methods and/or carefully validate proposed methods rather than blindly relying on measurements methods as proposed in PIRADs version 2.1 document. Teaching point - Typical benign prostatic hyperplasia with non-specific signal changes in peripheral zone: IMPROD study number 59: Bilateral areas of decreased T2-weighted imaging signal (T2W Axial) without a focal decreased signal on apparent diffusion coefficient maps (ADCm5b500) and without focal increased signal on b-trace diffusion weighted imaging b-values of 1500 (DWI b1500) and 2000 (DWI b 2000) s/mm2, was present in peripheral zone. No prostate cancer or prostatic intraepithelial neoplasia was found in any cores of systematic biopsy. All MRI images available at http://petiv.utu.fi/improd/ Additional images and videos of IMPROD study number 59 are presented in the supporting material. Teaching point - Resolution of imaging finding in PZ in follow up MRI: IMPROD study number 22: There was one focal irregular lesion in the apex, right side, with size of 10x8x8 mm, seen as low signal intensity on T2-weighted images (T2W Axial), low signal intensity on apparent diffusion coefficient maps (ADCm5b500) and high signal intensity on trace diffusion weighted imaging b-values of 1500 (DWI b1500) and 2000 (DWI b 2000) s/mm2. Systematic and targeted biopsy did not demonstrate any prostate cancer and on follow up imaging 386 days from the initial IMPROD bpMRI scan, the lesion was not apparent anymore. All images of the initial and follow up MRI scans are available at http://petiv.utu.fi/improd/ Additional images and videos of IMPROD study number 22 are presented in the supporting material.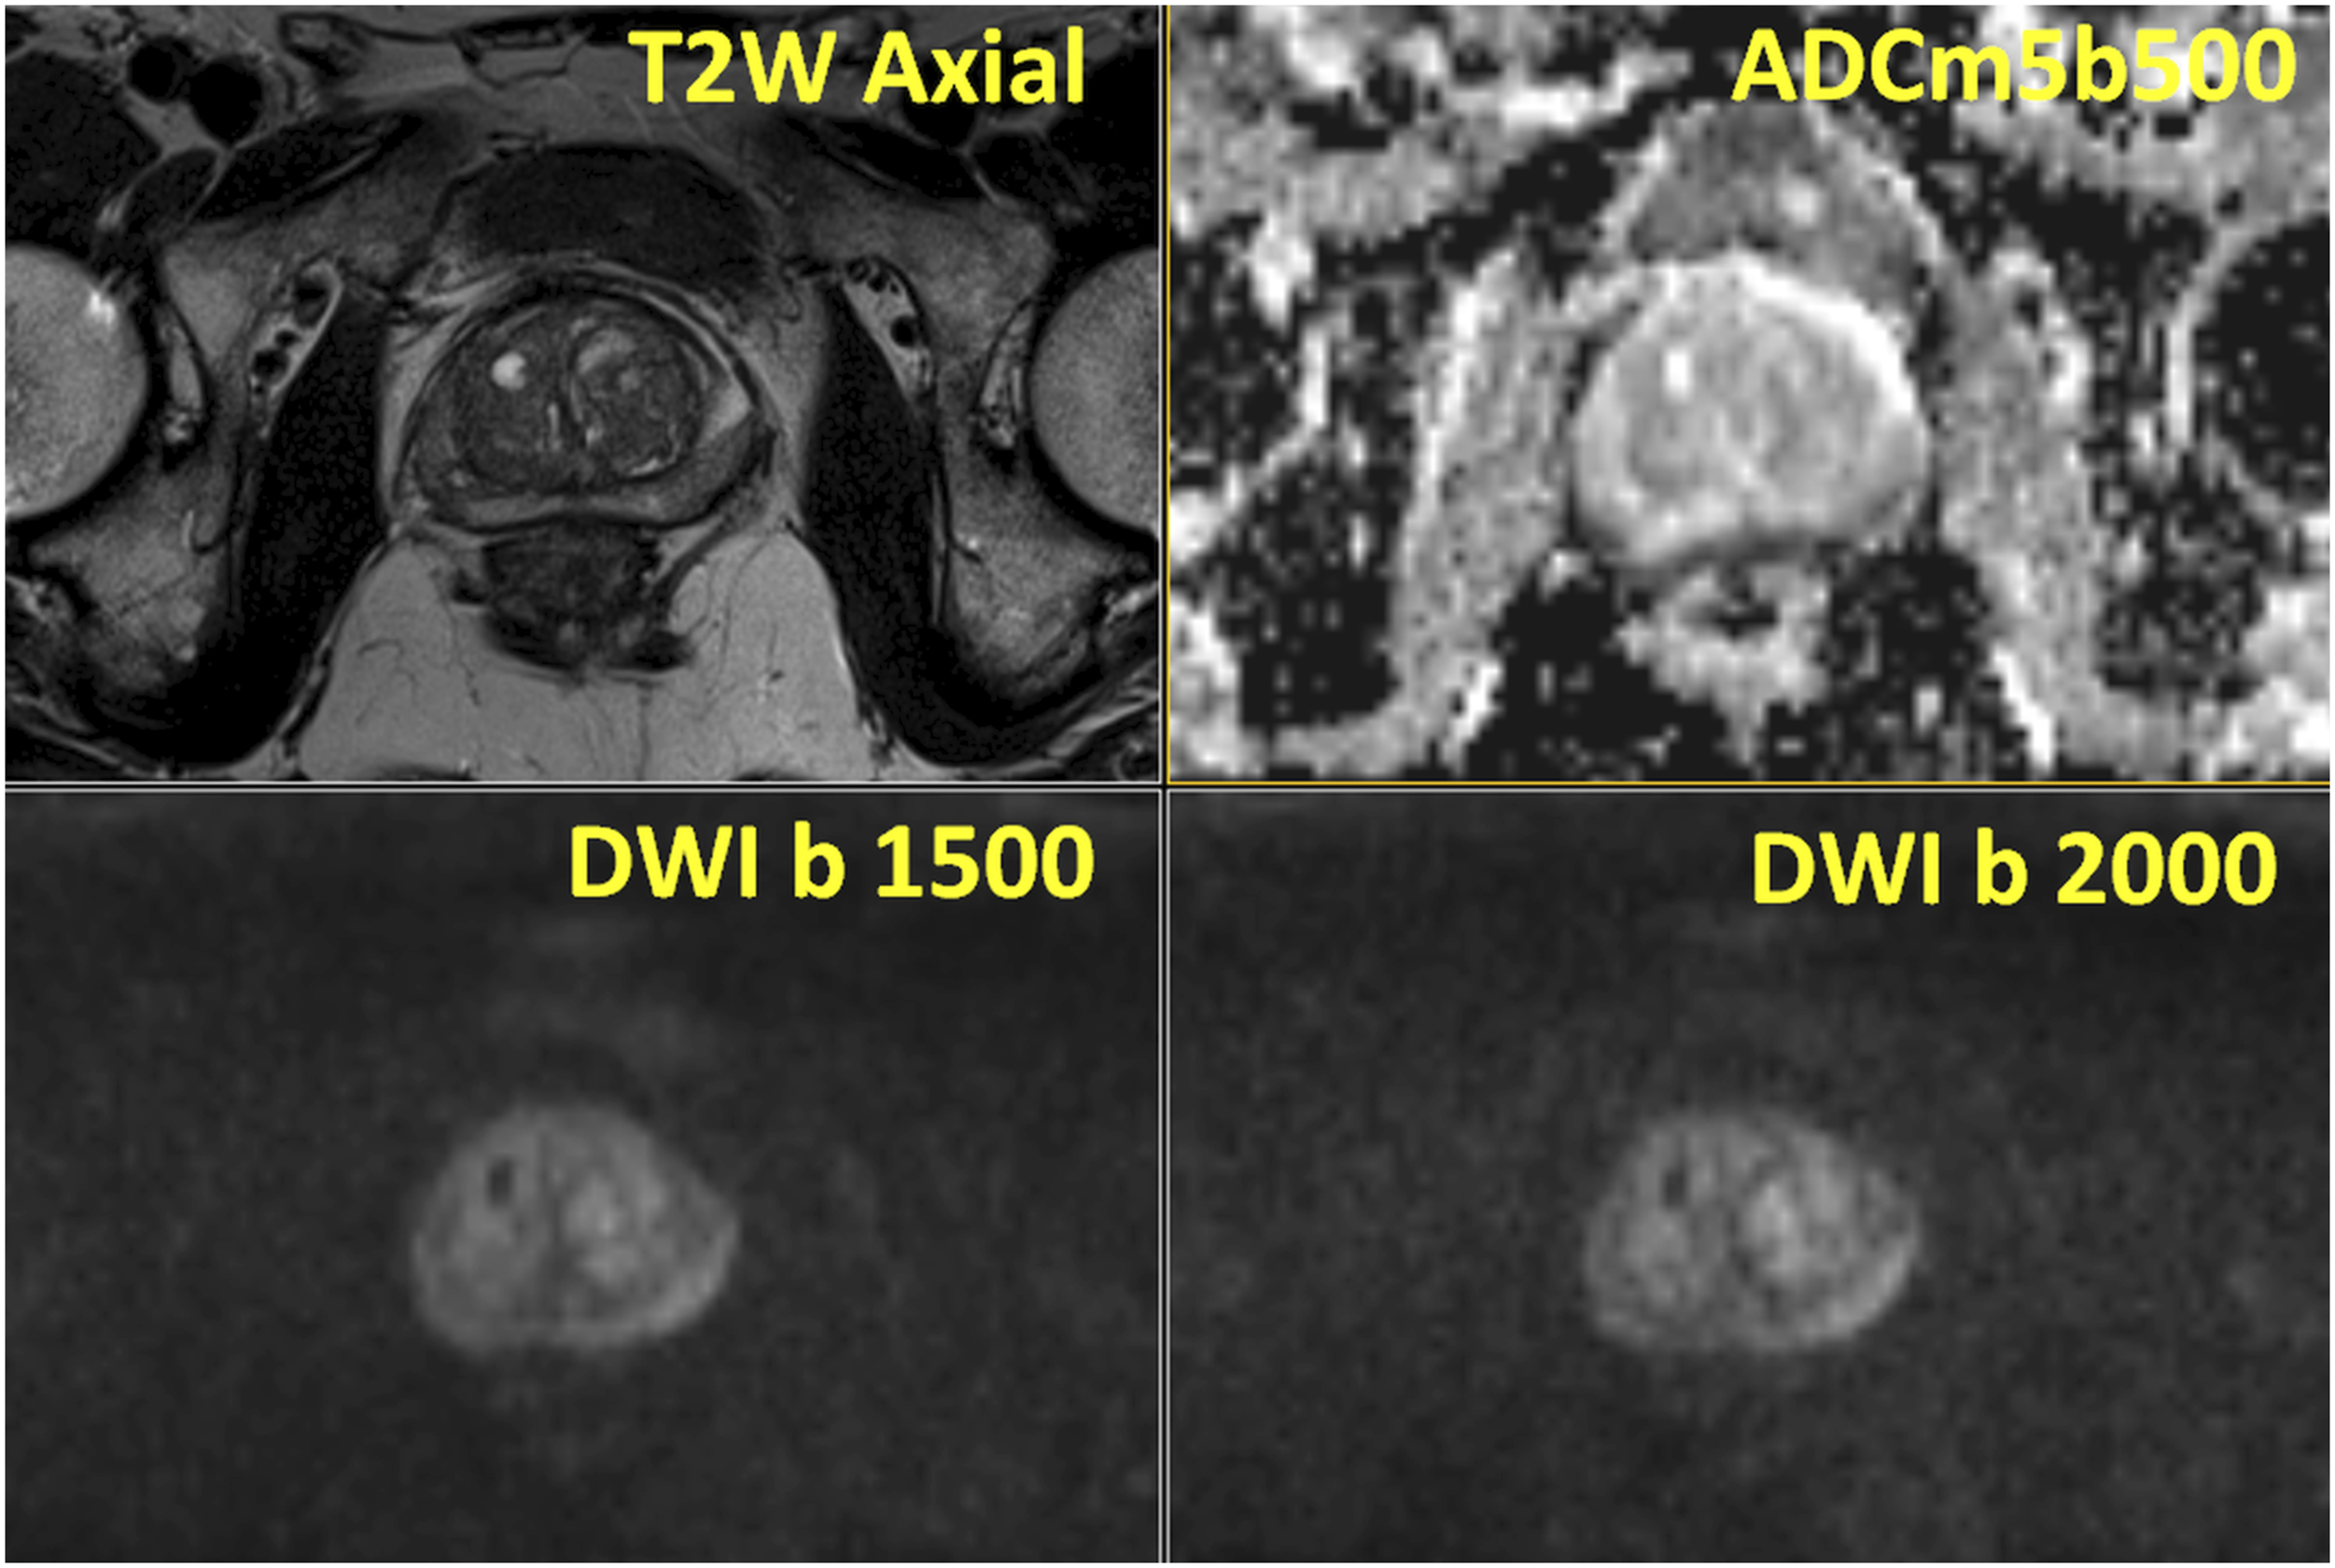

Linear areas in the peripheral zone crossing the peripheral zone with decreased signal on T2-weighed images, decreased signal on ADC/ADCm images, and increased signal on DWI images acquired with strong diffusion weighting, for example, b-value of 500 and 2000 s/mm2, usually represent benign findings (Figure 19), however, csPCa cannot be totally excluded in such cases (Figure 20). In a retrospective study by Jorge Abreu-Gomez e al., up to 13% of PCa lesions in the peripheral zone were linear or wedge-shaped.
29
However, proportion of lesions with linear or wedge shape in the peripheral zone which represents csPCa depends on many factors such as study population and reference standard. Thus, rather than quoting a specific number for a possibility of a linear or wedge-shape lesion with typical PCa signal characteristics (decreased T2-weighted signal and associated decreased signal on ADC/ADCm images and increased signal b-values acquired with strong diffusion weighting, 1500 and 2000 s/mm2) to be a csPCa, an individualized approached is needed. Such individualized approached could represent follow up imaging (Figure 18), repeated biopsy (Figure 20) or watchful waiting (Figure 19). Thus, if the aim of finding all csPCa is desired in a certain man, repeated biopsy with follow imaging in recommended. Teaching point - Linear signal changes in peripheral zone which could be both benign or prostate cancer: IMPROD study number 15: There was one focal irregular lesion in the mid-gland to apex, left side, with size of 8x9x10 mm, seen as low signal intensity on T2-weighted images (T2W Axial), low signal intensity on apparent diffusion coefficient maps (ADCm5b500) and high signal intensity on trace diffusion weighted imaging b-values of 1500 (DWI b1500) and 2000 (DWI b 200) s/mm2. Systematic and targeted biopsy did not reveal any PCa and patient has stable PSA. Following risk-decision discussion with the patient, PSA is being follow which is stable to decreasing for over 2 years. All MRI images available at http://petiv.utu.fi/improd/ Additional images and videos of IMPROD study number 15 are presented in supporting material. Teaching point - Linear signal changes in peripheral zone which could be both benign or prostate cancer: IMPROD study number 133: Focal wedge-shaped lesion in right peripheral zone, seen as low signal intensity on T2-weighted images (T2W Axial), low signal intensity on apparent diffusion coefficient maps (ADCm5b500), high signal intensity on trace diffusion weighted imaging b-values of 1500 (DWI b1500) and 2000 (DWI b 2000) s/mm2, in the peripheral zone of mid-gland which was on found to be, in systematic biopsy and subsequent prostatectomy, Gleason score 3+4 prostate cancer. All MRI images are available at http://petiv.utu.fi/improd/ Additional images and videos of IMPROD study number 133 are presented in supporting material.

Extension of PCa beyond the margins of the prostatic capsule (Figures 16 and 21) can be suggested if ‘loss of prostate capsule’, ‘bulging with irregular or spiculated margin’, ‘obliteration of the rectoprostatic angle’, ‘asymmetry or invasion of the neurovascular bundles’ are present (Figures 16 and 21). Presence of seminal vesicle invasion can be suggested when an area of abnormal low T2-weighted imaging signal intensity is extending to the seminal vesicle which typically have high signal intensity on T2-weighted images (Figure 22). Teaching point - Typical appearance of extra-capsular extension: IMPROD study number 45: Low signal intensity in T2-weighted images (T2W Axial) in the right peripheral zone was present with bulging and spiculated margin (yellow arrow) of prostate capsule suggestive of extra-capsular extension which was found on whole prostatectomy sections. Prostatectomy was performed with wide margins on the right and complete nerve sparing on the left resulting in negative surgical margins on the right side. All MRI images available at http://petiv.utu.fi/improd/ Additional images and videos of IMPROD study number 45 are presented in the supporting material. Teaching point - Typical appearance of seminal vesicle invasion: IMPROD study number 63: Irregular area of low signal on T2-weighted images (yellow arrow) was extending to normal high T2-weighted imaging signal of seminal vesicle, consistent with seminal vesicle invasion as confirmed on prostatectomy specimens. Additional images and videos of IMPROD study number 63 are presented in the supporting material.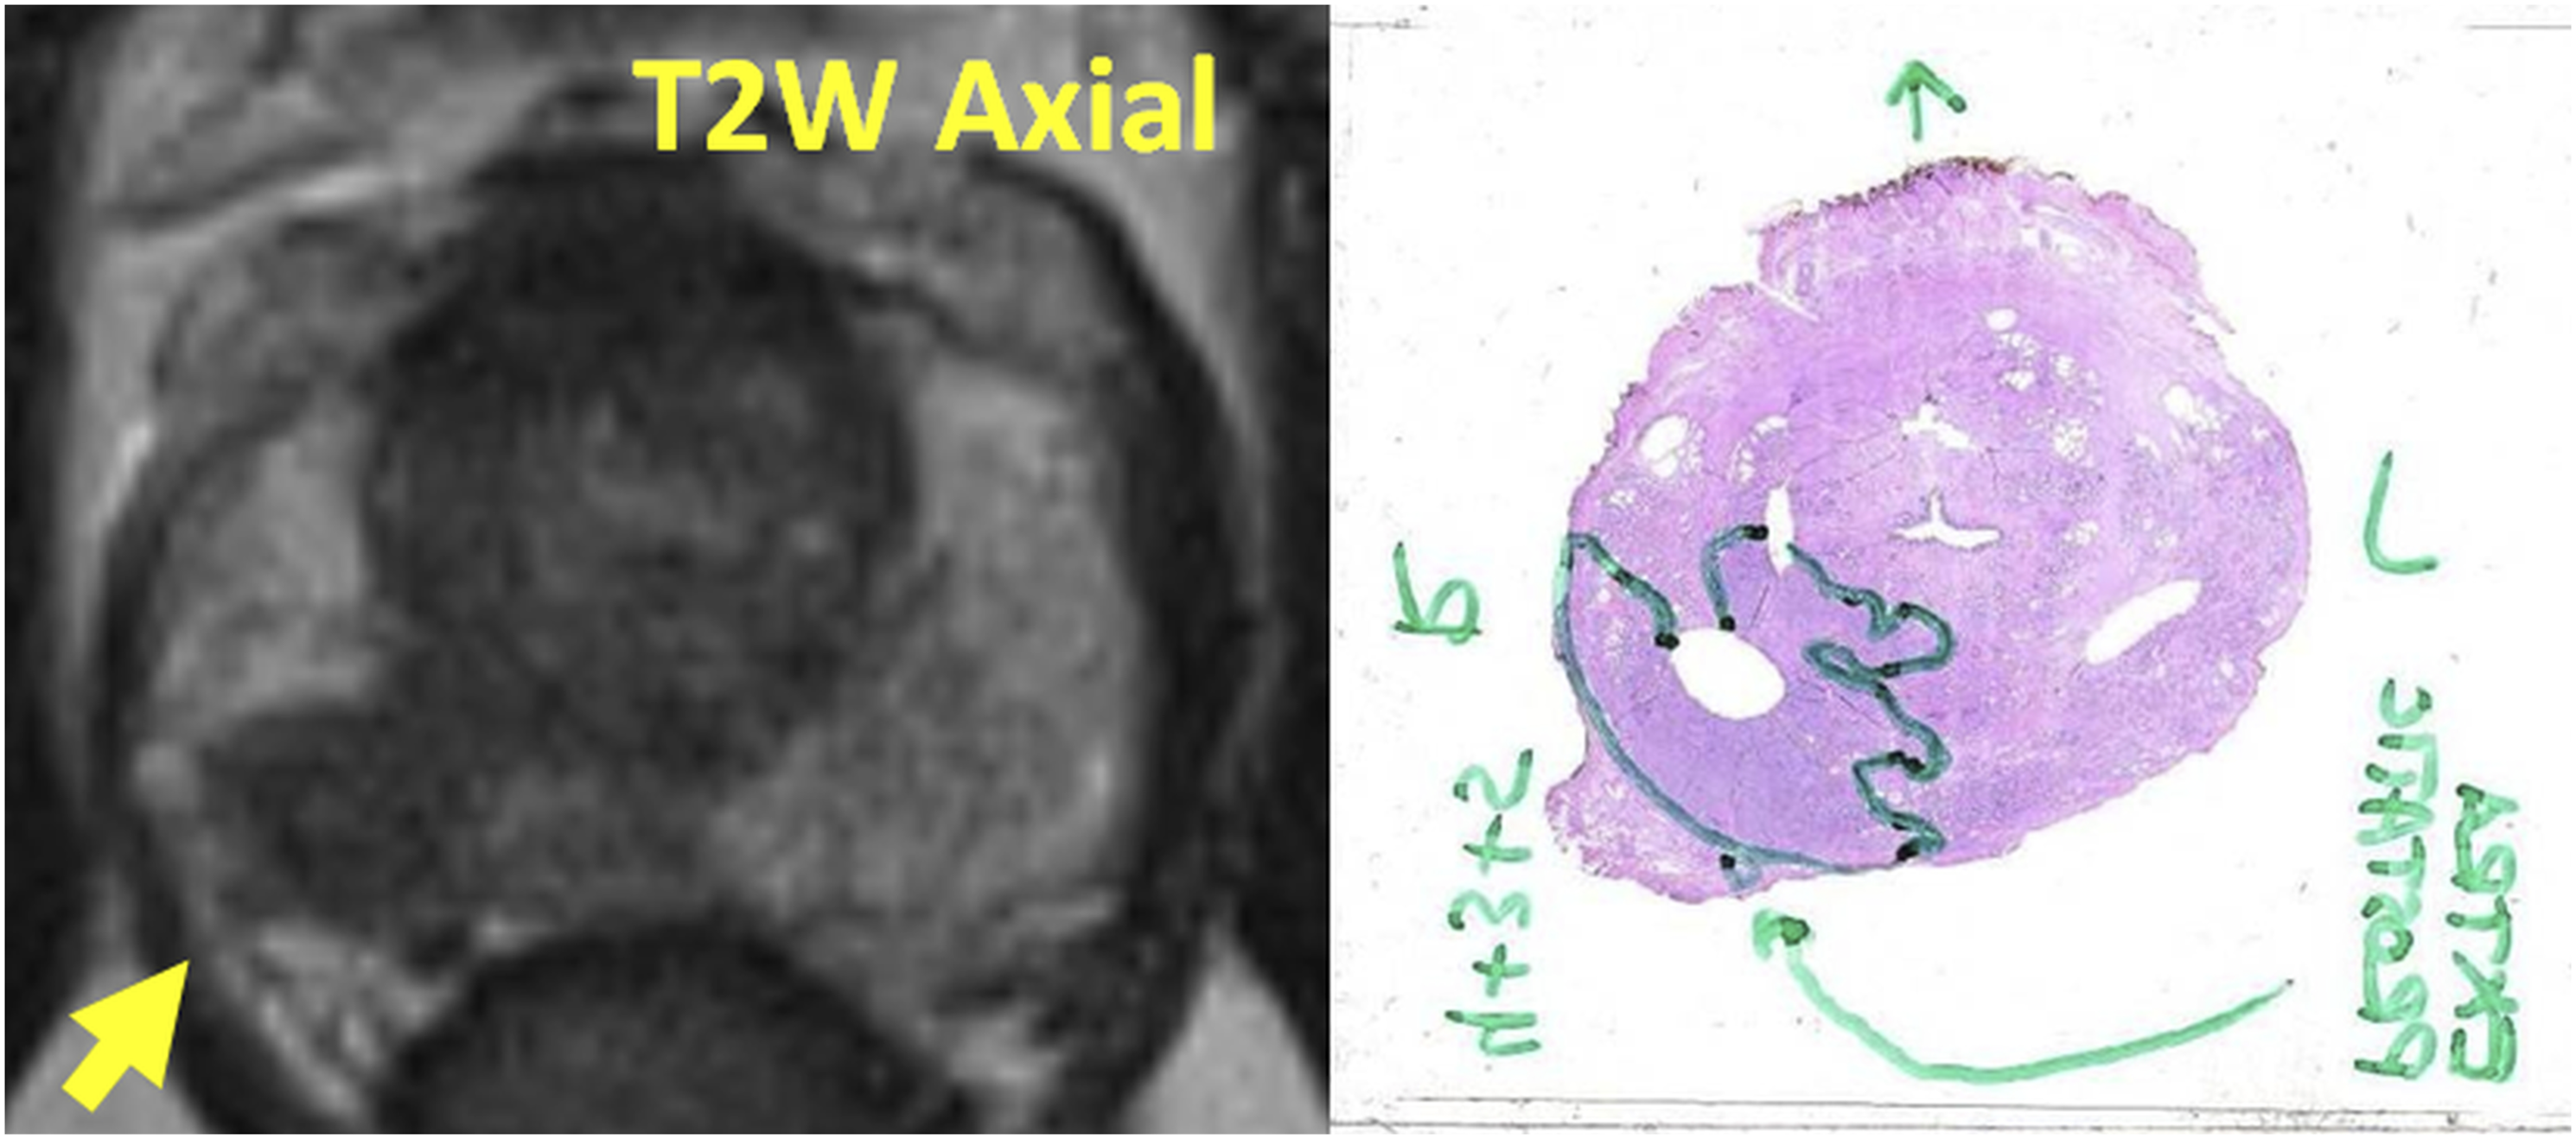

In summary, reporting lesions that are highly suspicious of harbouring csPCa (PIRADs version 2.1/IMPROD bpMRI Likert score 4–5) in the peripheral zone is straightforward since these lesions are focal in nature with typical PCa signal characteristics (decreased T2-weighted signal and associated decreased signal on ADC/ADCm images and increased signal b-values acquired with strong diffusion weighting, 1500 and 2000 s/mm2), Figures 3, 13 and 16. The lesions which are linear or wedge shaped with the typical PCa signal characteristics partly present a diagnostic challenge and individualized patient management should be considered (Figures 18, 19 and 20). Reporting extra-prostatic extension (Figure 21) and seminal vesicle invasion (Figure 22) depends on MRI acquisition protocol and used reference standard in the training process. Thus, readers should refer to their own institutional data and do not reply on reported performance from other centres which can be misleading and detrimental to patient’s management.
Reporting findings in the central gland
The central zone, part of central gland in addition to transition zone, typically contains BPH nodules (Figures 2, 15 and 23). A typical BPH nodule has mixed signal intensity on T2-weighted images with variables DWI signal (Figures 2, 15 and 23). A so-called atypical BPH nodule has low signal intensity on T2-weighted images with signal restriction on DWI (Figure 23). A typical or atypical or whatever terminology readers want to use to describe BPH nodules can have variable signal characteristics and shape on T2-weighted image and DWI but a BPH nodule should be surrounded by a low T2-weighted signal intensity capsule which completely encapsulates the lesion (Figures 2, 15 and 23). Regardless of signal characteristics and shape on T2-weighted imaging and DWI, lesions which have complete capsule likely represent BPH nodules (Figures 2, 15 and 23) and there is no need to biopsy such lesions if other parameters are not suggestive of csPCa presence. These lesions can be reported as PIRADs version 2.1/IMPROD bpMRI Likert score 1–2 if fully encapsulated or score of three if capsule is incomplete. In contrast to BPH, PCa in central gland appears as irregular areas, could be lens shape or any other shape (Figures 4, 12 and 24) without surrounding capsule. However, PCa in transition zone also can be very homogeneous. For simplification, we will refrain from discussion on transition and central zone lesion and describe all lesions as central gland lesions. Teaching point - Typical appearance of benign prostatic hyperplasia which can mimic prostate cancer: IMPROD study number 127: A lesion with restricted diffusion in the central gland (transitional and central zone) is present on the left side, base. The lesion has the following signal characteristics: low signal intensity on T2-weighted images (T2W Axial), low signal intensity on apparent diffusion coefficient maps (ADCm5b500), high signal intensity on trace diffusion weighted imaging b-values of 1500 (DWI b1500) and 2000 (DWI b 2000) s/mm2. The lesion is BPH since it has a complete surrounding capsule. All MRI images are available at http://petiv.utu.fi/improd/ Additional images and videos of IMPROD study number 127 are presented in the supporting material. Teaching point - Typical appearance of PCa in the central gland: IMPROD study number 92: A lesion with restricted diffusion located in the central gland, mid-gland level and extends towards the base, mid-line, in front of urethra without any surrounding capsule. The lesion has the following signal characteristics: low signal intensity on T2-weighted images (T2W Axial), low signal intensity on apparent diffusion coefficient maps (ADCm5b500), high signal intensity on trace diffusion weighted imaging b-values of 1500 (DWI b1500) and 2000 (DWI b 2000) s/mm2. The size of the lesion was CCxRLxAP:13x13x10 mm. The lesion was found to correspond to Gleason sore 4+3 prostate cancer on whole mount prostatectomy sections. All MRI images are available at http://petiv.utu.fi/improd/ Additional images and videos of IMPROD study number 92 are presented in the supporting material.

Accuracy of IMPROD bpMRI for prostate cancer in men with a clinical suspicion of prostate
The accuracy of IMPROD bpMRI is not 100% and other clinical parameters and individualized risk assessments are needed (Figure 25). However, in analysis of patients who underwent robotic-assisted laparoscopic prostatectomy (RALP) following biopsy in the IMPROD trial (40%, 64/161), the initial pre-biopsy IMPROD bpMRI scan detected 71 PCa lesions (71%, 91/99) with Gleason score of 3+4 or higher and only three lesions (7.5%, 3/40) with GS >3 + 4 were missed. All dominant lesions with GS >3 + 4 were correctly identified. Moreover, all men enrolled in the IMPROD trial (ClinicalTrials.gov Identifier: NCT01864135) are undergoing close follow-up. With the current median follow-up for the IMPROD trial cohort of over 3 years, in 49 men with IMPROD bpMRI Likert scores of 1–3, only two men (4%, 2/49) were found to have low-volume PCa with a Gleason score of 3 + 4 during the follow-up period, suggesting that the initial IMPROD bpMRI scan had a high negative predictive value. Thus, initial negative IMPROD bpMRI in men with a clinical suspicion of PCa can serve as a tool to limit biopsy procedures. Same type of MRI acquisition and reconstruction protocol (Figure 26) should ideally be used in men who decide to undergo active surveillance since variation in prostate MRI protocol can negatively impact PCa detection and characterization. If imaging and pathology findings are discordant in a patient with persistent clinical suspicion for PCa, repeated imaging with repeated biopsy tend to be the preferred option (Figure 27). All imaging studies presented in this pictorial review were performed without intravenous contrast agent. Large number of studies has retrospectively evaluated prostate MRI datasets reported with and without the use of intra-venous contrast agent. In a recent meta-analysis by Bass et al.,
30
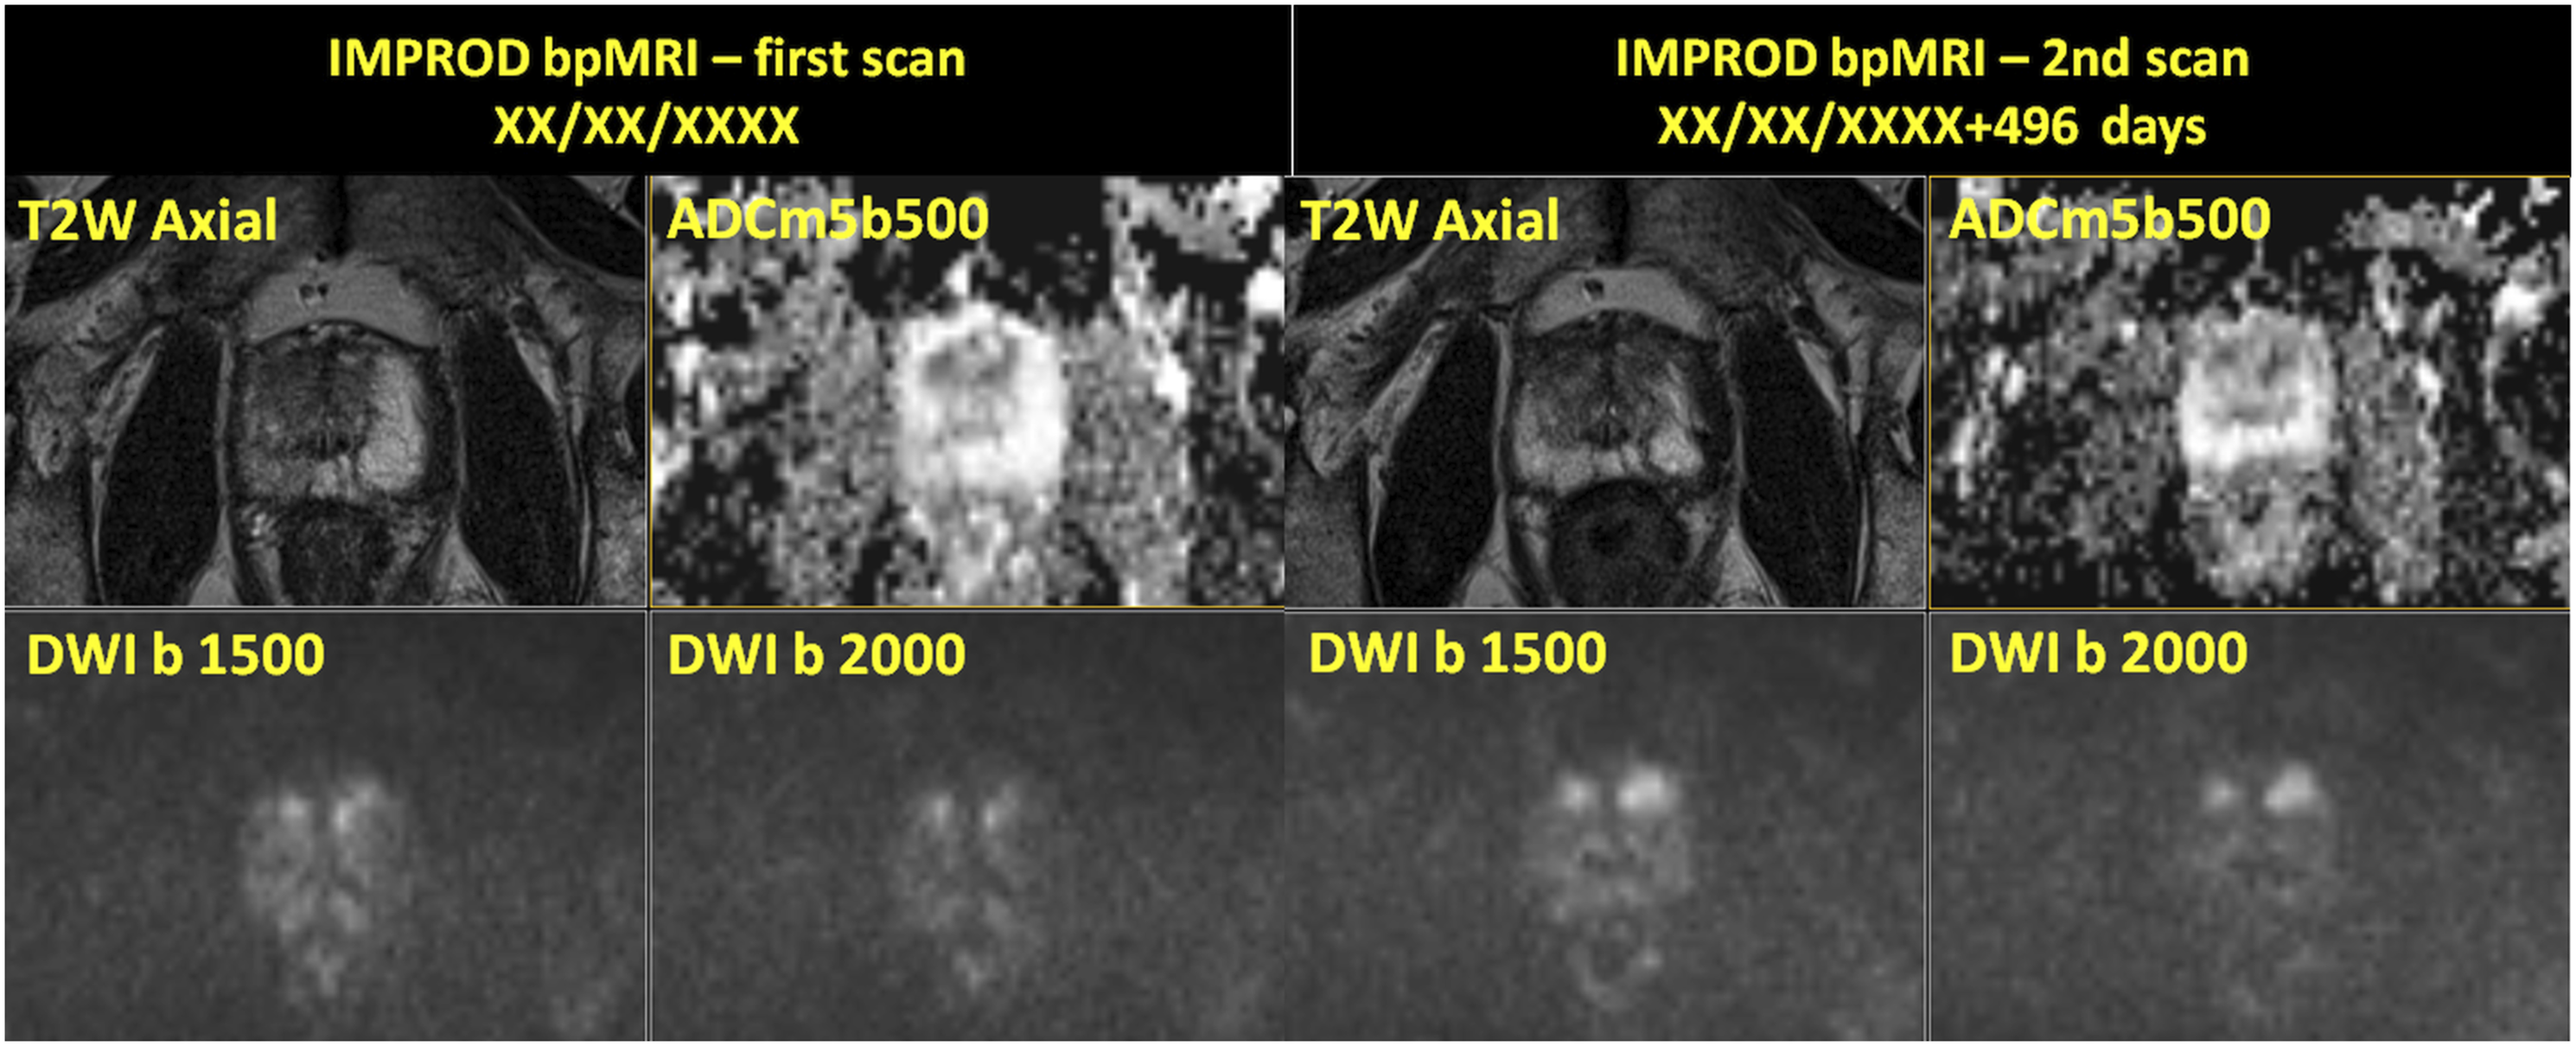
authors concluded that prostate MRI reported without use of intra-venous contrast agent perform similar in detecting prostate cancer to prostate MRI studies reported using intra-venous contrast agent. Teaching point - Prostate cancer missed on MRI: IMPROD study number 130: No highly suspicious lesion was seen but two cores of 3+4 in systematic biopsies. Patient decided for Robot Assisted Laparoscopic Prostatectomy (RALP) with bilateral nerve sparing and was found to have less than 5% GS3+4/GGG2 in RIGHT apex. All MRI images are available at http://petiv.utu.fi/improd/ Additional images and videos of IMPROD study number 130 are presented in supporting material. Teaching point - Increase in the lesion size of peripheral zone lesion in the in follow up MRI: IMPROD study number 28: Focal area of low signal on T2-weighted images (T2W) with low signal intensity on apparent diffusion coefficient maps (ADCm5b500), high signal intensity on trace diffusion weighted imaging b-values of 1500 (DWI b1500) and 2000 (DWI b 2000) s/mm2 was present in the left apex in a patient who was found to have Gleason score 3+3 in one cores of systematic biopsy. Follow up imaging performed 568 days following the initial IMPROD bpMRI scan demonstrated small increase in the lesion size. Patient opted to continue active surveillance. All images of the initial and follow up MRI scans are available at http://petiv.utu.fi/improd/ Additional images and videos of IMPROD study number 28 are presented in the supporting material. Teaching point - Increase in lesion size of an anterior PZ/central gland lesion in the in follow up MRI: IMPROD study number 50: Focal areas of low signal on T2-weighted images (T2W Axial) signal with low signal on apparent diffusion coefficient maps (ADCm5b500) and high signal on DWI trace images of b 1500 (DWI b1500) and 2000 (DWI b 2000) s/mm2 in the central gland were initially reported as IMPROD bpMRI Likert score of 3. In the follow up IMPROD bpMRI performed 496 days following the initial scan, these lesions were upgraded to the score 5 and repeated targeted biopsy was performed which demonstrated Gleason score 3+3 PCa. All images of the initial and follow up MRI scans are available at http://petiv.utu.fi/improd/Additional images and videos of IMPROD study number 50 are presented in supporting material.

Continuous quality control, database, case follow-up of IMPROD bpMRI for prostate
Continuous quality control and correlation with biopsy and prostatectomy findings, ideally using whole mount prostatectomy section, is crucial (Figure 28). Quality of prostate MRI is gaining increasing popularity in the literature with several groups proposing different approaches and systems to evaluate prostate MRI and MRI-guided biopsy pathway quality. Giganti et al.
31
developed a system called the Prostate Imaging Quality (PI-QUAL) which relies on visual evaluation of prostate MRI to assigned quality score. We truly applaud these efforts but their impact will be limited if access to all datasets is not provided. Moreover, prostate MRI acquisition protocol impacts quality of prostate MRI, thus, providing free public access to prostate MRI acquisition is paramount for external reproducibility and repeatability of published studies. This pictorial review provides access to prostate MRI acquisition protocol for all three major MRI vendors, thus, enabling readers to acquire datasets of similar quality at their home institutions. Development of freely publicly available databases of prostate MRI and accoupling clinical, laboratory and histopathological findings in men with suspected, diagnosed or recurrent PCa could lead to bigger impact on clinical practice and acceptance of prostate MRI rather than meta-analysis of single or multi-centre studies which do not provide access to the source datasets. As of now a PRostate Mri Outcome Database (PROMOD) has been developed with the aim of to create a comprehensive database including multiple heterogeneous cohorts in order to explore inter-centre differences in the accuracy of MRI, and define optimal strategies for selection of men who might benefit from biopsies. We invite all centres to participate in PROMOD and encourage interested individuals/research groups/centres to reach out to us at Teaching point - Lesion in right PZ which leads to wide surgical margins on the right: IMPROD study number 21: One lesion on the right side in the midgland was detected which was found to be Gleason score 4+3 with negative surgical margins on the right side and complete nerve sparing on the LEFT-side. The lesion has the following signal characteristics: low signal intensity in T2-weighted images (T2W Axial), low signal intensity on apparent diffusion coefficient maps (ADCm5b500), high signal intensity on trace diffusion weighted imaging b-values of 1500 (DWI b1500) and 2000 (DWI b 2000) s/mm2. All MRI images are available at http://petiv.utu.fi/improd/ Additional images and videos of IMPROD study number 21 are presented in supporting material.
Each individual institution is strongly encouraged to develop and maintain own database of prostate MRI and try to limit lost to follow up. Such database allows to follow interesting imaging findings (Figures 29 and 30) and cross-correlates those with different imaging modalities (CT, PET/CT) and/or histopathology. Teaching point - If a lesion has marked T2 relaxation time shortening (i.e. ‘very dark’ on T2-weighted images), the lesion might *not* demonstrate relative hyperintensity on trace DWI: MULTI-IMPROD study number 176 (same case as in the Figure 30): One lesion (red arrow) was present in peripheral zone, close to midline. The lesion has the following signal characteristics: low signal intensity on T2-weighted images (T2W Axial), low signal intensity on apparent diffusion coefficient maps (ADCm5b500, ADCm2b1500, ADCm2b2000), low signal intensity on trace diffusion weighted imaging b-values of 500 (DWI5b500 b500), 1500 (DWI2b1500 b1500) and 2000 (DWI2b2000 b2000) s/mm2. On the corresponding whole mount proctectomy section, prostate cancer was found in the peripheral zone. All MRI images are available at http://petiv.utu.fi/multiimprod/. Teaching point: Calcifications (blue arrow) on T2-weighted images and all trace DWI images will be completely dark (meaning hypointense). However, also markedly dark on ADC/ADCm images since calcifications have very low signal on all individual trace DWI images: MULTI-IMPROD study number 176 – The same patient as Figure 29: In addition to prostate cancer lesion in the peripheral zone (red arrow), close to midline, there are areas in the central gland (blue arrow) with the following signal characteristics: low signal intensity on T2-weighted images (T2W Axial), low signal intensity on apparent diffusion coefficient maps (ADCm5b500), low signal intensity on trace DWI images (DWI b0, DWI b100, DWI b250, DWI b500), 1500 (DWI2b1500 b1500) and 2000 (DWI b 2000) s/mm2. All MRI images are available at http://petiv.utu.fi/multiimprod/.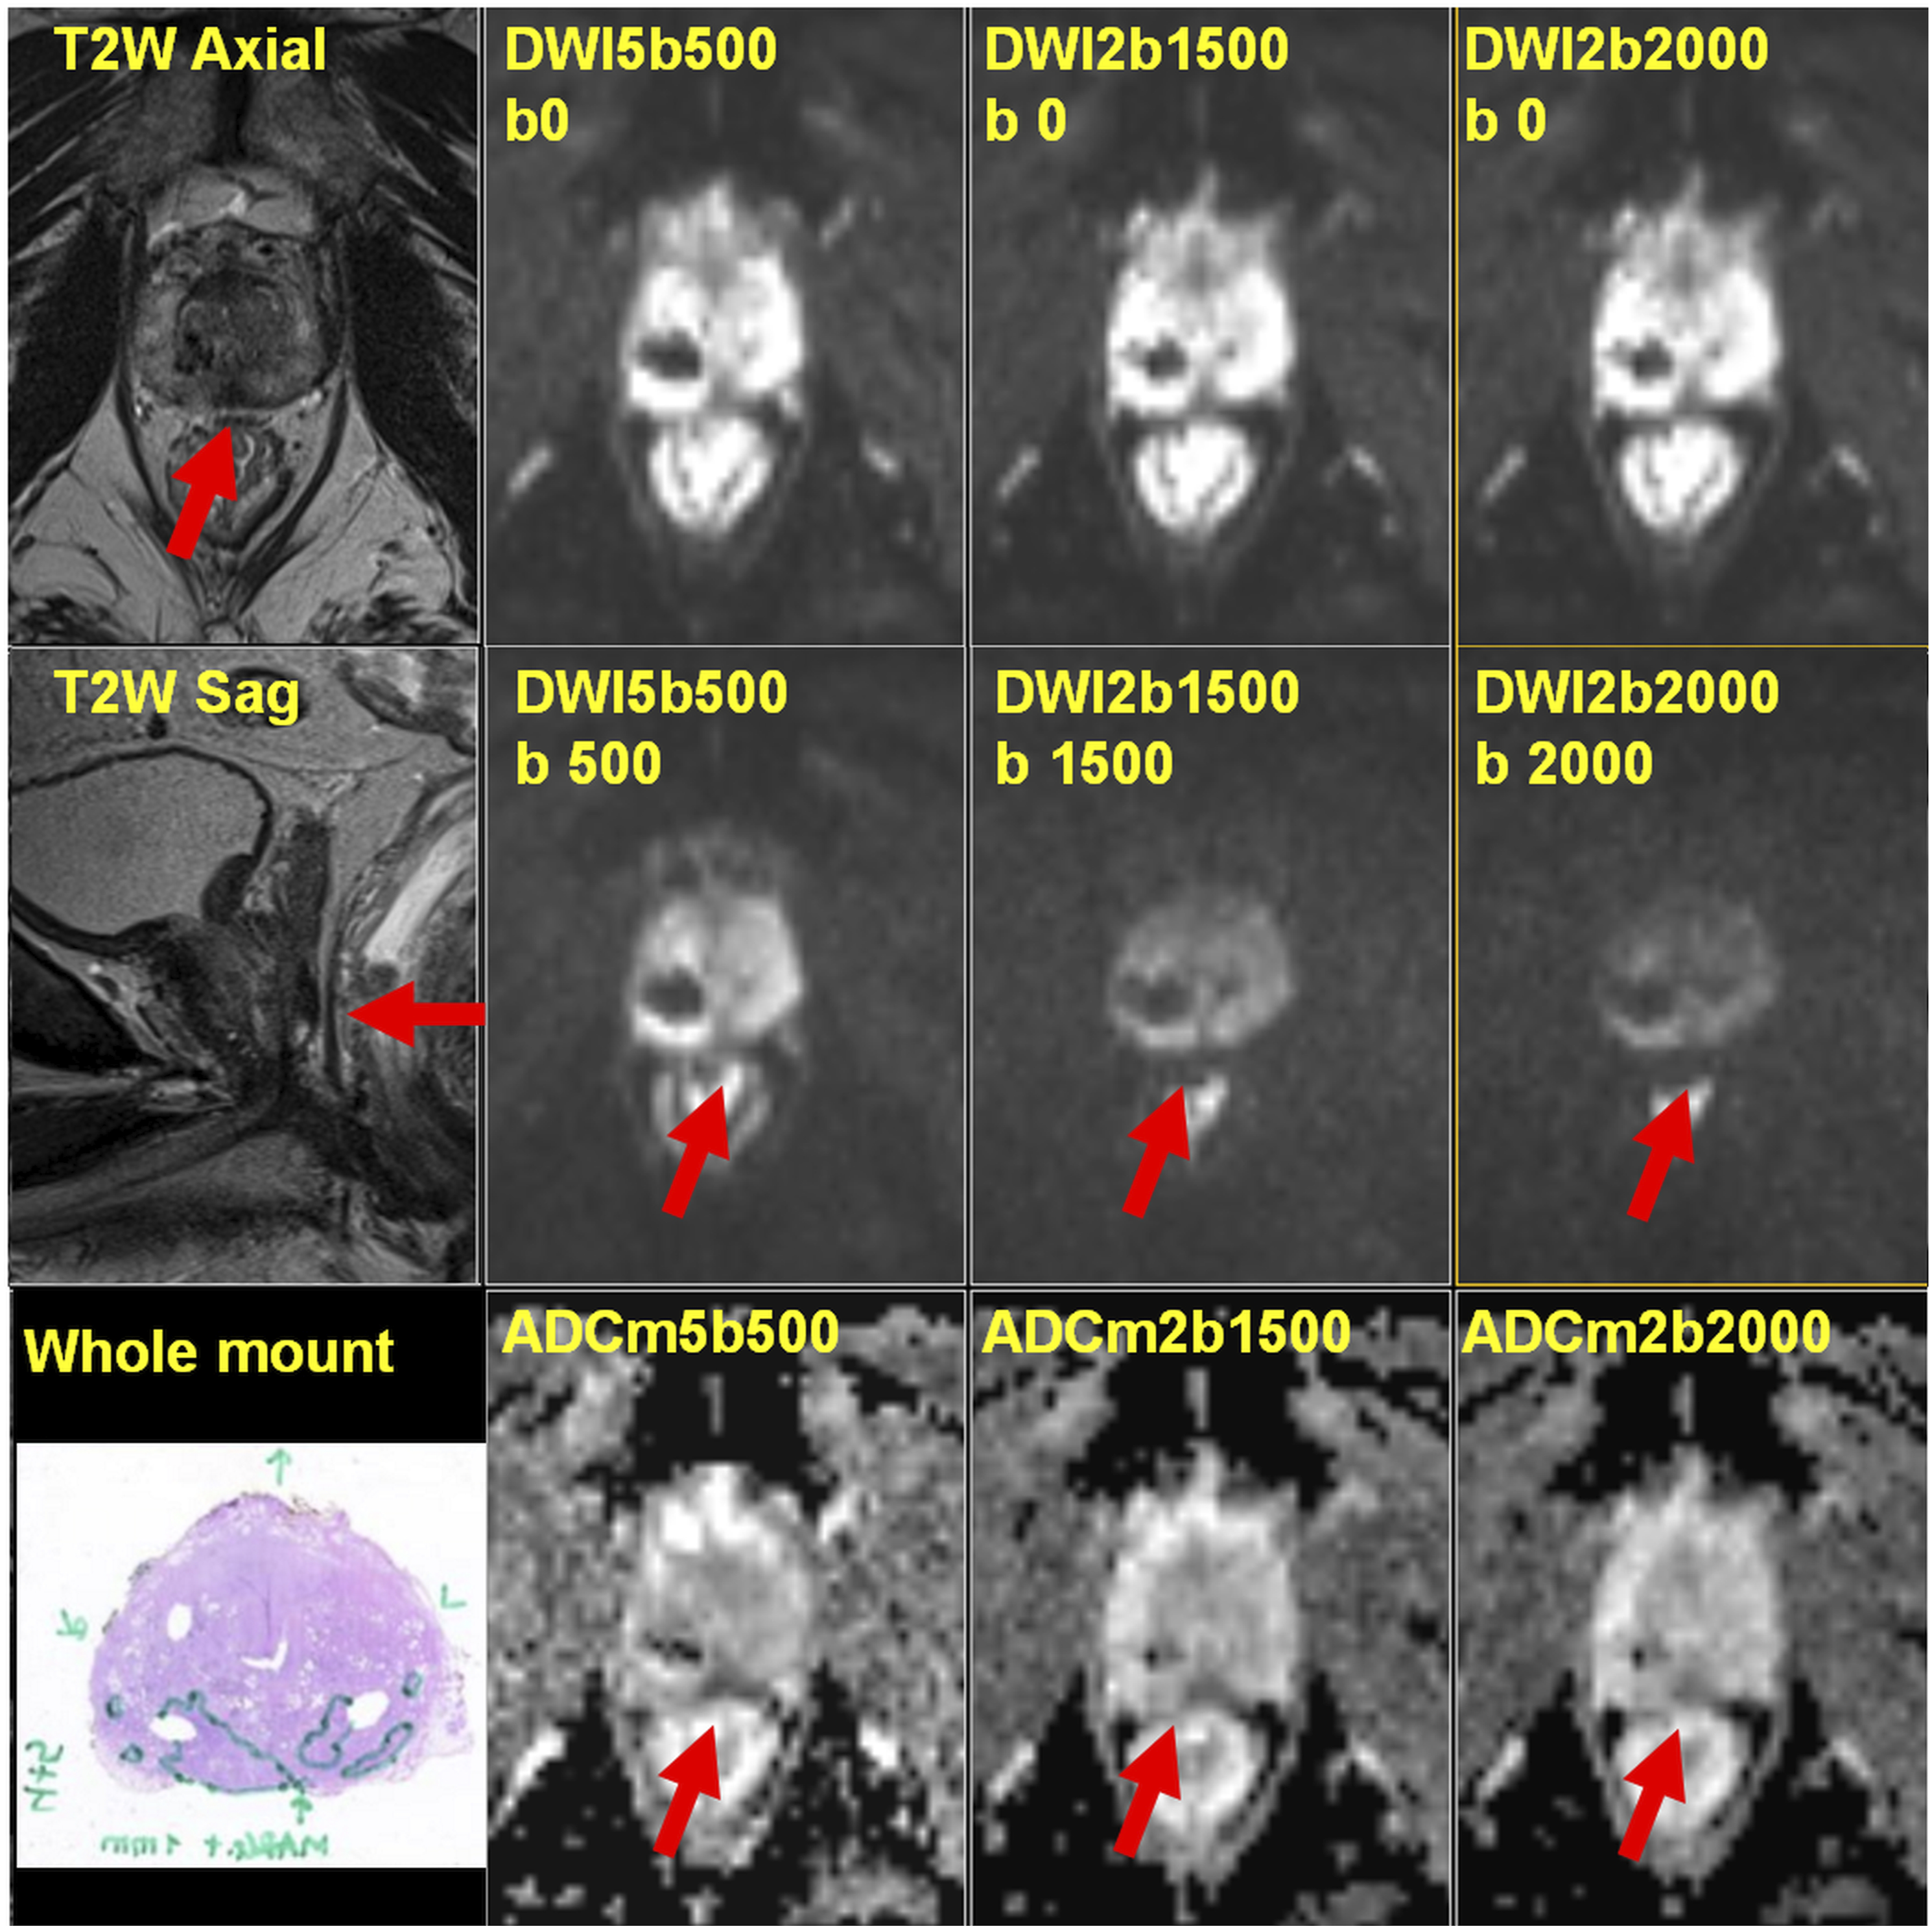

Summary
In this pictorial review, we present imaging findings from men enrolled in the IMPROD trial which included 161 consecutive men who underwent IMPROD bpMRI followed by biopsy at the time of clinical suspicion of PCa. As one can see in this review, even such a small dataset can serve as a valuable tool for becoming familiar with prostate MRI and establishing a basis for reporting prostate MRI performed without an intravenous contrast agent in men with a clinical suspicion of PCa. The IMPROD and MULTI-IMPROD trial servers (http://petiv.utu.fi/improd/and http://petiv.utu.fi/multiimprod
Supporting material is provided at http://mrc.utu.fi/data
Footnotes
Declaration of conflicting interests
The author(s) declared no potential conflicts of interest with respect to the research, authorship, and/or publication of this article.
Funding
The author(s) received no financial support for the research, authorship, and/or publication of this article.