
Abstract
Background
The pathology of Parkinson’s disease leads to morphological changes in brain structure. Currently, the progressive changes in gray matter volume that occur with time and are specific to patients with Parkinson’s disease, compared to healthy controls, remain unclear. High-tesla magnetic resonance imaging might be useful in differentiating neurological disorders by brain cortical changes.
Purpose
We aimed to investigate patterns in gray matter changes in patients with Parkinson’s disease by using an automated segmentation method with 7-tesla magnetic resonance imaging.
Material and Methods
High-resolution T1-weighted 7 tesla magnetic resonance imaging volumes of 24 hemispheres were acquired from 12 Parkinson’s disease patients and 12 age- and sex-matched healthy controls with median ages of 64.5 (range, 41–82) years and 60.5 (range, 25–74) years, respectively. Subgroup analysis was performed according to whether axial motor symptoms were present in the Parkinson’s disease patients. Cortical volume, cortical thickness, and subcortical volume were measured using a high-resolution image processing technique based on the Desikan-Killiany-Tourville atlas and an automated segmentation method (FreeSurfer version 6.0).
Results
After cortical reconstruction, in 7 tesla magnetic resonance imaging volume segmental analysis, compared with the healthy controls, the Parkinson’s disease patients showed global cortical atrophy, mostly in the prefrontal area (rostral middle frontal, superior frontal, inferior parietal lobule, medial orbitofrontal, rostral anterior cingulate area), and subcortical volume atrophy in limbic/paralimbic areas (fusiform, hippocampus, amygdala).
Conclusion
We first demonstrated that 7 tesla magnetic resonance imaging detects structural abnormalities in Parkinson’s disease patients compared to healthy controls using an automated segmentation method. Compared with the healthy controls, the Parkinson’s disease patients showed global prefrontal cortical atrophy and hippocampal area atrophy.
Introduction
Widespread cortical and subcortical atrophic changes in Parkinson’s disease (PD) patients have been observed in several structural magnetic resonance imaging (MRI).1–6 These results have been confirmed by pathological studies, which have shown that the degenerative process is first detectable in the brain stem, subsequently extends into the limbic system and finally progresses to increasingly involve the cerebral cortex. 7
In recent years, there has been growing interest in gray matter (GM) volume and white matter (WM) density changes in PD patients, including voxel-based morphometry and surface-based techniques. These methods have been used to assess cortical GM changes in patients with PD. Several cross-sectional studies have been conducted to compare the differences between patients with PD and healthy controls (HCs). However, the results of these studies are inconsistent. These inconsistencies may result from the inclusion of a small number of subjects from single centers; heterogeneity in patient characteristics, including age, disease duration, and disease severity; and differences in the variable covariates used in volumetric analyses, which may confound the results of between-group differences. Therefore, brain volume changes in patients with PD need to be examined further. 7-tesla (T) MRI is useful in detecting structural changes in cortical as well as subcortical regions. A stronger static magnetic field leads to a higher signal-to-noise ratio, which reduces the measurement time and increases the spatial resolution, as well as improves the image contrast of tissues because of increased sensitivity to susceptibility.
Currently, 7-T MRI is used to study patients with PD. However, the automated segmentation method has not yet been reported. Thus, in this study, we investigated the parcellation of brain structures and provided corrected reconstructions in high-resolution images taken using 7-T MRI. We evaluated the volume of several cerebral regions on MRI scans in patients with PD and HCs by using automated segmentation software. 8 We hypothesized that PD patients would exhibit characteristic cortical and subcortical atrophy compared to HC which has not been seen in previous studies.
Material and Methods
Participants
The patients were recruited from Chungbuk National University Hospital. All patients were examined by a movement disorder specialist (YS Park). PD was diagnosed clinically on the basis of the United Kingdom Parkinson’s Disease Society Brain Bank clinical diagnostic criteria for PD. 9 All PD patients had a positive response to levodopa. The severity and stage of parkinsonism in each patient was assessed by the modified Hoehn and Yahr (H–Y) scale 10 and the Movement Disorder Society-sponsored revision of the Unified Parkinson’s Disease Rating scale (MDS-UPDRS) 11 in the “on” state.
Twelve patients diagnosed with PD (median age = 64.5 years; range = 41–82 years) and 12 age- and sex-matched HCs (median age = 60.5 years; range = 25–74 years) were enrolled in this study.
Subgroup analysis was performed according to whether axial motor symptoms were present. We defined the presence of axial symptoms when they have two or more points in the composite score of six items in the MDS-UPDRS III suggestive axial motor features: speech, rigidity of the neck, arising from a chair, posture, gait, and postural stability.
Individuals with MRI signals of abnormal intensity, a history of other neuropsychiatric disorders, alcohol or drug abuse, and clinically significant systemic diseases were excluded. The informed consent was obtained from all participants. All study protocols were approved by the Institutional Review Board of Chungbuk National University Hospital (No. 2016-12-009-005), and informed consent was obtained from all participants.
MRI acquisition
Magnetic resonance images from all subjects were acquired using a 7-T MRI system (Philips Healthcare, Cleveland, OH, USA) with a 32-channel head coil (Nova Medical, Wilmington, MA, USA). Three-dimensional anatomical brain scans were acquired using a magnetization-prepared rapid-acquisition gradient-echo sequence-induced T1-weighted imaging system with the following settings: repetition time (TR) = 4.4 ms, echo time (TE) = 2.2 ms, slice thickness = 0.5 mm, in-plane resolution = 0.5 × 0.5 mm2, matrix size = 432 × 432, number of axial slices = 432, and acquisition time (TA) = 5 min 57 s.
Image analysis
To acquire surface-based high-resolution images, modifications to the default reconstruction settings were required, and the nonparametric, nonuniform intensity, normalization (N3) algorithm 12 for inhomogeneity correction for 7-T MRI was used. Cortical reconstruction and volumetric segmentation were carried out using FreeSurfer software version 6.0. After cortical reconstruction, the GM cortex was parcellated with allocations for labeling with the Desikan-Killiany-Tourville (DKT) neuroanatomical atlas, which divided the cortex into 31 cortical regions per hemisphere, as shown in Fig. 1.

Representative MRI images taken using 7-T MRI. (a) Brain structures from the medial aspect view, (b) anterior aspect view, and (c) coronal view of patients with PD in images taken with 7-T MRI and processed with N3 algorithms. The gray matter (GM) thickness of patients with PD was calculated using these algorithms.
Statistical analysis
Statistical evaluations were performed using GraphPad Prism 6 (GraphPad Software, San Diego, CA, USA). The data are shown as the means ± SDs. Normality tests were done using Kolmogorov–Smirnov method. The independent t test was applied when samples had a standard normal distribution, while two- or multiple-independent samples nonparametric test (Mann–Whitney U test) was applied when samples did not have a standard normal distribution. We used the chi-squared test to examine differences between categorical variables. Effect sizes are reported in terms Cohen’s d where appropriate. The threshold for significant differences was a P-value of < 0.05.
Results
Clinical characterization and demographics
There were no significant differences in age, sex, or disease duration between the PD and HC groups. In the subgroup analysis, there was no significant difference in age, sex, disease duration, the MDS-UPDRS III score, or the H–Y stage between the “PD with axial symptoms” group and the “PD without axial symptoms” group. Detailed characteristics are shown in Tables 1 and 2.
Demographic and clinical characteristics of Parkinson’s disease (PD) patients and healthy controls (HCs).
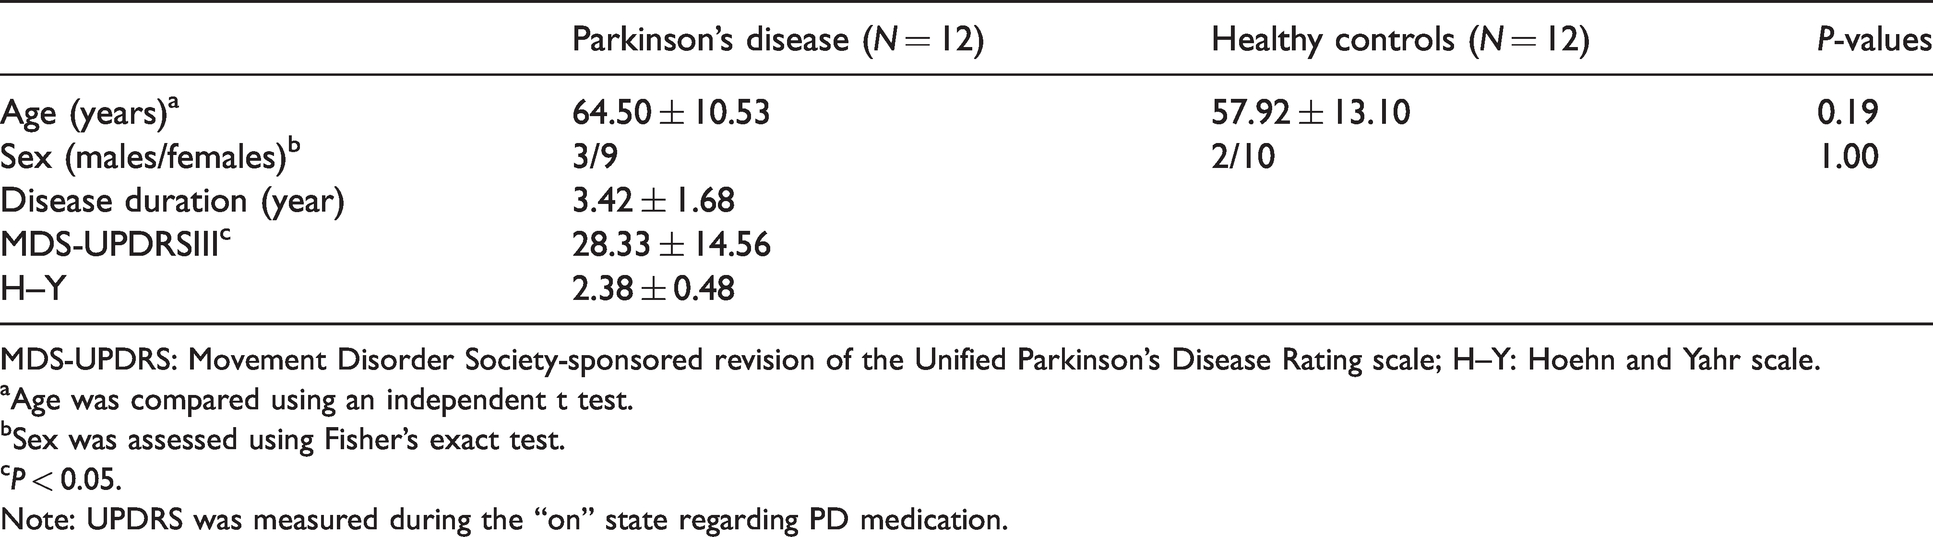
MDS-UPDRS: Movement Disorder Society-sponsored revision of the Unified Parkinson’s Disease Rating scale; H–Y: Hoehn and Yahr scale.
Age was compared using an independent t test.
Sex was assessed using Fisher’s exact test.
P < 0.05.
Note: UPDRS was measured during the “on” state regarding PD medication.
Demographic and clinical characteristics of Parkinson’s disease patients with and without axial symptoms.

MDS-UPDRS: Movement Disorder Society-sponsored revision of the Unified Parkinson’s Disease Rating scale; H–Y: Hoehn and Yahr scale.
Age, duration, and the MDS-UPDRS III and H–Y scales were compared using the Mann-Whitney U test.
Sex was assessed using Fisher’s exact test.
P < 0.05.
Note: UPDRS was measured during the “on” state regarding PD medication.
Comparison of cortical volume between the patients with PD and HCs
The patients with PD showed significant global cortical volume loss not only in prefrontal areas, including the left (Lt.) rostral middle frontal (P = 0.047, Cohen’s d = 0.86), Lt. superior frontal (P = 0.028, Cohen’s d = 0.96), right (Rt.) rostral anterior cingulate (P = 0.046, Cohen’s d = 0.86), and Rt. medial orbitofrontal areas (P = 0.049, Cohen’s d = 0.85), but also in other areas, including the Lt. fusiform (P = 0.034, Cohen’s d = 0.92) and Rt. inferior parietal areas (P = 0.023, Cohen’s d = 1.00). There were no significant differences in any of the other gyral-based regions of interest (ROIs) in either hemisphere according to the DKT atlas (Table 3, Fig. 2(a) to (f)).
Comparison of cortical volume, cortical thickness, and subcortical volume between the PD and HC groups.

NS: not significant; PD: Parkinson’s disease; HC: healthy control.
Notes: The PD and HC groups were compared using the independent t test, and nonparametric data analysis was performed using the Mann–Whitney U test. The thresholds of significance were as follows: *P < 0.05, *P < 0.01, and **P < 0.001.

Comparison of GM volume between PD patients and controls, (a) to (f); comparison of GM thickness between PD patients and controls, (g) and (h); comparison of subcortical volume between PD patients and controls, (i) to (m); comparison of GM volume between PD patients with and without axial symptoms, (n); and comparison of subcortical volume between PD patients with and without axial symptoms, (o).
Comparison of cortical thickness between the patients with PD and HCs
The patients with PD showed significant cortical thinning in the limbic/paralimbic areas: Lt. fusiform (P = 0.049, Cohen’s d = 0.85) and Rt. parahippocampal areas (P = 0.018, Cohen’s d = 1.04). There were no significant differences in any of the other gyral-based ROIs in either hemisphere according to the DKT atlas (Table 3, Fig. 2(g) and (h)).
Comparison of subcortical volume between the patients with PD and HCs
Subcortical atrophy around limbic/paralimbic areas was observed. The volumes of the Rt. hippocampus (P = 0.005, Cohen’s d = 1.36) and Rt. amygdala (P = 0.021, Cohen’s d = 1.05) were smaller in the patients with PD than in the HCs. The patients with PD showed significant volume loss in the Lt. cerebellar cortex (P = 0.013, Cohen’s d = 1.11), Rt. cerebellar WM (P = 0.045, Cohen’s d = 0.92), and Rt. cerebellar cortex (P = 0.004, Cohen’s d = 1.34). Other regions showed no significant differences in any of the other gyral-based ROIs in either hemisphere according to the DKT atlas (Table 3, Fig. 2(i) to (m)).
Comparison between the groups of PD patients with and without axial motor symptoms
The PD patients with axial symptoms showed significant cortical and subcortical atrophy in the Rt. paracentral area (P = 0.03, Cohen’s d = –1.49) and corpus callosum central area (P = 0.03, Cohen’s d = –1.52). There were no significant differences in any of the other gyral-based ROIs in either hemisphere according to the DKT atlas (Fig. 2(n) and (o)).
Discussion
We have found that 7-T MRI detects structural abnormalities in PD patients compared to HCs using an automated segmentation method. Previous studies on cortical atrophy in PD patients have reported that various parts of the brain are affected. However, the studies have yielded inconclusive findings,13,14 and earlier longitudinal studies have assessed only global measures such as whole brain atrophy rates. 15 To date, the only two longitudinal studies on cortical thickness have been conducted, and they are limited by their relatively small sample sizes 16 and heterogeneous PD cohorts. 17
Nevertheless, there are some patterns in atrophy: limbic/paralimbic areas were affected in the early stages of PD, while neocortical areas, such as the temporal and frontal cortices, became more affected as disease severity increased.
To date, the MRI detection rate of purely intracortical lesions has been disappointingly low.18,19 However, 7-T MRI is feasible and can detect cortical abnormalities fairly well.20–23 In patients with PD, which is long-standing chronic progressive disease, subtle volumetric changes can be detected better by 7-T MRI than by conventional MRI in accordance with the DKT protocol. Most of the current research is related to hardware improvements and sequence optimization for diagnostic examinations to overcome limitations associated with inhomogeneous transmit fields, a large amount of artifacts, and poor absorption rate.24,25
Regarding inhomogeneity, 7-T MRI negatively impacts structure analysis. The N3 method may be a useful tool for bias field correction to overcome limitations in 7-T MRI analysis. Intensity inhomogeneity correction is a necessary preprocessing step to obtain better image segmentation. 26
Our methods lie in developing methods for normalizing images to ensure that patients with PD could be compared with HCs and subgroups of patients with PD could be compared. This method consisted of the N3 algorithm, which was quantified by a comparison with the standardized area through human brain mapping, and reduced bias.
The DKT27 adult cortical parcellated atlas is the successor to the Desikan-Killiany atlas, from which some regions with unclear or arbitrary boundaries were removed and many existing boundaries were revised to conform to sulcal fundi. This modified version provides greater anatomical consistency across individuals because the landmarks are clearer and more reproducible. The use of sulcal-based landmarks also optimizes the applicability of surface-based labeling, such as that performed in FreeSurfer. 8
Any automated labeling method can be used to initialize the labels for further editing by a human. 27 In this study, FreeSurfer performed well for registration-based labeling, as its classifier uses geometric properties, such as local curvatures, that are similar to those of our DKT protocol, and it offers a good interface for editing labels. 28
Neurodegeneration is expected to involve the prefrontal cortex in Braak’s stage 4/5. 29 Structural changes in the frontal lobe have been hypothesized to contribute to dysexecutive syndrome,4,30,31 which is the hallmark symptom of cognitive impairment in early PD patients and has been attributed to functional derangement in specific prefrontal cortex-striatal circuits. 32 In our study, significant volume loss of the hippocampus and surrounding regions was observed in the PD patients.
Thus, through these neuronal loops, dopaminergic deficits can indirectly impair frontal functions. Although the caudate nucleus did not show a significant difference in our results, the results of our study are thought to indicate dopaminergic deficits in the fronto-striatal network of patients with PD.33,34
The cerebellum is increasingly being recognized to play an important role in the pathology of PD. 35 Both functional and structural abnormalities of the cerebellum in PD patients have received an increasing amount of attention. Our findings are consistent with those in previous studies supporting cerebellar involvement in the pathology of PD.
The analysis of morphometric associations of GM with clinical subdomains in PD patients is a logical and powerful method of identifying functionally meaningful brain structural patterns that may inform PD biotypes. However, relatively little attention has been paid to studying the relationship between MRI GM intensity changes and clinical subdomains in PD patients. Furthermore, previous studies have shown inconsistent findings.36,37
In our study, the Rt. paracentral area and corpus callosum in the “PD with axial symptoms” group showed significant atrophy. Considering the function of these areas, a loss of WM integrity in the corpus callosum and paracentral atrophy may be associated with axial symptoms of PD.
We hypothesized that 7-T MRI could produce PD patient’s characteristic cortical and subcortical atrophy by using with DKT atlas and N3 algorithm. Although the sample size of this study is small, the results deserve consideration because no differences in these areas between the PD and HC groups were detected.
The present study has some limitations. First, the number of subjects in both the PD and HC groups was relatively small, which was the reason we used nonparametric, individual analyses instead of general linear model group analysis. We need to use larger sample sizes in future studies. Second, even though various normalization and correction methods were used, measurement imprecision due to changes in the position of the object with respect to the scanner can be pronounced if the structure being measured is relatively small and the imaging slices are fairly thick. 38 Third, advanced PD patients were not included due to the high risk of severe motion artifacts and difficulty in performing long-term examinations; therefore, this study analyzed relatively mild symptoms of PD. Compared with individuals with mild stages of PD, those with advanced stages of PD can show more severe atrophy and atrophy in other areas. In future research, we should conduct longitudinal observations of changes in PD patients.
In conclusion, we observed that GM volume in global cortical and subcortical lesions is smaller in PD patients than in HCs according to 7-T MRI and high-resolution images, which were processed with the N3 algorithm for MRI inhomogeneity correction. This study is the first clinical study in which high-resolution MRI and a surface-based automated segmentation method was used to assess PD, a neurodegenerative disease. Compared with the HCs, the PD patients showed global prefrontal cortical atrophy, limbic/paralimbic area atrophy. Compared with conventional MRI, 7-T MRI with the DKT protocol can be more useful to detect long-standing subtle volumetric changes in earlier stages of PD.
Footnotes
Author roles
Conception and design: BHO, HCM, and YSP. Acquisition of data, analysis, and interpretation: BHO, HCM, CJC, and YSP. Writing of the article: BHO, HCM, YSP, and AK. Critical review of the article: BHO, HCM, and YSP. Final approval of the article for publication: YSP. Agreed to be accountable for all aspects of the work: BHO, HCM, and YSP.
Acknowledgments
We thank Hyun-Jeong Kim (PA) and KBSI members for allowing and setting up the 7-T MRI study. All images were obtained using an ultrahigh field 7-T MRI in KBSI.
Declaration of Conflicting Interests
The author(s) declared no potential conflicts of interest with respect to the research, authorship, and/or publication of this article.
Funding
This work was supported by the National Research Foundation of Korea (NRF-2016H1D5A1908909). This work was supported in part by Korea Basic Science Institute (KBSI) grant by T36800,T38401.
Supplemental Material
Supplemental material for this article is available online.
References
Supplementary Material
Please find the following supplemental material available below.
For Open Access articles published under a Creative Commons License, all supplemental material carries the same license as the article it is associated with.
For non-Open Access articles published, all supplemental material carries a non-exclusive license, and permission requests for re-use of supplemental material or any part of supplemental material shall be sent directly to the copyright owner as specified in the copyright notice associated with the article.