
Abstract
Background
Limited reliability data exist for evaluation of spinal edema changes on magnetic resonance imaging (MRI) with short tau inversion recovery (STIR) sequences.
Purpose
To assess the inter-observer reliability for evaluation of STIR signal increase related to Modic changes (MCs) on MRI of the lumbar spine.
Material and Methods
We prospectively included 120 patients imaged to confirm their eligibility for the AIM (Antibiotics In Modic changes) trial. Three experienced radiologists independently evaluated MCs on T1-/T2-weighted fast spin-echo images and subsequently MC-related STIR signal increases. Inter-observer reliability was analyzed at four endplates (L4–S1) by calculating kappa values and means of differences with 95% limits of agreement.
Results
Overall agreement (mean Fleiss’ kappa for all endplates and observers) was very good for presence of STIR signal increase (0.86), and moderate for its categorized height (0.51), anteroposterior extent (0.48), and volume (0.56). For height of region with STIR signal increase measured in % points of vertebral body height, the largest mean of differences was 6.9 and widest range for limits of agreement was ±22.3 for all endplates combined. The corresponding numbers were 11.2 ± 34.5 for anteroposterior extent of the STIR signal increase measured in % points of anteroposterior endplate diameter and 0.9 ± 7.6 for its maximum measured intensity on a % point scale (0% = normal vertebral marrow intensity, 100% = cerebrospinal fluid intensity).
Conclusion
Inter-observer reliability was very good for the presence and intensity of MC-related STIR signal increases, and moderate for their size.
Introduction
Short tau inversion recovery (STIR) sequences are widely used in magnetic resonance imaging (MRI) to evaluate edematous changes in the skeleton, including the spine. Despite widespread use, limited reliability data exist for spinal evaluations with STIR or other fluid-sensitive fat-suppressed series. Such data were included in articles on spondylarthritis (1–5), fractures (6), Modic changes (MCs) (7), hemangiomas (8), and pedicle screw loosening (9). However, all but one (6) of these reliability studies had only two observers, most (1,3–5,7–9) had small patient samples (n = 25–41), only one (8) included measurements (of signal intensities); the spondylarthritis studies were limited to lesion detection (1–5). Reliability estimates differed widely in these heterogeneous studies where radiologists and non-radiologists interpreted various fat-suppressed 1.5-T or 3-T series. More comprehensive reliability data are needed for radiologists’ lumbar spine evaluations with STIR.
There has been increasing focus on MCs in recent years. MCs are signal changes in the vertebral bone marrow extending from the endplate and are classified into types I (edema type), II (fatty type), and III (sclerotic type) based on T1-weighted (T1W) and T2-weighted (T2W) series (10–12). STIR series are sensitive to edema and are highly relevant for evaluation of MCs. The association between MCs and pain is inconsistent (13–16), but edema type MCs might be symptomatic (17–19). Mechanical, autoimmune, and infectious explanations for MCs have been proposed (20), and various treatments have been and are being tested (21–34). Reliable evaluation of the STIR findings is required to validate their relevance to symptoms and treatment (35–37).
Clinicians and researchers evaluate MCs with a combination of MRI series. The reliability is mostly well described for evaluations with non-fat-suppressed T1W/T2W sequences (38–43), but not for evaluations with fat-suppressed, fluid-sensitive series (7). The primary aim of this study was to assess the inter-observer reliability for evaluation of STIR signal increase related to MCs on MRI of the lumbar spine. For comparison, we also report the inter-observer reliability for the evaluation of these MCs on T1W/T2W fast spin-echo images.
Material and Methods
This reliability study was based on a study-specific MRI of a consecutive subsample (n = 120; 72 women, 48 men; age range = 25–64 years; mean age = 45 years) with chronic low back pain considered for inclusion in the AIM (Antibiotics In Modic changes) trial (32). Inclusion required presence of type I and/or type II MCs at the level of an MRI-confirmed lumbar disc herniation within the preceding two years. All eligibility criteria are listed in the Appendix (Suppl. Table 1). Patients preliminarily eligible for the trial based on these criteria and findings on an existing clinical MRI (n = 220) underwent the new study-specific MRI to confirm or reject their eligibility. All participants included in the study provided written informed consent. The present report adheres to the guidelines for reporting reliability and agreement studies (44).
Images
The 120 study-specific MRI examinations were performed from 15 June 2015 to 2 September 2016 at five centers in Norway, using identical protocols and 1.5-T scanners (Siemens Magnetom Avanto B19). The present study was based on sagittal T1W and T2W fast spin-echo images (=T1/T2) and sagittal STIR images (Table 1).
MRI parameters for sagittal fast spin-echo T1W, T2W, and STIR images of the lumbosacral spine.
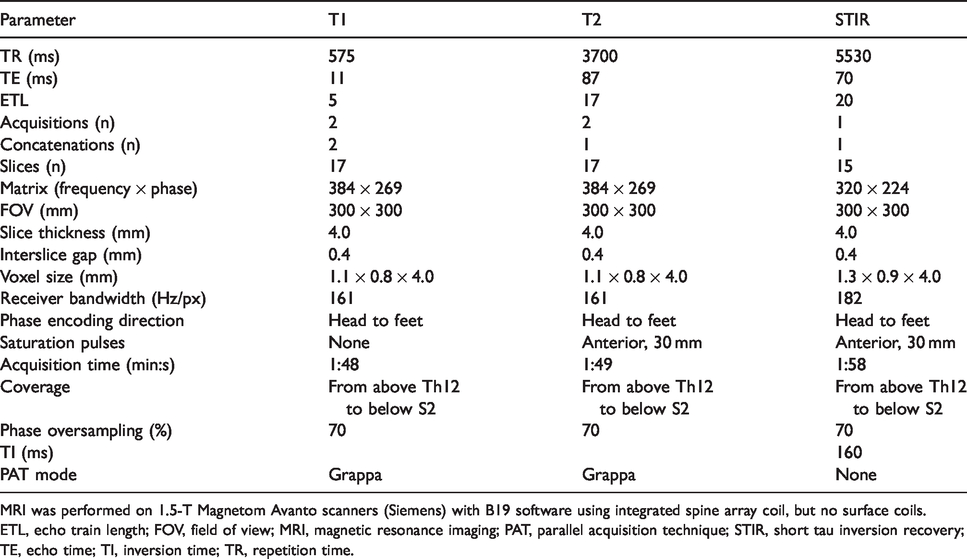
MRI was performed on 1.5-T Magnetom Avanto scanners (Siemens) with B19 software using integrated spine array coil, but no surface coils.
ETL, echo train length; FOV, field of view; MRI, magnetic resonance imaging; PAT, parallel acquisition technique; STIR, short tau inversion recovery; TE, echo time; TI, inversion time; TR, repetition time.
Evaluation
Three radiologists, all with >10 years of experience in musculoskeletal MRI, independently evaluated the images. The first observer to open the MRI examination saved a mark on the lowest lumbar disc level. All observers reported this level as L5/S1. First, MCs were rated on T1/T2, blinded to other sequences. Later the observers rated STIR findings and decided whether any increased STIR signal was related to an MC visible on T1/T2. The observers were blinded to clinical outcome but knew that patients were preliminarily eligible for the trial. To align their understanding of procedures and rating criteria, the observers rated and discussed MCs and STIR findings in a pilot study (32 MRIs not included in the main study).
On T1/T2, we defined MCs as signal changes in the vertebral bone marrow extending from the endplate, and based rating criteria for MC type and size on prior work (10,11,38,45) (Table 2). Only T1/T2 findings defined MC types I, II and III, not STIR findings. Not recorded as MCs were: (i) changes separated from the endplate; (ii) roundly shaped fatty changes abutting the endplate with a smaller base than height (more likely focal fatty marrow or hemangiomas); and (iii) changes extending through the endplate (Schmorl’s hernias).
Criteria for evaluating MCs and related STIR signal increases.

*In S1 laterally, if the image intended for measuring vertebral body height does not show the S1/S2 interface, the next more medial image is used for this measurement.
AP, anteroposterior; CSF, cerebrospinal fluid; MC, Modic change; ROI, region of interest; STIR, short tau inversion recovery.
On STIR, we defined MC-related signal increase as visible increase compared to normal vertebral bone marrow, formed and located as an MC and/or located in or abutting a region with MC on T1/T2 (and not located in a likely hemangioma). MC-related STIR signal increase was evaluated for presence, height, anteroposterior (AP) extent, volume, and maximum intensity (Table 2). STIR signal decrease was not evaluated. STIR signal intensity was measured in the region with most intense MC-related STIR signal, in the cerebrospinal fluid (CSF) and in normal vertebral body marrow (Table 2, Fig. 1). The measurements were made in circular regions of interest available in our PACS with size 25 mm2 (used for most intense MC-related STIR signal and CSF) and 44 mm2 (used for normal vertebral body marrow) (Fig. 1). Care was taken to avoid surrounding structures, e.g. intervertebral discs, nerve roots, central vertebral vein. Intensity of CSF varied between levels and was measured at the same disc level as the MC-related STIR signal. Maximum intensity of the MC-related STIR signal (“Stir”) in % points on a scale from normal vertebral body intensity (“Body,” 0%) to CSF intensity (“CSF,” 100%) was calculated as ((Stir – Body)/(CSF – Body)) × 100.

(a–c) STIR signal increases related to MCs. A 48-year old woman with type II MCs and MC-related STIR signal increases superior and inferior to the L5/S1 disc. The figure shows measurements of (a) height, (b) AP extent, and (c) maximum intensity of the STIR signal with vertebral body and CSF intensities for reference. (c) The circular regions of interest used for measurements are visible with their sizes and gray-scale values, from left to right: maximum intensity (area = 24.9 mm2, average = 131.1 GY), vertebral body intensity (area = 44.2 mm2, average = 45.05 GY), and CSF intensity (area = 24.9 mm2, average = 360.8 GY). Corresponding T1W/T2W fast spin-echo images show type II MCs. Note the diffuse outline of the STIR signal. Note also the thin hyperintense zone on STIR near normal endplates (arrow), which may be mistaken for an AP continuation of an MC-related STIR signal increase at endplates with such increase. AP, anteroposterior; CSF, cerebrospinal fluid; MC, Modic change; STIR, short tau inversion recovery.
Statistical analyses
For each endplate L4–S1, we calculated Fleiss’ kappa for all observers and Cohen’s kappa for each observer pair. Kappa was unweighted for dichotomous variables and linearly weighted for ordinal variables. McNemar’s test was applied to compare the prevalence of findings between observers. We computed means of differences between observers with 95% limits of agreement for height and AP extent of findings in % points of vertebral body height and AP extent, and for STIR signal intensity in % points on the scale from normal vertebral body intensity (0%) to CSF intensity (100%). We used sample size weighted means and pooled limits of agreement from all endplates to compute the mean differences between the observers with 95% limits of agreement for all endplates. The 95% limits of agreements represent the limits within which 95% of the differences are expected to occur. We used MedCalc 17.6 (MedCalc Software) to compute means, R 3.5 (R Foundation for Statistical Computing) for kappa and weighted means, and Matlab 9.5 (Mathworks) to derive forest plots.
Only data from L4/L5 and L5/S1 were analyzed, due to <10% prevalence of MCs at higher levels. Kappa is usually not reported for findings with prevalence <10%, as very low prevalence can lead to very low kappa values despite very high actual agreement (46). Kappa was interpreted as: k ≤ 0.20 = poor; 0.21–0.40 = fair; 0.41–0.60 = moderate; 0.61–0.80 = good; and 0.81–1.00 = very good agreement beyond chance (47).
Sample size
Assuming a finding has a prevalence of 30%, 85 patients are needed to detect (β = 0.2, two-sided α = 0.05) an unweighted pairwise kappa value of 0.70 as significantly larger than 0.40 (46). We used three observers and 120 patients to further improve the power and increase the size of subgroups. In general, at least 50 individuals are recommended in reliability studies (48).
Results
The observers reported MC-related STIR signal increases regardless of MC type on T1/T2. There were no missing data.
Categorical STIR variables
Overall agreement between the three radiologists (mean Fleiss’ kappa) was very good for presence of MC-related STIR signal increase (0.86), and moderate for its height (0.51), AP extent (0.48), and volume (0.56) (Fig. 2). Kappa values were generally lower at L5/S1 inferior to disc.

Categorical STIR variables: forest plot for kappa values with 95% CIs. The figure shows Fleiss’ kappa values with 95% CIs for all observers for variables describing MC-related STIR signal increases superior (sup) and inferior (inf) to the L4/L5 and L5/S1 discs. These variables were presence (yes/no), height (four categories), AP extent (three categories), and volume (four categories) of region with high STIR signal. Mean kappa value for agreement between all raters across all four levels L4–S1 is marked with a bold vertical line. This line and circles representing kappa values are green for kappa values >0.50 (the midpoint of the moderate agreement category) and otherwise red. AP, anteroposterior; CI, confidence interval; MC, Modic change; STIR, short tau inversion recovery.
The prevalence of STIR signal increase differed maximum 11.6% points between observers (observers A vs. B reported prevalence of 58.3% vs. 46.7% at L5/S1 inferior to disc, P < 0.001).
Mean pairwise Cohens’ kappa across all categorical STIR variables and levels indicated slightly better agreement between observers A and B (0.62) versus A and C (0.52) and B and C (0.52). Further pairwise STIR results are found in the Appendix (Suppl. Fig. 1, Suppl. Table 2).
Numerical STIR variables
For height of the region with STIR signal increase in % of vertebral body height, the largest mean of differences between observers was 6.9% points and the widest limits of agreement were ±22.3% points, based on data from all levels (Fig. 3). For AP extent of the increased STIR signal in % of AP endplate diameter, the corresponding numbers were 11.2% points ±34.5% points. For maximum intensity of the STIR signal in % on the scale from normal vertebral body intensity (0%) to CSF intensity (100%), the largest mean of differences and widest limits of agreement were 0.9% and ±7.6% points, based on data from all levels. Results for individual levels are provided in the Appendix (Suppl. Fig. 2).

Numerical STIR variables: forest plot for means of differences and limits of agreement. The figure shows mean of differences with 95% limits of agreement in observer pairs A/B, A/C, and B/C for three numerical variables describing STIR signal increases related to MCs. Each variable was evaluated at four endplates (superior and inferior to the L4/L5 and L5/S1 discs). Means for all endplates are displayed. Values are % points. Hperc denotes height of region with high STIR signal in % of the height of the vertebral body marrow; APperc denotes AP extent of the high STIR signal in % of the mid-sagittal AP diameter of the endplate; intPerc denotes maximum intensity of the STIR signal in % on a scale from normal vertebral body marrow intensity (0%) to CSF intensity (100%). AP, anteroposterior; CSF, cerebrospinal fluid; MC, Modic change; STIR, short tau inversion recovery.
Reported % points were in the range of 8–100 (mean = 43) for height, 7–100 (mean = 74) for AP extent, and 6–78 (mean = 32) for intensity of STIR signal increases.
MC evaluation on T1/T2
On T1/T2, agreement (mean Fleiss’ kappa) was very good for presence of MCs (0.88) and for presence of primary or secondary type I MCs (0.81) (Fig. 4). Mean kappa was 0.64 for height, 0.56 for AP extent, and 0.69 for volume of MCs on T1/T2. These values were 0.08–0.13 higher than the corresponding kappa values for dimensions of MC-related STIR signal increases.

Categorical MC variables on T1/T2: forest plot for kappa values with 95% CIs. The figure shows Fleiss’ kappa values with 95% CIs for all observers for variables describing MCs superior (sup) and inferior (inf) to the L4/L5 and L5/S1 discs on T1W/T2W fast spin-echo images. These variables were presence of any type of MCs (yes/no), presence of primary or secondary type I MCs (yes/no), height (four categories), AP extent (three categories), and volume (four categories) of the MCs. Mean kappa value for agreement between all raters across all four levels L4–S1 is marked with a bold vertical line. This line and circles representing kappa values are green for kappa values >0.50 (the midpoint of the moderate agreement category) and otherwise red. AP, anteroposterior; CI, confidence interval; MC, Modic change; STIR, short tau inversion recovery.
The largest difference between observers in prevalence of MCs on T1/T2 was 6.7% points (observers A vs. B reported prevalence 79.2% vs. 72.5% at L5/S1 inferior to disc, P = 0.021).
Mean pairwise Cohens’ kappa across all categorical T1/T2 variables and levels indicated similar agreement between observers A and B (0.73), A and C (0.71), and B and C (0.73).
The largest mean of differences (and widest limits of agreement) on T1/T2 were for MC height 0.7 (±17.4) % points and for AP extent of MCs 2.6 (±28.8) % points (Fig. 5). These values were smaller than the corresponding values on STIR. On T1/T2, reported % points were in the range of 5–91 (mean = 39) for height and 8–100 (mean = 78) for AP extent.

Numerical MC variables on T1/T2: forest plot for means of differences and limits of agreement. The figure shows mean of differences with 95% limits of agreement in observer pairs A/B, A/C, and B/C for two numerical variables describing MCs on T1W/T2W fast spin-echo images. Each variable was evaluated at four endplates (superior and inferior to the L4/L5 and L5/S1 discs). Means for all endplates are displayed. Values are % points. Hperc denotes height of the MC in % of the height of the vertebral body marrow; APperc means AP extent of the MC in % of the mid-sagittal AP diameter of the endplate. AP, anteroposterior; MC, Modic change.
Further T1/T2 results are detailed in the Appendix (Suppl. Figs. 3 and 4, Suppl. Table 3).
Discussion
To our knowledge, this was the first comprehensive study of the inter-observer reliability for evaluations of STIR signal increases in the vertebral bone marrow. Three radiologists evaluated MC-related high-intensity regions on STIR in 120 patients. Overall inter-observer agreement was very good for the presence of STIR signal increase and moderate for its height, AP extent, and volume. In general, % measured height of the STIR signal differed less between observers than its % measured AP extent. For its maximum intensity (on a scale of 0–100%), mean of differences was <1% points and limits of agreement within ±7.6% points.
Further, we have found only one previous study (on 25 patients) of the reliability for MC evaluations on any fat-suppressed fluid-sensitive series (7). In that study, kappa for inter-observer agreement was 0.74 for presence and 0.80 for categorized height of MC-related signal increase. Our corresponding kappa values were 0.86 and 0.51. In patients with possible vertebral fractures (6), kappa for inter-observer agreement on categorized volume of vertebral bone edema on STIR was 0.58; our value was 0.56. It was not reported in these previous studies whether kappa was weighted or categories were combined, so it is not clear whether their kappa values are comparable to ours. In line with our results for intensity measurements, inter-observer agreement was excellent for measurements of signal intensities in vertebral hemangiomas on STIR/fat-saturated T2 images (intra-class correlations of 0.97–0.99) (8).
The very good agreement on presence of STIR signal increases in our study is reassuring for clinical work and research. However, the moderate agreement on the extent of the high STIR signal is not optimal. Moderate inter-observer agreement is common in spine imaging (36,41,49,50), but it implies lowered accuracy when associations with clinical factors are sought (37). More reliable conclusive MRI findings can be based on different observers’ separate evaluations followed by their joint conclusion (51). Furthermore, in order to improve agreement between observers, reasons for disagreement should be identified and addressed.
Reasons for disagreement on extent of STIR signal increases may be diffuse outline/gradual lessening of the signals and inhomogeneous bone marrow signal, especially in S1 (where agreement was slightly poorer) (Fig. 2). The AP extent of the MC-related STIR signal often tapers gradually and may blend into a normal thin hyperintense zone beneath the bony endplate (Fig. 1). This can partly explain larger disagreement for AP extent than for height. The generally larger AP extent than height of the STIR signal is not a likely explanation, as differences in % measured AP extent of the signal were similar for small and large extents (data not shown). On T1/T2, better agreement was achieved for MC extent both in our study and between other experienced observers (36,40,49,50). Therefore, disagreement on extent of MC-related STIR signal increase is probably due to genuine difficulties in interpretation.
Our study also added new information regarding the detection of any area with type I MCs on T1/T2. Previous studies have focused on primary MC types (38–41). We found very good agreement on presence of any (primary or secondary) type I MCs. This may be partly because we rated borderline type I versus type II MCs with near isointense T1 signal (no clear edema) as type II. MCs that are isointense on T1 (and hyperintense on T2) fall outside the original definition of MC types, and it is unclear how they were classified in other studies.
The strengths of this study include the use of three observers (all experienced radiologists), a pilot study, a large sample, standardized MRI protocols and rating criteria, and inclusion of measurements. Multiple observers improved the power and the generalizability of results, and including more patients rather than more than three observers is an effective strategy for maximizing power (46). The data on reliability for T1/T2 evaluations of MCs supported the credibility of our STIR results. We also standardized MC-related STIR signal intensities against normal bone marrow and CSF at the same or a close level, since intensity values varied both between and within patients and depended on craniocaudal and AP localization.
There are also limitations to the study. It was restricted to patients with previously reported MCs and disc herniation. We would however expect similar reliability for STIR evaluations in other patients with low back pain. Intra-observer reliability was not examined; it is often better than the inter-observer reliability (41,43,49,50). A single type of 1.5-T MRI scanner was used, and the results may not be transferrable to images with a different quality or to scanners with a different field strength. Lesion volume was not measured; it was categorized by taking into account (summing up) the visually estimated affected area on all images. Although precise measurements on all images is less feasible, reliability data also for measured volume would have been useful. Finally, all observers had >10 years of experience in musculoskeletal MRI and the reliability for less specialized or less experienced radiologists is still unknown.
We propose the following implications of our results. First, radiologists can evaluate STIR signal increases in the lumbar spine based on criteria used in this study. Second, clinicians and radiologists can expect more reliable evaluation of the height versus the AP extent of a region with MC-related STIR signal increase. Third, when relevant, radiologists can grade the volume of STIR signal increases with reasonable inter-observer reliability, without performing very time-consuming measurements. Fourth, one should still attempt to improve the reliability for size evaluations of STIR signal increases in research, e.g. by joint pre-training, semi-automated lesion contouring (37), continuous volume measurements, and basing conclusive findings on multiple observers’ evaluations (51). Fifth, maximum STIR signal intensity relative to normal bone marrow and CSF is an attractive variable in further research, due to its excellent inter-observer reliability. Finally, radiologists can use criteria from this study to improve the evaluation of type I MCs on T1W/T2W fast spin-echo images.
In conclusion, the agreement between experienced radiologists was very good regarding the presence of MC-related STIR signal increase and its maximum intensity, and moderate for its extent and volume. These results provide a basis for validating the relevance of such STIR signal increases for symptoms and treatment results.
Supplemental Material
ARR902402 Supplemental material - Supplemental material for Short tau inversion recovery MRI of Modic changes: a reliability study
Supplemental material, ARR902402 Supplemental material for Short tau inversion recovery MRI of Modic changes: a reliability study by Per Martin Kristoffersen, Nils Vetti, Kjersti Storheim, Lars Christian Bråten, Mads Peder Rolfsen, Jörg Assmus and Ansgar Espeland in Acta Radiologica Open
Footnotes
Acknowledgments
The authors thank their collaborators in the AIM study group for their contributions.
Declaration of conflicting interests
The author(s) declared no potential conflicts of interest with respect to the research, authorship, and/or publication of this article.
Funding
The author(s) received the following financial support for the research, authorship, and/or publication of this article: This work was supported by the South East Norway Regional Health Authority (grant no. 2015-090) and the Western Norway Regional Health Authority (grant nos. HV 911891 and HV 911938). They had no role in study design; collection, analysis, and interpretation of data; writing of the report; or the decision to submit the report for publication.
The Regional Committees for Medical Research Ethics in Norway approved this study and the trial it was based on (REC South East, approval no. 2014/158). The trial is registered at ClinicalTrials.gov (identifier NCT02323412).
Supplemental Material
Supplemental material for this article is available online.
References
Supplementary Material
Please find the following supplemental material available below.
For Open Access articles published under a Creative Commons License, all supplemental material carries the same license as the article it is associated with.
For non-Open Access articles published, all supplemental material carries a non-exclusive license, and permission requests for re-use of supplemental material or any part of supplemental material shall be sent directly to the copyright owner as specified in the copyright notice associated with the article.