
Abstract
Background
Glaucoma is a neurodegenerative disease that affects both the retina and central visual pathway. Magnetization transfer imaging (MTI) is a sensitive magnetic resonance imaging (MRI) technique that can detect degenerative changes in the brain.
Purpose
To investigate the geniculocalcarine (GCT) and striate areas in primary glaucoma patients using region of interest (ROI) analysis of magnetization transfer ratio (MTR).
Material and Methods
Twenty patients with primary glaucoma in both eyes were compared with 31 healthy control patients. All of the participants were examined on a 3.0 T scanner using a three-dimensional T1-weighted spoiled gradient recalled acquisition (SPGR) with and without a MT saturation pulse. A two-sample t-test was used to evaluate the MTR difference between the groups. P < 0.05 was used to determine statistical significance.
Results
The MTR of the glaucoma group was lower than the healthy controls in both the bilateral GCT (t = 3.781, P = 0.001) and striate areas (t = 4.177, P = 0.000).
Conclusion
The MTR reductions in the bilateral GCT and striate areas suggest that there is GCT demyelination and striate area degeneration in primary glaucoma. These neurodegenerative effects may be induced as a direct effect of retrograde axonal degeneration along with the indirect effect of anterograde trans-synaptic degeneration.
Keywords
Introduction
Glaucoma is the second most common cause of irreversible blindness worldwide (1). It results in retinal ganglion cell (RGC) axonal degeneration and death. Recently, glaucoma has been increasingly regarded as a neurodegenerative disease that affects both the retina and the central visual pathway. Some scholars even suggest that it is essentially a central nervous disease. Degenerative changes in the lateral geniculate nucleus (LGN), geniculocalcarine (GCT), and visual cortex have been observed in glaucoma by many studies (2–13); however, the nature of glaucoma remains unknown. Whether it is an anterograde disease originating from RGC degeneration, a retrograde disease originating from the visual cortex or LGN, or a comprehensive result of both mechanisms remains controversial.
Magnetization transfer imaging (MTI) is a tissue signal selective suppression technique in magnetic resonance imaging (MRI). It is based on the magnetization transfer effect and is quantified by the magnetization transfer ratio (MTR). MTR reflects macromolecule-bound protons in different tissues and is primarily a measure of the extent of myelination, axonal integrity and macromolecules on cellular membranes in the central nervous system (14,15). MTI has proven to be sensitive for detecting morphological changes of a normal appearing brain, such as in multiple sclerosis (16–19).
However, research investigating glaucoma patients by MTI is rare. To the best of our knowledge, only Kitsos et al. evaluated the brain and optic pathway in 26 primary, open-angle glaucoma patients and discovered that the MTR in the optic chiasm, GCT, and visual cortex decreased significantly compared with the control group (20). Kitsos et al. included both MTI and conventional MRI measurements in their study, with white matter hyperintensities counting and optic nerve area measurements. In this study, we investigated whether MTR was altered in the GCT and the striate area in primary glaucoma compared with normal controls using the region of interest (ROI) analysis of MTR maps. Instead of measuring MTR of the chiasm and calcarine fissure as in Kitsos et al.’s study, we measured the MTR of GCT and the striate area with several ROIs placed and used the mean value.
Material and Methods
The research protocol was approved by the ethics committees for clinical research. All of the procedures involving the participants were conducted following the Declaration of Helsinki and institutional guidelines in compliance with the stated regulations. Written informed consent was obtained from all of the participants.
From July 2010 to July 2011, 20 participants with glaucoma (13 women, 7 men; mean age, 50.3 years; age range, 19–67 years) were recruited to participate in this study. All participants were diagnosed according to the “Clinical practice guidelines of glaucoma in China” and “The expert consensus of primary glaucoma diagnosis and therapy in China,” formulated by the Chinese Medical Association Ophthalmology Branch Glaucoma Group (21,22). There were eight cases of primary open-angle glaucoma and 12 cases of primary angle-closure glaucoma. These patients varied from the early stage of disease to advanced glaucoma. Three cases were in the acute phase, while the rest of the 17 cases were in the chronic phase, and the history was in the range of 2–8 years. The control group, 19 healthy controls (13 women, 6 men; mean age, 47 years; age range, 18–61 years) were recruited from outpatients.
The inclusion criteria were: right-handedness; the best corrected visual acuity of 1.0 in each eye without a history of ocular disease for the healthy controls; no occupied lesion or abnormal findings in conventional MR scanning; no history of neurological diseases, including cerebrovascular disease, neurodegenerative disease, and trauma; and no drug, alcohol, or addictive substance abuse. The exclusion criteria were: iridocyclitis; ocular trauma; disorders of the optic nerve (affection, inflammation, ischemia, and pressure-induced optic atrophy); age-related macular degeneration; diabetic retinopathy; and pituitary tumor.
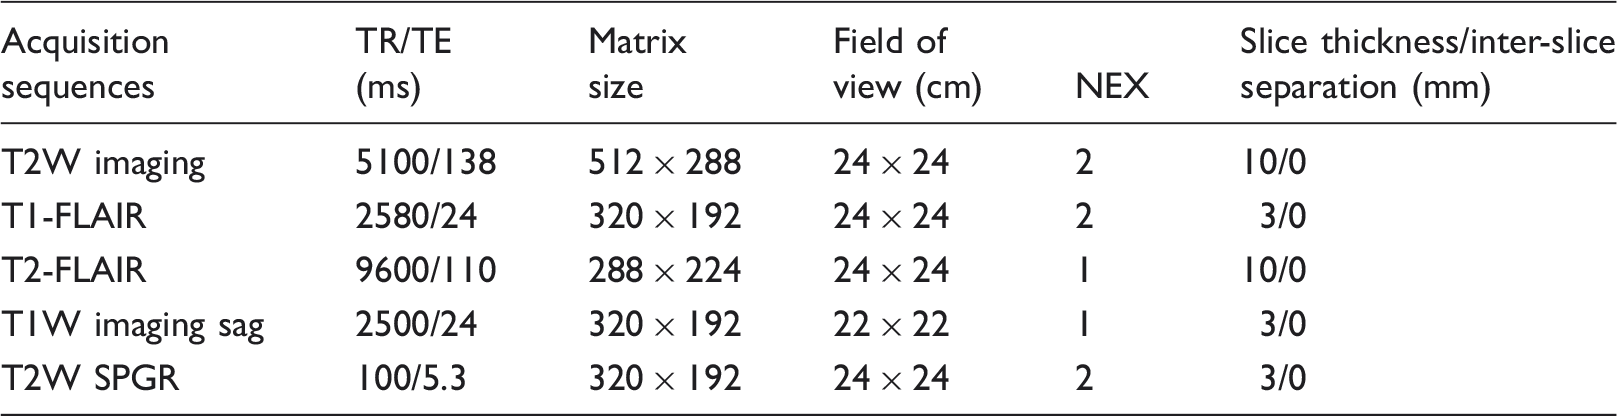
The parameters of each acquisition sequence in MRI scanning.
The MTI datasets were processed using the Functool software package in AW4.3 workstation (GE Healthcare, Milwaukee, WI, USA) to obtain the MTR of each voxel and form the pseudo color maps. The MTRs were calculated voxel-wise by using the formula: MTR [%] =[(NoSat-Sat)/NoSat] × 100%.
ROIs were drawn on the axial T1-FLAIR images first. Three round ROIs, 8 ± 2 mm2 in size, were defined beside the paracele triangular region as the ROIs of the GCT fibers (Fig. 1, circles 1, 2, and 3). A vertical meridian (Fig. 1) was placed in the image to define ROIs in contralateral GCT fibers using the mirror-symmetrical manner of the software (Fig. 1, circles 4, 5, and 6). The ROIs of the unilateral striate area, 4 ± 1 mm2 in size, were defined in the gray matter of the calcarine sulcus (kept away from cerebrospinal fluid) (Fig. 1, circles 7 and 8). The ROIs of the contralateral striate area were defined in the same mirror-symmetrical manner (Fig. 1, circles 9 and 10). The MTR of each ROI was calculated automatically by the software. The mean values of the three ROIs were taken as the MTR of the ipsilateral GCT. The same procedure was processed for calculating the MTR of the striate area.
Magnetization transfer images. (a, d) Axial T1-FLAIR images. (b, e) Sat images, the images acquired with the MT saturation pulse. (c, f) Magnetization transfer ratio pseudo color maps. (a–c) Images of a healthy 24-year-old woman. The MTR of her GCT and striate area are 35.212 and 32.907, respectively. (d–f) Images of a 28-year-old female glaucoma patient. The MTR of her GCT and striate area are 34.194 and 30.333, respectively.
Statistical analysis
A two-sample t-test was performed to assess the differences in age between the glaucoma and control groups. The Pearson χ2 test was performed to assess the differences in gender between the two groups. A two-sample t-test was used to evaluate the difference in MTR between the right and left side of the GCTs and the striate areas in both groups. A t-test was also used to evaluate the difference in MTR between the glaucoma group and control group. P < 0.05 was used to determine statistical significance. All analyses were performed by using the Statistical Package for the Social Sciences software, Version 13.0 (SPSS Inc., Chicago, IL, USA).
Results
The comparison of MTR in the GCT and the striate area between the glaucoma group and the control group.

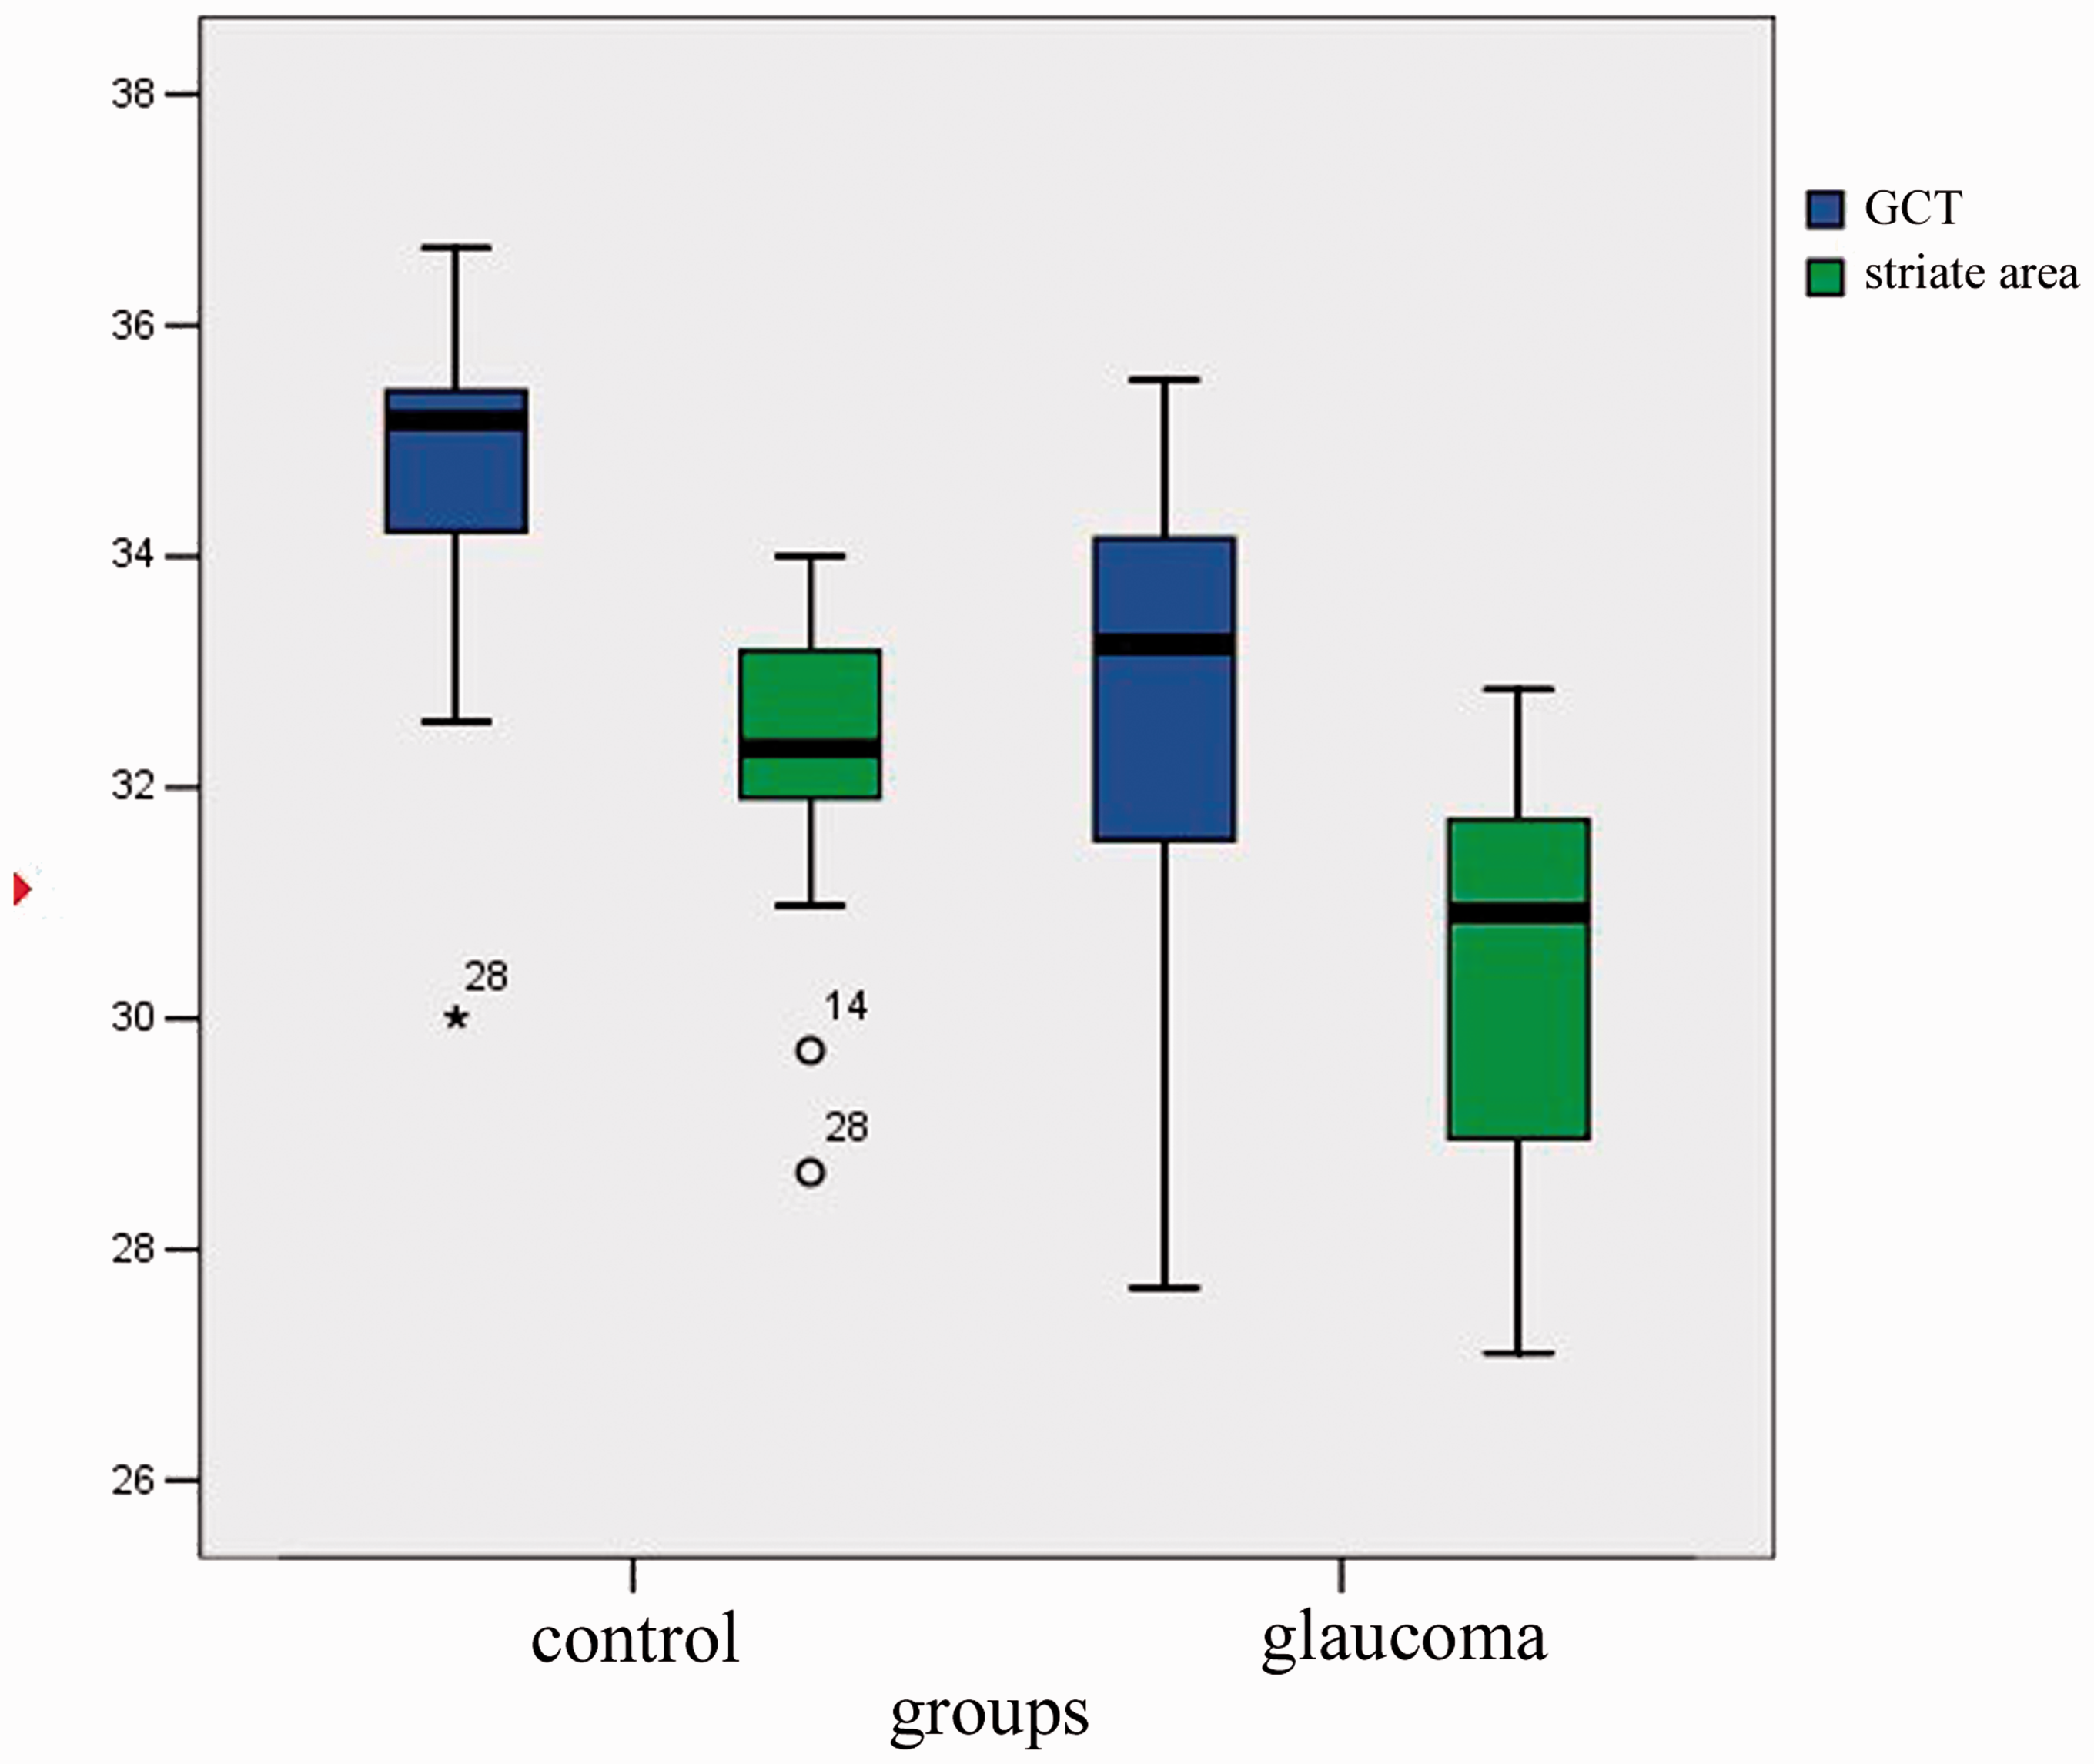
Magnetization transfer ratio of GCT and the striate areas in the glaucoma group and healthy controls.
Discussion
We investigated the GCT and striate areas in primary glaucoma patients and compared with normal controls using ROI analysis of MTR. MTR of bilateral GCT and the striate area reduced in the glaucoma group, suggesting GCT demyelination and striate area degeneration in primary glaucoma.
The MT effect of the brain mainly comes from the biomacromolecules in the neuron cell membrane and cell organelle membranes, for instance, cholesterol, galacto-cerebroside, and phospholipid in the myelin sheath. The MTR measures the capacity of these macromolecules to exchange magnetization with the surrounding water molecules in the brain (14). Its alteration suggests a change in the biomacromolecular content and the characteristic of the tissue. The MTR of highly myelinated tissue, such as the internal capsule and corpus callosum, is significantly higher than the MTR of gray matter (23). The reduction of MTR often relates to demyelination or axonal loss. The reductions of MTR in bilateral GCTs of the glaucoma group suggest demyelination or axonal loss of these fiber tracts. This result corresponds with our previous work. We investigated primary glaucoma by proton magnetic resonance spectroscopy (1H-MRS), and the result suggested neurodegeneration of the GCT and striate area in primary glaucoma (24).
MTR measures the intensity change of an image using on- and off-resonance techniques and depends on the type and parameters of the imaging sequence and type and pulse parameters of the MT saturation pulse. To ensure the comparability of MTI studies, the pulse parameters and scanning systems need to be given (25). The most influential factors of MTR are flip angles and offset frequencies (26). Martirosian et al. evaluated pulsed magnetization transfer contrast (MTC) effects using saturation pulses of variable off-resonance frequency and radiofrequency (RF) amplitudes for a variety of tissue types (white and gray matter, liver, kidney, spleen, muscle, and articular cartilage) in human participants at field strengths of 0.2, 1.5, and 3.0 T. For flip angles of 700–900° and offset frequencies of 1000–1500 Hz, high-quality MTR maps could be obtained at an acceptable level of direct saturation for all field strengths (27,28). Furthermore, if the better signal-to-noise ratio at higher magnetic fields is taken into account, the quality of the MTR maps of the head and knee at 3.0 T was clearly improved compared with lower fields under optimized and comparable conditions. The imaging sequence also has great influence on MTR. We used a high-resolution 3D SPGR sequence with and without a MT saturation pulse in a 1200 Hz off-resonance pulse and flip angle of 670° with a 3.0 T scanner in our study and acquired satisfactory images.
Distal axon injury appears early in mouse glaucoma as in other neurodegenerations. An early hallmark of neuronal degeneration is distal transport loss and axon pathology. Where RGC axons terminate in the superior colliculus, a reduction of active transport follows a retinotopic pattern resembling glaucomatous vision loss. Transport deficits progress distal-to-proximal, appearing in the colliculus first, followed by more proximal secondary targets, and then the optic tract. Although axon degeneration also progresses distal-to-proximal, myelinated RGC axons and their pre-synaptic terminals persist in the colliculus well after transport fails. Thus, distal transport loss is predegenerative (29).
The reduction of MTR in the striate areas of the glaucoma group suggests the degeneration of these areas. The axonal degeneration and death of RGCs are typical pathological changes of glaucoma. Even without knowing the underlying molecular or cellular mechanism by which RGCs are initially damaged in glaucoma, considerable progress has been made in understanding the downstream pathways that lead to RGC dysfunction and death. Ultimately, RGCs primarily die in glaucoma by apoptosis (24). Glaucomatous blockage stops the retrograde transport of neurotrophic factors, such as brain derived neurotrophic factors. Then, apoptosis is mitigated by these “intrinsic pathways,” which are activated after the loss of pro-survival signals from neighboring cells in the brain (2).
Trans-synaptic damage caused by oxidative stress reaction and glutamate excitotoxicity are other important mechanisms of neuronal damage in glaucoma. Intraocular pressure elevation and hypoperfusion cause the blockage of anterograde axonal transport and retrograde axonal transport in optic nerve fibers. These actions are followed by the suspending of target-derived neurotrophic factors along with massive excitotoxins (30). Excitotoxicity is thought to occur when dying cells release excessive amounts of neurotransmitters, such as glutamate. In glaucoma, the uptake of glutamate is decreased in neurons with the weakening of visual stimulation (13,31,32). Increased concentrations of reactive oxygen species and decreased concentrations of antioxidants have been found in the glaucomatous vitreous, as have oxidative DNA damage and oxidative alterations of the trabecular meshwork (12).
In the LGN, diffuse neuronal loss and neuronal shrinkage proportionate to RGC loss have been described (33,34). These damages may lead to the demyelination of GCT, along with glial proliferation and axonal loss. The extent of neuronal damage in the LGN and the loss of GCT fibers are proportional to the elevation of intraocular pressure. This also induces a secondary degeneration of adjacent neurons, which is called trans-synaptic damage. On the other hand, an LGN or visual cortex with experimental damage can induce the degeneration of RGCs by blocking brain-derived and other neurotrophic factors (33). In general, the death of the ganglion cells causes negative feedback from the optic nerve to the central visual pathway, which finally causes neuronal damage in the striate area (8). Yucel et al. suggested that damage to the RGC causes degenerative changes in the LGN and primary visual cortex in non-human chronic glaucoma models (34).
The death of RGCs also causes neuronal damage in the striate areas by retrograde axonal degeneration through a series of negative feedbacks. The clinical-pathological case of human glaucoma was demonstrated to be due to degenerative changes extending from RGCs, LGN, and the visual cortex by Gupta et al. (10,11). In addition to the direct effect of retrograde axonal degeneration, trans-synaptic morphological changes may also contribute to the abnormalities of MTR observed in the striate area. Damage to or degeneration of the RGC axons might induce dystrophic changes in the neuron connecting the LGN and the striate area (23). Anterograde trans-synaptic changes secondary to the axonal transection of the RGC in the optic nerve is a possible mechanism for the MTR decrease in the striate area (35–37).
The inclusion of different types and stages of glaucoma could potentially affect the results. This is certainly a limitation of the study. In the future, we should include homogeneous samples with a larger sample size and correlate the clinical indicators of glaucoma, for instance, intraocular pressure and visual field damage, with MTR variations. Investigating the correlation between the intraocular and MTR variation will inform us the relationship between the glaucoma and neurodegenerations in the visual cortex. The glaucoma clinical indicators may act as a hint of neurodegeneration in the early stage of disease, long before the visual field damage.
In conclusion, the MTR reductions in the bilateral GCT and striate area suggest GCT demyelination and striate area degeneration in primary glaucoma. These neurodegenerations may be induced directly by retrograde axonal degeneration along with the indirect effect of anterograde trans-synaptic degeneration.
Footnotes
Declaration of conflicting interests
The author(s) declared no potential conflicts of interest with respect to the research, authorship, and/or publication of this article.
Funding
The authors disclosed receipt of the following financial support for the research, authorship, and/or publication of this article: This work was supported by Natural Science Foundation of Guangdong Province (no. 2015A030313076) and Fundamental Research Funds of the State Key Laboratory of Ophthalmology.