
Abstract
This study examines whether and how social class matters for marital sex in China since the beginning of the 21st century. We utilize data from a national sexuality survey that has been administered at four time points: 2000, 2006, 2010, and 2015. We use a composite socioeconomic status score deriving from education, occupation, and income to distinguish between the lower class (the bottom 25%), the middle class (the middle 50%), and the upper class (the top 25%). Marital sex aspects include sexual frequency, orgasm frequency, engagement in the woman-on-top and rear-entrance coital positions, and experience with oral and anal sex. Regression results with year-fixed effects reveal significant class differentials in all aspects but anal sex. Whereas the reported sexual frequency is highest in the middle class, the engagement in various coital positions and oral sex is characterized by a positive class gradient. Temporally, we observe an upward trend in all aspects but orgasm frequency. Results from the class–year interaction effects further show that most class differentials have remained stable over the period 2000–2015. The temporal increase in sexual frequency, however, has been the greatest in the lower class but relatively negligible in the upper class.
Keywords
Introduction
For most people in marriage, their sexual lives constitute an integral part of their marital lives. This is even true of older adults (DeLamater et al., 2008; Heiman et al., 2011; Laumann et al., 2006). Besides its obvious relevance to fertility (Rindfuss and Morgan, 1983), marital sex has also been an essential component of relationship quality and stability (Heiman et al., 2011; Yabiku and Gager, 2009; Yeh et al., 2006). In addition, prior research documents a positive link between sexual well-being and an individual's general well-being (Blanchflower and Oswald, 2004; Davison et al., 2009), and such a pattern prevails across countries and cultures (Cheng and Smyth, 2015; Heiman et al., 2011; Laumann et al., 2006).
In this study, we focus on marital sex in China, paying special attention to its relationship to social class since the turn of the 21st century. A long-standing tradition in sex research is to explore and establish the links between sexual behavior and its antecedent factors. Nevertheless, much prior research, primarily in biology and psychology, has focused predominantly on individual-level factors concerning physical and psychological health, and spousal relations (Laumann et al., 1994), thus largely leaving open the question of whether sociocultural factors such as social class matter sexually.
Indeed, the adoption of a social class perspective in sex research is not new: it can be traced back at least to the Kinsey reports (Kinsey et al., 1948, 1953), in which Kinsey and his associates revealed substantial disparities in sexual expression across educational and occupational levels. A handful of subsequent studies based on more recent but less representative data, however, failed to replicate the class patterns revealed in the Kinsey reports (Edwards and Booth, 1976; Hunt, 1974; Weinberg and Williams, 1980). More recent sex research has utilized large-scale representative data from the United States and elsewhere, yielding mixed findings regarding the influence of social status on sex practices (Call et al., 1995; Chandra et al., 2013; Cheung et al., 2008; Haavio-Mannila and Kontula, 1997; Laumann et al., 1994; Parish et al., 2007b). Most notably, these studies included socioeconomic factors (mostly education) in their analyses, usually for logical completeness and rarely as an explicit focus in their research designs. As a result, a systematic understanding of the social class differentials in sexual practice is still lacking.
In China, a sexual revolution has been well under way since at least the late 1990s (Pan, 2004; Parish et al., 2007a). Prior discussion of the revolution, however, has mostly been restricted to sexual practices in non-marital domains, such as premarital sex, homosexual experience, and extramarital sex (Hu, 2016; Parish et al., 2007a; Zheng et al., 2011). Surprisingly little is known about the dynamics of sexual behavior among married adults. Using data from a nationwide, repeated cross-sectional survey that has been conducted at multiple time points during the period 2000–2015, we present an empirical portrait of the nuanced relationship of social class with a variety of marital sex aspects, including sexual frequency, orgasm frequency, coital positions, oral sex, and anal sex. Moreover, the repeated cross-sectional design of the survey allows us not only to delineate an overall trend in marital sex, but also to examine whether and how the potential class differential in each sexual aspect varies over time. Given the relevance of marital sex to relationship quality and individual well-being, a systematic investigation of the class patterns in marital sex in contemporary China can enrich our understanding of the social stratification processes through the lens of marital sex.
Literature review
The Kinsey reports
The Kinsey reports provide an important starting point for understanding the relationship between social class and sexual behavior in general and marital sex in particular (Kinsey et al., 1948, 1953). Based on a long-term, large-scale survey in the United States, Alfred Kinsey and his associates carefully compared a wide array of sexual activities across different social classes, including (but not limited to) the frequency of sexual intercourse, pre-coital petting, mouth stimulation, breast stimulation, genital stimulation, positions in intercourse, and anal stimulation. Two main factors, education and occupation, were used to represent “social levels”. Since the stories told about the educational and occupational disparities were basically similar, we here focus attention to the differentials in sexual practice across social classes as defined by education. The reports specifically divided respondents’ education into three levels: grade school as the lower class, high school as the middle class, and college as the upper class.
First, in terms of sexual frequency, Kinsey and his associates found that the middle class was the most sexually active, whereas the upper class was the least active. When it specifically involves the frequency of sexual behavior within marriage, the class pattern remained clear and consistent, with the middle class reporting the most frequent sex with spouses (Kinsey et al., 1948: 356). The finding that people in the upper class had the least rather than the most frequent sex seemed reasonable because they tend to have more knowledge and more choices to realize their sexual needs.
In addition, the Kinsey reports also demonstrated the class gradients in a variety of sexual practices. For example, among married Americans, oral sex occurred in about 60% of the sexual histories of the upper class, in about 20% of the sexual histories of the middle class, and only in about 11% of the sexual histories of the lower class (Kinsey et al., 1948: 576–577). Similarly, with respect to coital positions, the prevalence of the woman-on-top coital position was found to be 35% in the upper class, 28% in the middle class, and only 17% in the lower class (Kinsey et al., 1948: 374). The prevalence of the rear-entrance position, despite its lower prevalence in comparison to the woman-on-top position, was still higher in the middle and upper classes (11%) than that in the lower class (8%) (Kinsey et al., 1948: 374). These figures together depict a picture that the upper class engaged in sexual behavior with less frequency but more variety.
Despite his strong identity as a biologist and a sexologist, Alfred Kinsey indeed went further to understand why social class matters sexually, basically adopting a sociocultural perspective. In principle, the sociocultural perspective argues that social norms shape the desirability of sexual practices and people from different social classes vary in the extent to which they internalize these norms and view certain sexual activities as appropriate or not. Take coital positions as an example. The man-on-top position has long been the traditional and, therefore, the “normal” position. This position can even reflect men's supremacy and authority during sex. Seen through this lens, the woman-on-top position is the reverse of the man-on-top position, thereby deviating from the traditional power relations during sex. Although people from different classes are equivalently exposed to social controls of sexual norms, the upper class tends to be more liberal or rebellious in negotiating with these norms. As a result, whereas the lower class is more inclined to view nontraditional sexual practices as inappropriate, “crooked”, or “perverted”, the upper class may view diversity during sex as more natural and even beneficial for relationship quality (Kinsey et al., 1948: 374).
The Kinsey reports paid further attention to the potential temporal trends in the class differentials in sexual behavior, although the analysis was insufficient due to the data limitations. For instance, in attempting to make comparisons between generations, the authors split their sample of male respondents into two groups, one aged 33 or younger and the other aged over 33. As such, the difference in median ages between the two groups was roughly 22 years. Based on recalled information concerning sexual activity between the ages of 20 and 30 for both groups, the results showed sexual frequency among the upper class had decreased from the older generation to the younger generation, and sexual frequency among the lower and middle classes had increased from the older generation to the younger generation (Kinsey et al., 1948: 410). Besides the problem of data representativeness, such a trend analysis was confined to sexual experiences at an early stage over the life course.
Studies after the Kinsey reports
For several decades after the Kinsey reports, sexologists and sociologists in Western societies continued the effort of documenting the social class patterns in sexuality. However, most of the studies up until the mid-1980s had failed to replicate the findings presented in the Kinsey reports. Edwards and Booth (1976), for example, analyzed sexual frequency based on a small sample of households in Toronto, Canada. Their regression results showed that the effects of education and occupation status on sexual frequency were all insignificant, regardless of gender. Weinberg and Williams (1980) collected a small sample of Americans from San Francisco, finding no social class differences in the incidence of various activities in adulthood. Hunt (1974) collected a relatively large sample from 22 cities in the United States, but the sample was highly self-selected, with a response rate as low as 20%. This study revealed considerable convergence of lower-class and middle-class respondents in reported frequency of oral sex and anal sex.
The studies mentioned above that postdated the Kinsey reports led researchers to suggest “the declining significance of social class” (DeLamater, 1981). However, we do not know if the observed differences could extend to the population at that time due to the limitations of sample representativeness. As later pointed out by Laumann et al. (1994), building upon projections based on highly selected samples instead of national probability samples became “inexcusable” and “a willful blindness” by the 1970s when sampling techniques had significantly improved.
A few more recent studies have used large-scale representative data from the United States and elsewhere, yielding mixed results concerning the link between social class and sexual practice. Laumann et al. (1994) utilized a probability sample of 3432 American men and women between the ages of 18 and 59, showing little effect of educational level on reported sexual frequency and experience with oral and anal sex. However, the findings from bivariate associations may not be very informative without taking the confounding impact of age into account. Call et al. (1995) analyzed data from the 1988 National Survey of Families and Households (NSFH), a representative sample of 7463 American adults. Focusing on the frequency of marital sexual activity, the researchers included educational level as well as educational level squared into regression models. They found a significant curvilinear relationship between educational level and the frequency of marital sex, specifically with the frequency significantly higher among respondents with moderate levels of schooling and relatively lower frequency among those with either lower or higher levels of education. Chandra et al. (2013) noticed some class differentials in sexual frequency as well as in the practice of oral sex and anal sex, using data from the 2006–2010 National Survey of Family Growth (NSFG) with a national sample of American adults aged 22–44. Specifically, the authors found that higher levels of schooling were associated with lower sexual frequency but more frequent oral sex, whereas the occurrence of anal sex was the highest among those with moderate rather than lower or higher educational levels. Haavio-Mannila and Kontula (1997) analyzed data from a 1992 nationally representative survey in Finland. They found that a lack of orgasm characterizes respondents with high education (15 + years of schooling), and this pattern is particularly pronounced in women. Specifically, the percentage of respondents stating that they often experience orgasm was 62% among women with at most nine years of schooling and 75% among those with 10–14 years of schooling; whereas in respondents with 15 + years of education, the percentage was only 33%.
There have also been a few studies in the Chinese context, but the picture is far from complete. For example, Cheung et al. (2008) examined data from a community-based survey of 1124 Hong Kong Chinese couples. They included educational level as a continuous variable in their models predicting sexual frequency. Neither the husband's educational level nor the wife's educational level was significantly related to sexual frequency. Parish et al. (2007b) devoted attention to the variety of sexual practices in urban China based on a nationally representative sample of Chinese urbanites in long-term relationships. The authors found no significant effect of education on sexual frequency, irrespective of gender. Moreover, the researchers found that a higher level of education was associated with a greater variety of sexual practices in men but not women. It should be noted that in these two Chinese studies, the operationalization of education simply as a continuous variable may cover up potentially nonlinear relationships between education and various aspects of sexual practice.
Overall, previous studies from multiple data sources have yielded mixed findings concerning the social class patterns in sexual practices. As we have systematically reviewed, the adoption of a selected or representative sample, the focus on sexual frequency or other specific martial sex aspects, and the inclusion of education as a continuous or categorical measure in regression models could all potentially lead to inconsistent conclusions.
The present study
This study extends prior literature in four major aspects. First, we build our analysis upon data from a nationwide sex survey in China. Second, we systematically examine the potential differences in a wide range of marital sex practices across social classes, including sexual frequency, orgasm frequency, coital positions, oral sex, and anal sex. Third, the survey's repeated cross-sectional design allows us to investigate further the temporal trends concerning the class differentials in sexual behavior since the beginning of the 21st century. Fourth, as previously shown, many existing studies tend to rely heavily on the educational level to proxy social class. This can be partly justified by the stability of one's education since adulthood. Considering the multi-dimensionality of social class, we make improvements from previous research by assessing social class based on all of respondents’ education, occupation, and income levels, instead of relying on any single one of them.
Research design
Data
Data for this study come from the Sexuality Survey of China (SSC). The SSC is a nationwide, repeated cross-sectional survey that was conducted during the period 2000–2015. Over the span of roughly 15 years, the survey has collected data in the years 2000, 2006, 2010, and 2015. In 2000, the survey was jointly conducted by the University of Chicago, Renmin University of China, Peking Union Medical College, and the University of North Carolina. For the other time points, data were mainly administered by the Institute of Sexuality and Gender at Renmin University of China. It is worthwhile to note that the cross-sectional survey in 2000 was also known as the Chinese Health and Family Life Survey (CHFLS) (Parish et al., 2007a). In each survey year, an independent, nationally representative sample of Chinese adults was selected, consistently following a multi-stage stratified random sampling procedure (Huang et al., 2014; Pan et al., 2011; Parish et al., 2003). More sampling details can be found in previous studies (Pan, 2017; Zhang et al., 2021). To our knowledge, the SSC is the first large-scale, nationally representative, comprehensive sex survey project with a repeated cross-sectional design in China.
Data collection was supported by Computer-Assisted Personal Interviewing (CAPT), in which the questionnaire was stored on a laptop computer and administered by a same-sex interviewer. After obtaining informed consent, the interview proceeded in two stages. In the first stage, a computer-assisted, face-to-face interview was conducted with the aim of collecting basic information such as demographic characteristics and family background, and the interviewer can help input responses into the computer. The respondent also became familiarized with the design of the questionnaire on the computer during this stage. In the second stage, sensitive issues involving sexual behaviors and sexual attitudes were collected, and the respondent was required to fully control the computer and give responses in a self-administered manner, with the interviewer at this point sitting directly opposite the respondent to avoid seeing the computer screen and also to offer help in case of any difficulty. Typically, it would take about 40 minutes for a respondent to complete the questionnaire. Quite a few studies have confirmed that a computer-assisted system and a self-administered questionnaire can yield more reliable self-reports for sensitive questions than face-to-face interviews (De Leeuw et al., 2003; Turner et al., 1998).
Following the sampling design, the survey sampled a total of 5000 individuals in 2000, 6788 in 2006, 9992 in 2010, and 7725 in 2015. The response rate has fallen between 66.5% and 76.4% across survey years. We took the following steps to obtain the final analytical sample. First, because the study is focused on marital sex, we excluded respondents who were unmarried, divorced, widowed, or in a cohabitation status while being interviewed. Second, because the sampling frame in terms of age range varied slightly across different survey years and the survey only included a small proportion of older adults, we restricted our sample by the common age range 20–59 to maintain consistency. Finally, missing data on related variables were additionally excluded. These restrictions yielded a pooled sample of 13,350 respondents, with subsample sizes of 2858 in 2000, 3796 in 2006, 3818 in 2010, and 2879 in 2015.
Measures
We consider multiple aspects of marital sex, including sexual frequency, orgasm frequency, two coital positions, oral sex, and anal sex.
Sexual frequency was collected by asking: “During the past 12 months, how often did you and your current partner have sex?” Responses were rated on a 5-point Likert scale, ranging from 1 (once a day or more) to 5 (once a month or less). We performed reverse coding so that higher values indicate more frequent sex.
Orgasm frequency was collected by asking: “When having sex with your current partner, how often do you orgasm?” It was rated on a 5-point Likert scale, ranging from 1 (never) to 5 (always).
The frequencies of two specific coital positions were collected in the SSC: the woman-on-top position and the rear-entrance position. The frequency of the woman-on-top position was asked with the question: “When having sexual intercourse, many people use the position of ‘man beneath, woman on top’. In the past 12 months, did you often do this with your partner during sexual intercourse?” Similarly, the frequency of the rear-entrance position was asked with the question: “When having sexual intercourse, many people use the position of ‘man behind, woman in front’. The male inserts his penis into her vagina from behind. In the past 12 months, did you often do this with your partner?” The possible responses for both questions were 1 = never, 2 = sometimes, and 3 = often. Considering the highly skewed distribution, we collapsed each coital position into two categories, with 1 indicating having some experience and 0 otherwise.
The questionnaire distinguished between two specific types of oral sex: active oral sex and receptive oral sex. For active oral sex, respondents were asked with the question: “When having sexual intercourse, many people stimulate their partner's genitals with mouth or tongue. In the past 12 months, did you often do this to your partner?” Conversely, for receptive oral sex, participants were asked with the question: “When having sexual intercourse, many people have their genitals stimulated by their partner's mouth or tongue. In the past 12 months, did your partner often do this to you?” The possible responses for both questions were 1 = never, 2 = sometimes, and 3 = often. To simplify, we construct a dichotomous variable with 1 indicating having some experience of mutual oral sex and 0 otherwise.
Information on anal sex was collected by asking: “Many people have sexual intercourse by putting a man's penis inside his partner's anus. In the past 12 months, have you ever done this during sex with your partner?” Respondents could answer yes or no.
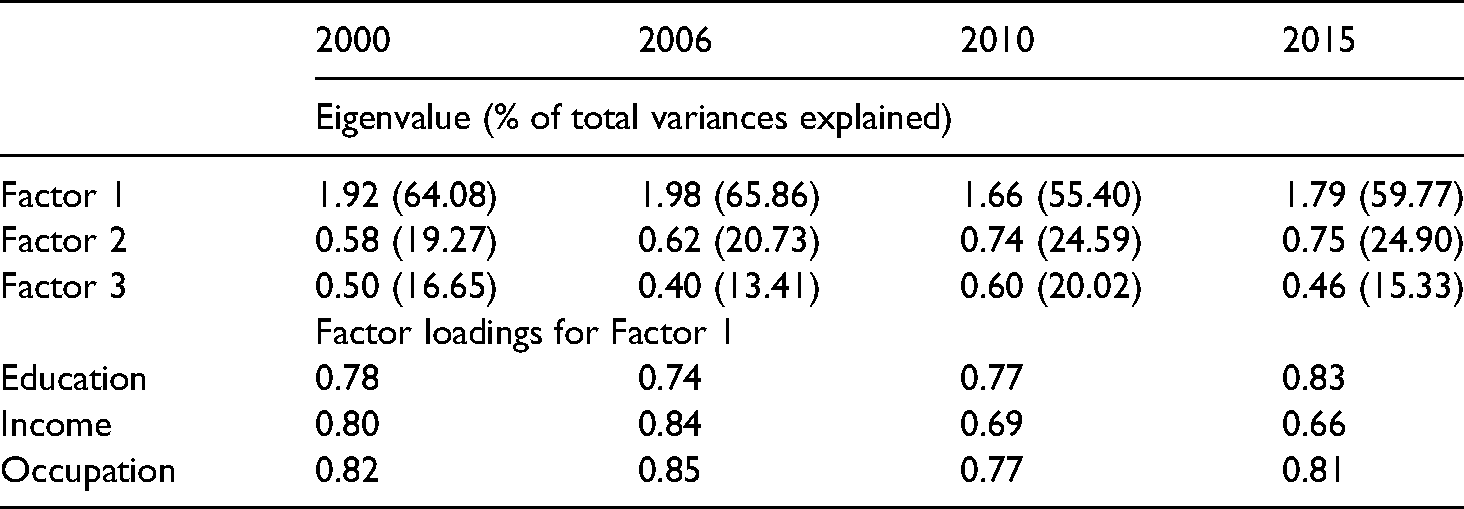
The central independent variables are social class and time period. Social class in the current study is a comprehensive measure constructed upon three observed items: education, income, and occupation. In the SSC questionnaire, there were originally six categories for one's educational level: 1 = never attended school, 2 = elementary school, 3 = junior high school, 4 = senior high school (including professional training school and vocational high school), 5 = junior college, and 6 = four-year college or graduate school. Monthly income was originally collected as a continuous variable and then categorized into quintiles in each survey year. Occupation was categorized in the following order: 1 = having no job at present, 2 = agricultural producer or farmer, 3 = manual worker, 4 = sales, service, entertainment industry worker, 5 = self-employed, independent worker, 6 = clerical worker, low-ranking bureaucrat, office worker, 7 = technical worker, teacher, intellectual, 8 = manager, factory director, business owner, and 9 = governmental official (including village official). We conducted a principal component factor analysis based on education, income, and occupation to obtain a composite socioeconomic status score. As shown in Table 1, the first factor is very strong, with an eigenvalue of higher than 1.65 in each survey wave. All of the loadings of the items of Factor 1 are also substantial, varying from 0.66 to 0.85. Thus, latent socioeconomic status is highly correlated with the three observed indicators. To simplify the scenario and facilitate group comparisons, we further categorized the composite score into three levels: the bottom 25% as the lower class, the middle 50% as the middle class, and the top 25% as the upper class.
Factor analysis results for socioeconomic status in each survey wave.
The time period was captured by the four specific survey years when the survey was conducted: 2000, 2006, 2010, and 2015.
Other measures involved in this study include respondent's gender (0 = male, 1 = female), age, marital status (0 = first marriage, 1 = remarried), age difference between spouses, and region of residence (0 = rural, 1 = urban). Respondent's age was originally continuous in years and then divided into four age groups, with the values 1–3 indicating “20–29”, “30–44”, and “45–59”, respectively. Guided by previous research (Tong et al., 2017; Zhang et al., 2012), we categorized the age difference between spouses into four groups: 1 = wife older than husband, 2 = same age or husband one year older, 3 = husband 2–4 years older, and 4 = husband 5 + years older.
Analytical strategy
The statistical analysis is based on the pooled cross-sectional data and proceeds in two steps. In the first step, we focus on the effect of social class on marital sex independent of time period and other sociodemographic characteristics. By doing this, we force the class differential in each aspect of marital sex to be fixed across survey years. Meanwhile, we could also observe the time trend in each aspect of marital sex net of the confounding impact of age composition and other factors. In the second step, we pay further attention to the interaction effects of social class and time period, that is, including a set of interactions between the social class dummies and the survey year dummies. By doing so, we could observe whether and how the class patterns on marital sex aspects vary across time.
For the frequency of sexual intercourse and the frequency of orgasm during sex, an ordinary least squares (OLS) regression model is estimated. For the practice of two coital positions (woman-on-top and rear-entrance) and oral and anal sex, each of which is measured dichotomously, a binary logistic regression model is estimated. For both the descriptive statistics and model estimations, sampling weights that had been treated with post-stratification calibration were applied so that the sample collected in each survey year could match the population of the corresponding year in terms of the age group, education level, and urban–rural residence distributions.
Results
Descriptive statistics
Table 2 presents descriptive statistics for all the marital sex indicators. Note that all the estimates are weighted results.
Descriptive statistics: weighted means or proportions.
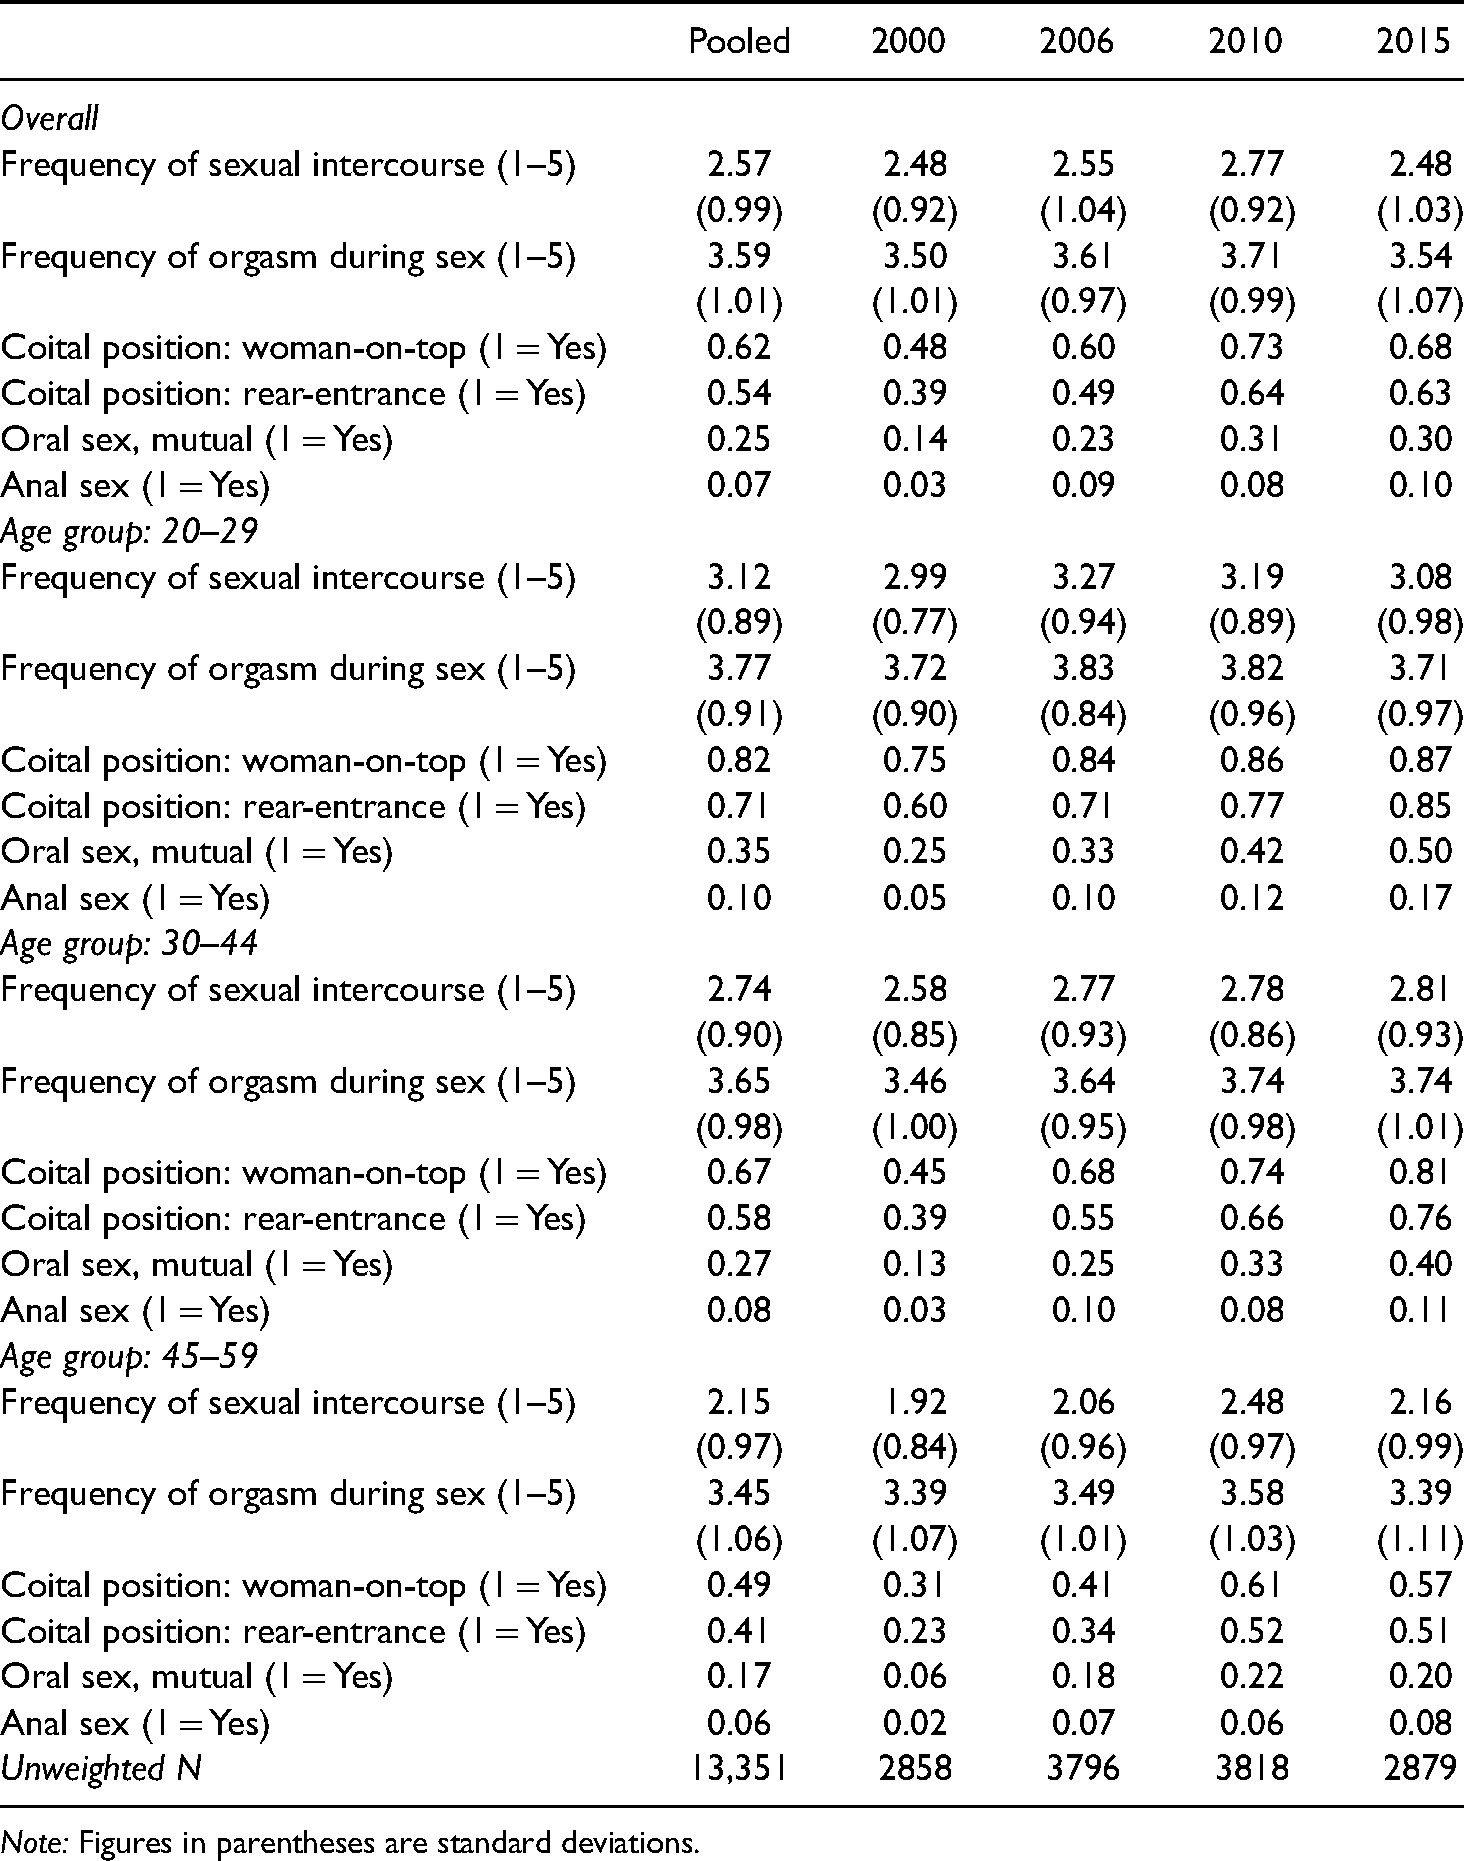
Note: Figures in parentheses are standard deviations.
Let us begin with the frequency of sexual intercourse. First, the average frequency of sexual intercourse is 2.57 on a scale of 1–5, specifically between the options “2–3 times a month” and “1–2 times a week”. Temporally, the average sexual frequency increased from 2.48 in 2000 to 2.77 in 2010, and then decreased somewhat from 2010 to 2015. However, the time trend in the average frequency of sexual intercourse may not be as straightforward as it seems because the respondent's age, one of the most prominent factors in predicting sexual practices (Call et al., 1995; Kinsey et al., 1948), is not yet taken into account. Since people in older age groups generally report less frequent sex, the remarkable shift from a relatively younger age structure to a relatively older age structure could offset the potential increase in sexual frequency during the period 2000–2015. To illustrate, we additionally break down the sample into three age groups: 20–29, 30–44, and 45–59. As is further shown in Table 2, sexual frequency is clearly lower in older age groups. Moreover, in both the 20–29 age group and the 45–59 age group, sexual frequency increased up until 2010 and then decreased somewhat from 2010 to 2015. In contrast, in the 30–44 age group, there was a steady increase in sexual frequency throughout the period 2000–2015.
The average reported frequency of orgasm is 3.59 on a scale of 1–5, somewhere between the options “sometimes” and “often”. Over time, the average orgasm frequency has increased from 3.50 in 2000 to 3.71 in 2010, and then dropped to 3.54 in 2015. The temporal change in orgasm frequency, as revealed in the whole sample and in the three age groups, is quite similar to the temporal change in sexual frequency.
Table 2 also reports descriptive statistics on the engagement in two coital positions, woman-on-top and rear-entrance, and the engagement in mutual oral sex and anal sex. In the pooled sample, the occurrence rate of the woman-on-top coital position is 62% and the rear-entrance coital position 54% “in the past 12 months”. Within the same time frame, the reported experience with oral sex and anal sex is less prevalent, with an occurrence rate of 25% for oral sex and 7% for anal sex. The upward trend in the engagement in the two coital positions and in oral and anal sex during the period 2000–2015 is clear. For example, the occurrence rate of anal sex was 3% in 2000; in 2015, it reached 10%, roughly equivalent to the level among the American married adults in the early 1990s (Laumann et al., 1994).
Marital sex: Class differentials and time trend
We now turn to a regression analysis. Table 3 shows the additive effects of social class and time period on each aspect of marital sex, while controlling for respondent's gender, age group, marital status, age difference between spouses, and residential region. The first two columns report OLS regression coefficients predicting the sexual frequency and orgasm frequency. The other four columns report logistic regression coefficients predicting the occurrence likelihood of each coital position, oral sex, and anal sex, respectively.
Additive effects of SES and period on marital sex experiences.
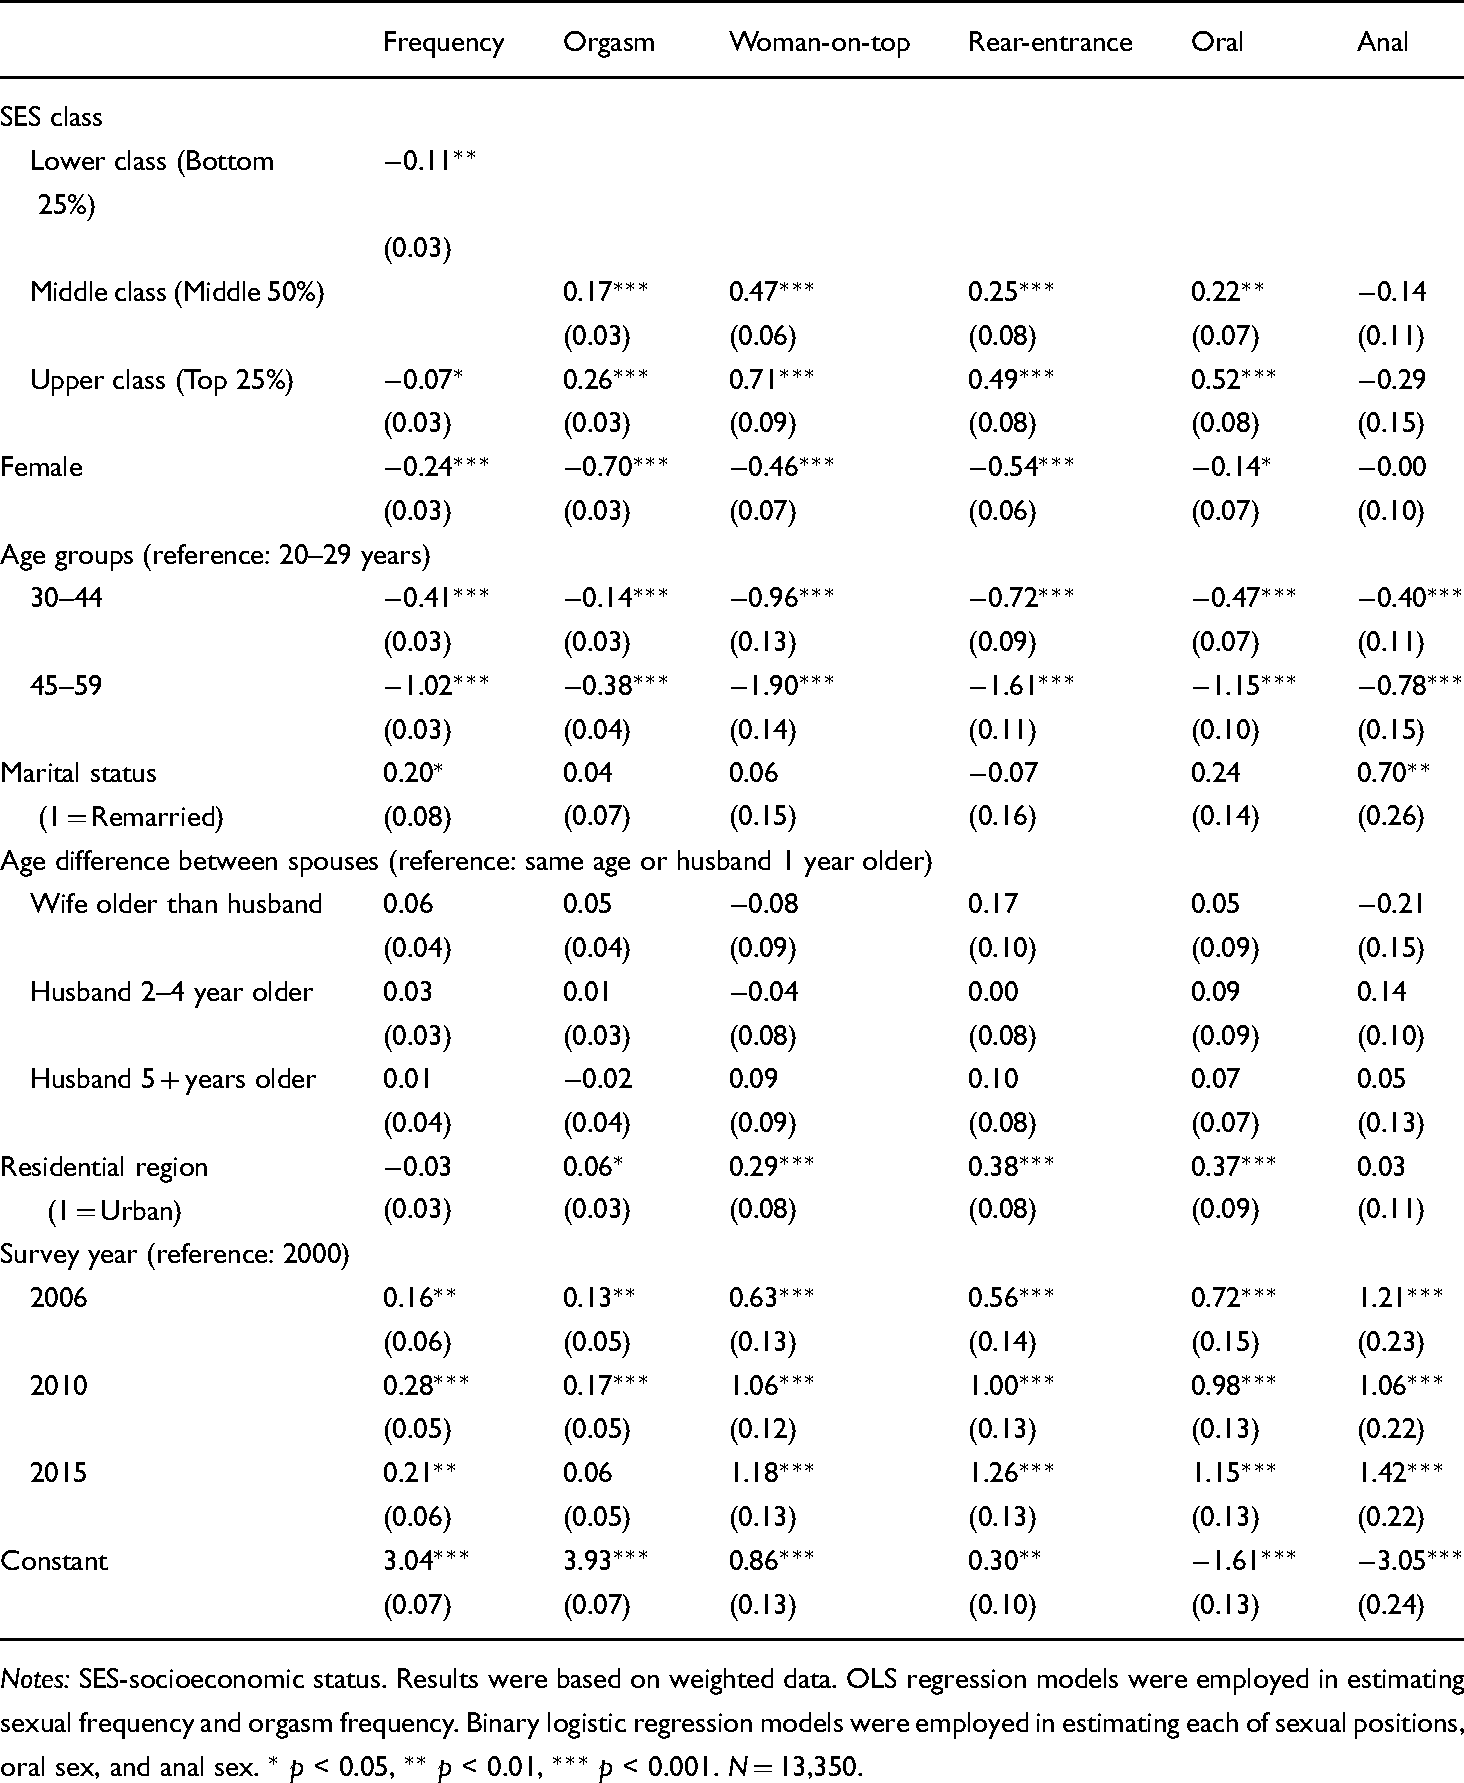
Notes: SES-socioeconomic status. Results were based on weighted data. OLS regression models were employed in estimating sexual frequency and orgasm frequency. Binary logistic regression models were employed in estimating each of sexual positions, oral sex, and anal sex. * p < 0.05, ** p < 0.01, *** p < 0.001. N = 13,350.
The coefficients for social class are of primary concern. First, the relationship between social class and sexual frequency is non-monotonic: sexual frequency is on average significantly higher in the middle class than in either the lower or the upper class. Second, we could see positive social class gradients in orgasm frequency, the engagement in each of the two coital positions, and the experience with oral sex. Third, social class is negatively associated with the likelihood of practicing anal sex, but the relationship does not reach statistical significance. Figure 1 illustrates the predicted performance on each sexual indicator by social class while holding all other covariates at their means.
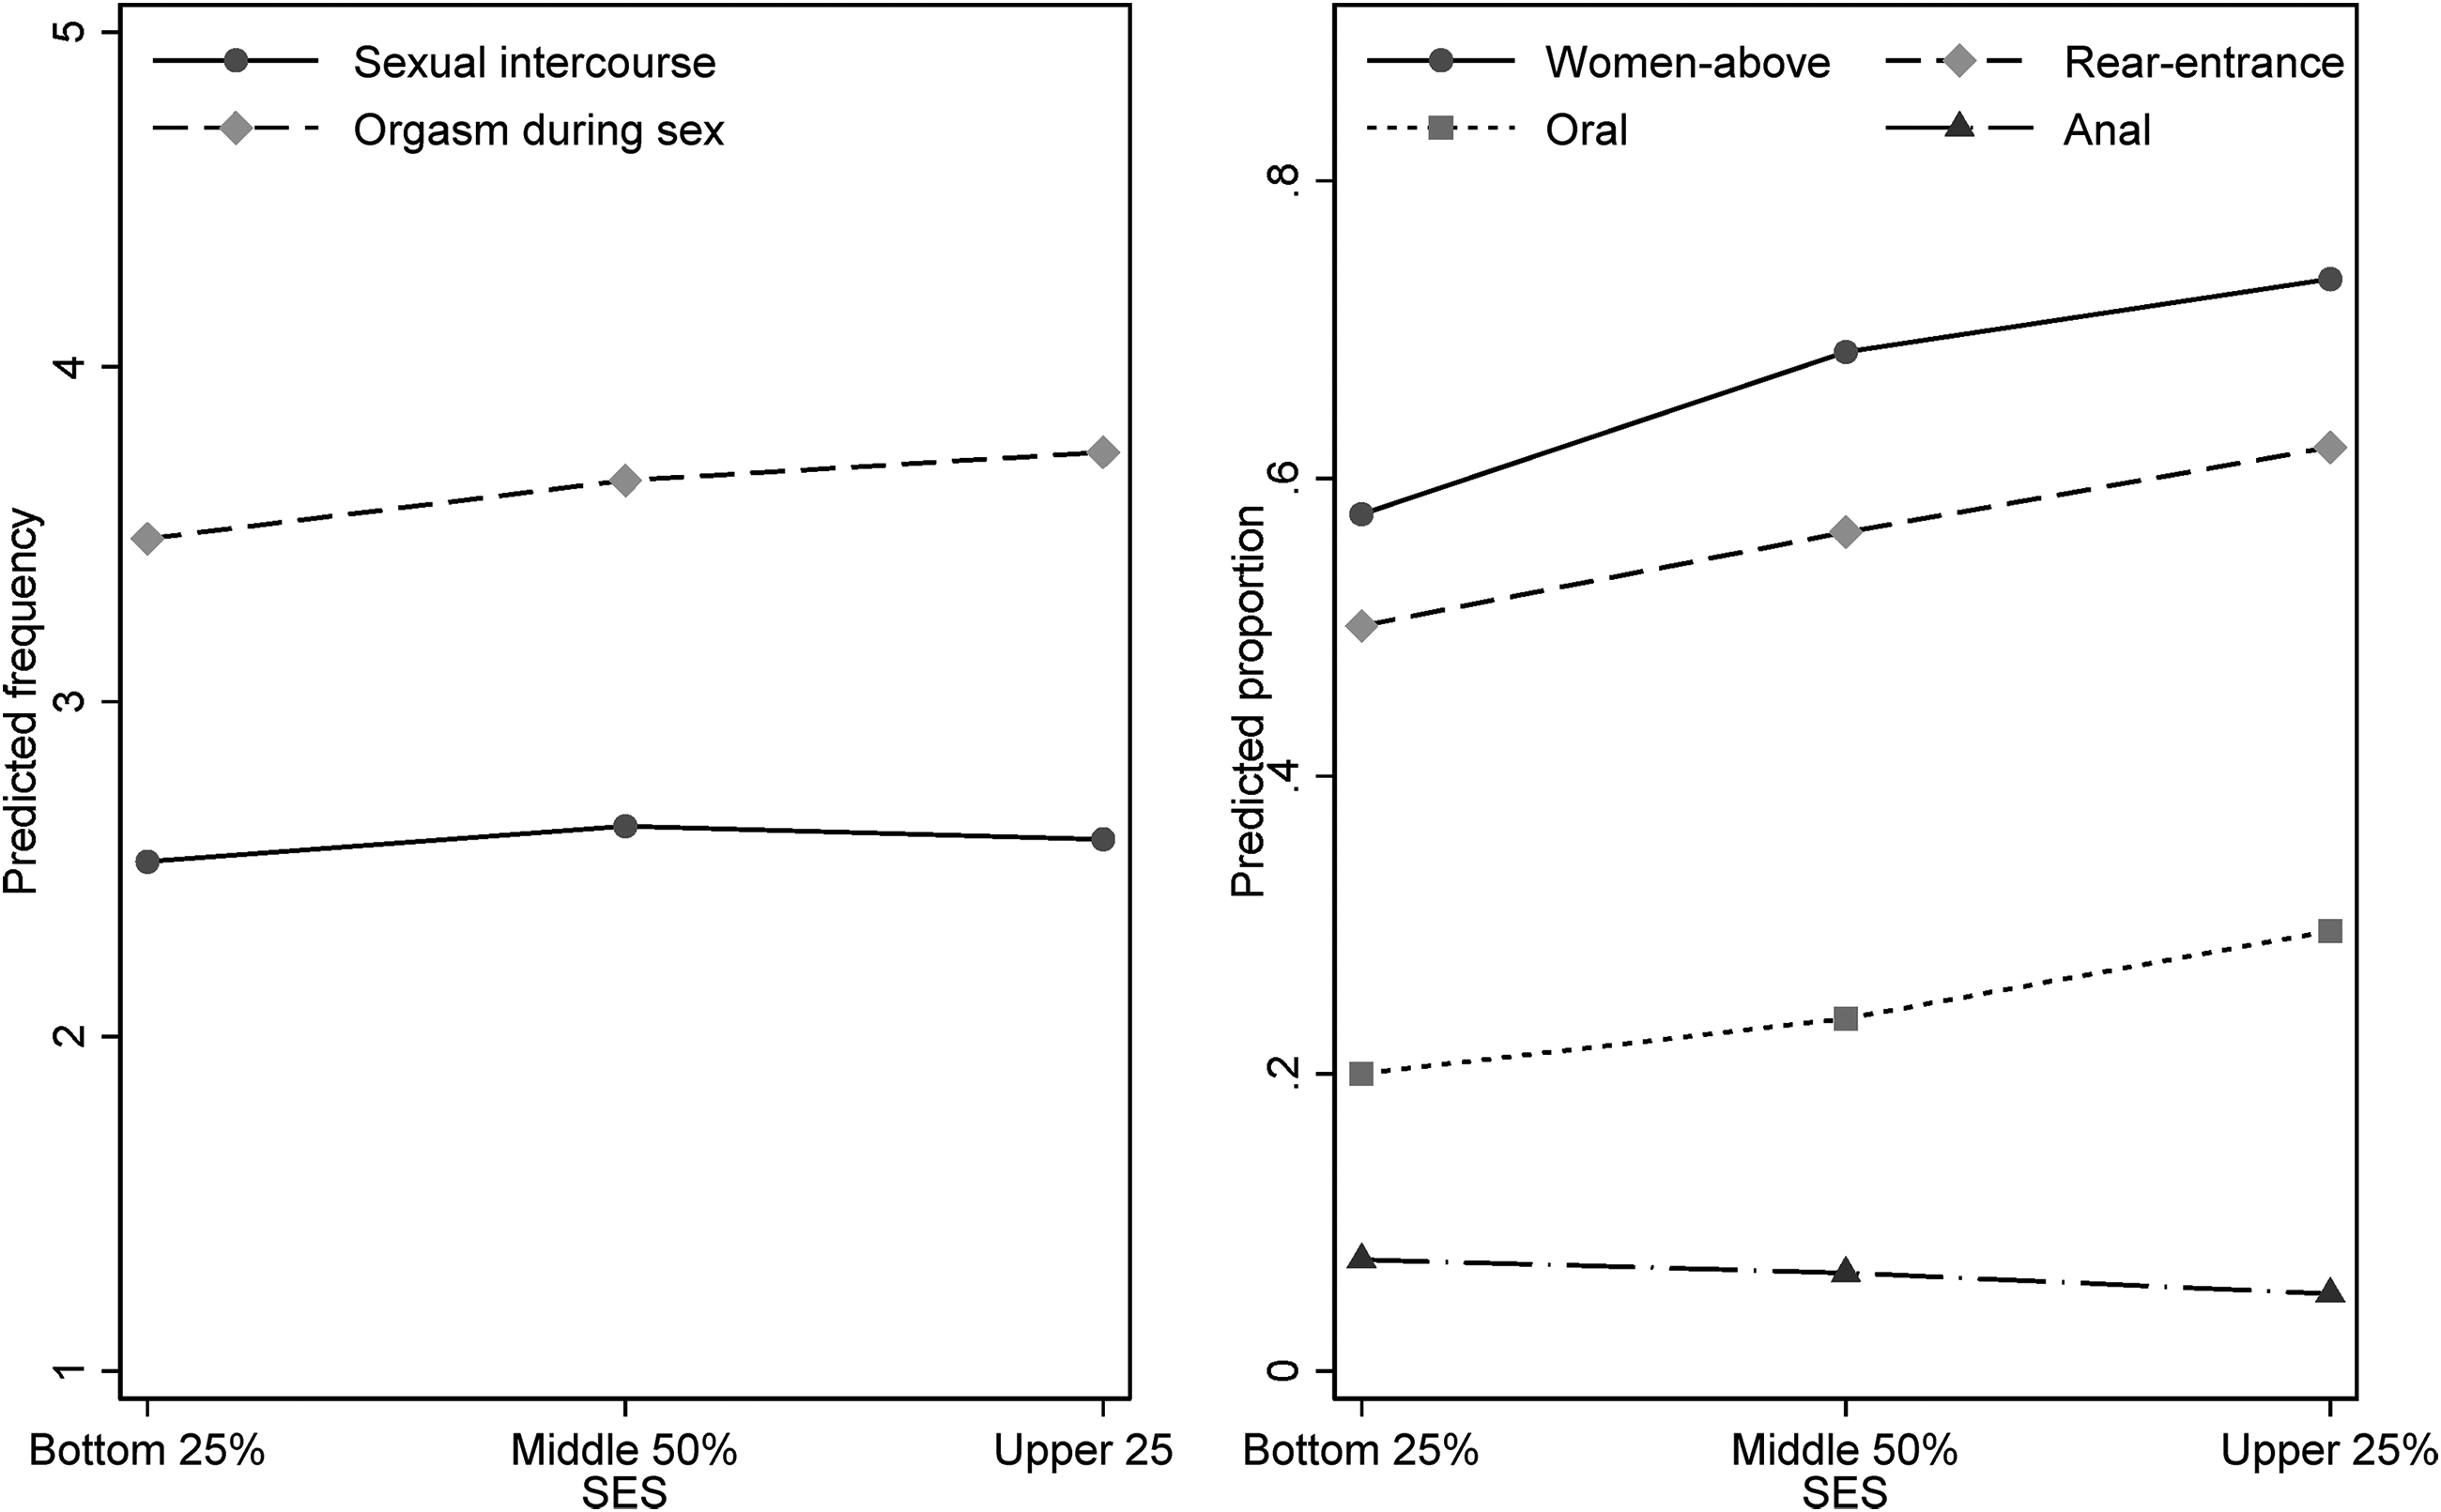
Predicted performance on each indicator of marital sex: by SES class.
In addition, the results in Table 3 also show that during the period 2000–2015, the overall practices of marital sex have followed an upward trend. This is evident from the significantly positive effects of the survey year dummy variables. Other things being equal, the average sexual frequency in 2015 was 0.21 point higher than that in the base year 2000. Given that the standard deviation of the sexual frequency is about 1 (see Table 2), the magnitude of the increase illustrated here is roughly equivalent to a one-fifth standard deviation of sexual frequency. Similarly, from 2000 to 2015, the odds of practicing the woman-on-top position during sex increased by 225% [exp(1.18)-1], the odds of practicing the rear-entrance position by 253% [exp(1.26)-1], the odds of oral sex by 216% [exp(1.15)-1], and the odds of anal sex by 314% [exp(1.42)-1]. The only sexual aspect without a clear temporal trend is orgasm frequency, which has experienced a slight increase first and then a decline. These results indicate that orgasm frequency may not necessarily increase along with the increase of sexual diversity. Figure 2 illustrates the predicted performance on each sexual indicator across survey years while holding all other factors at their means.
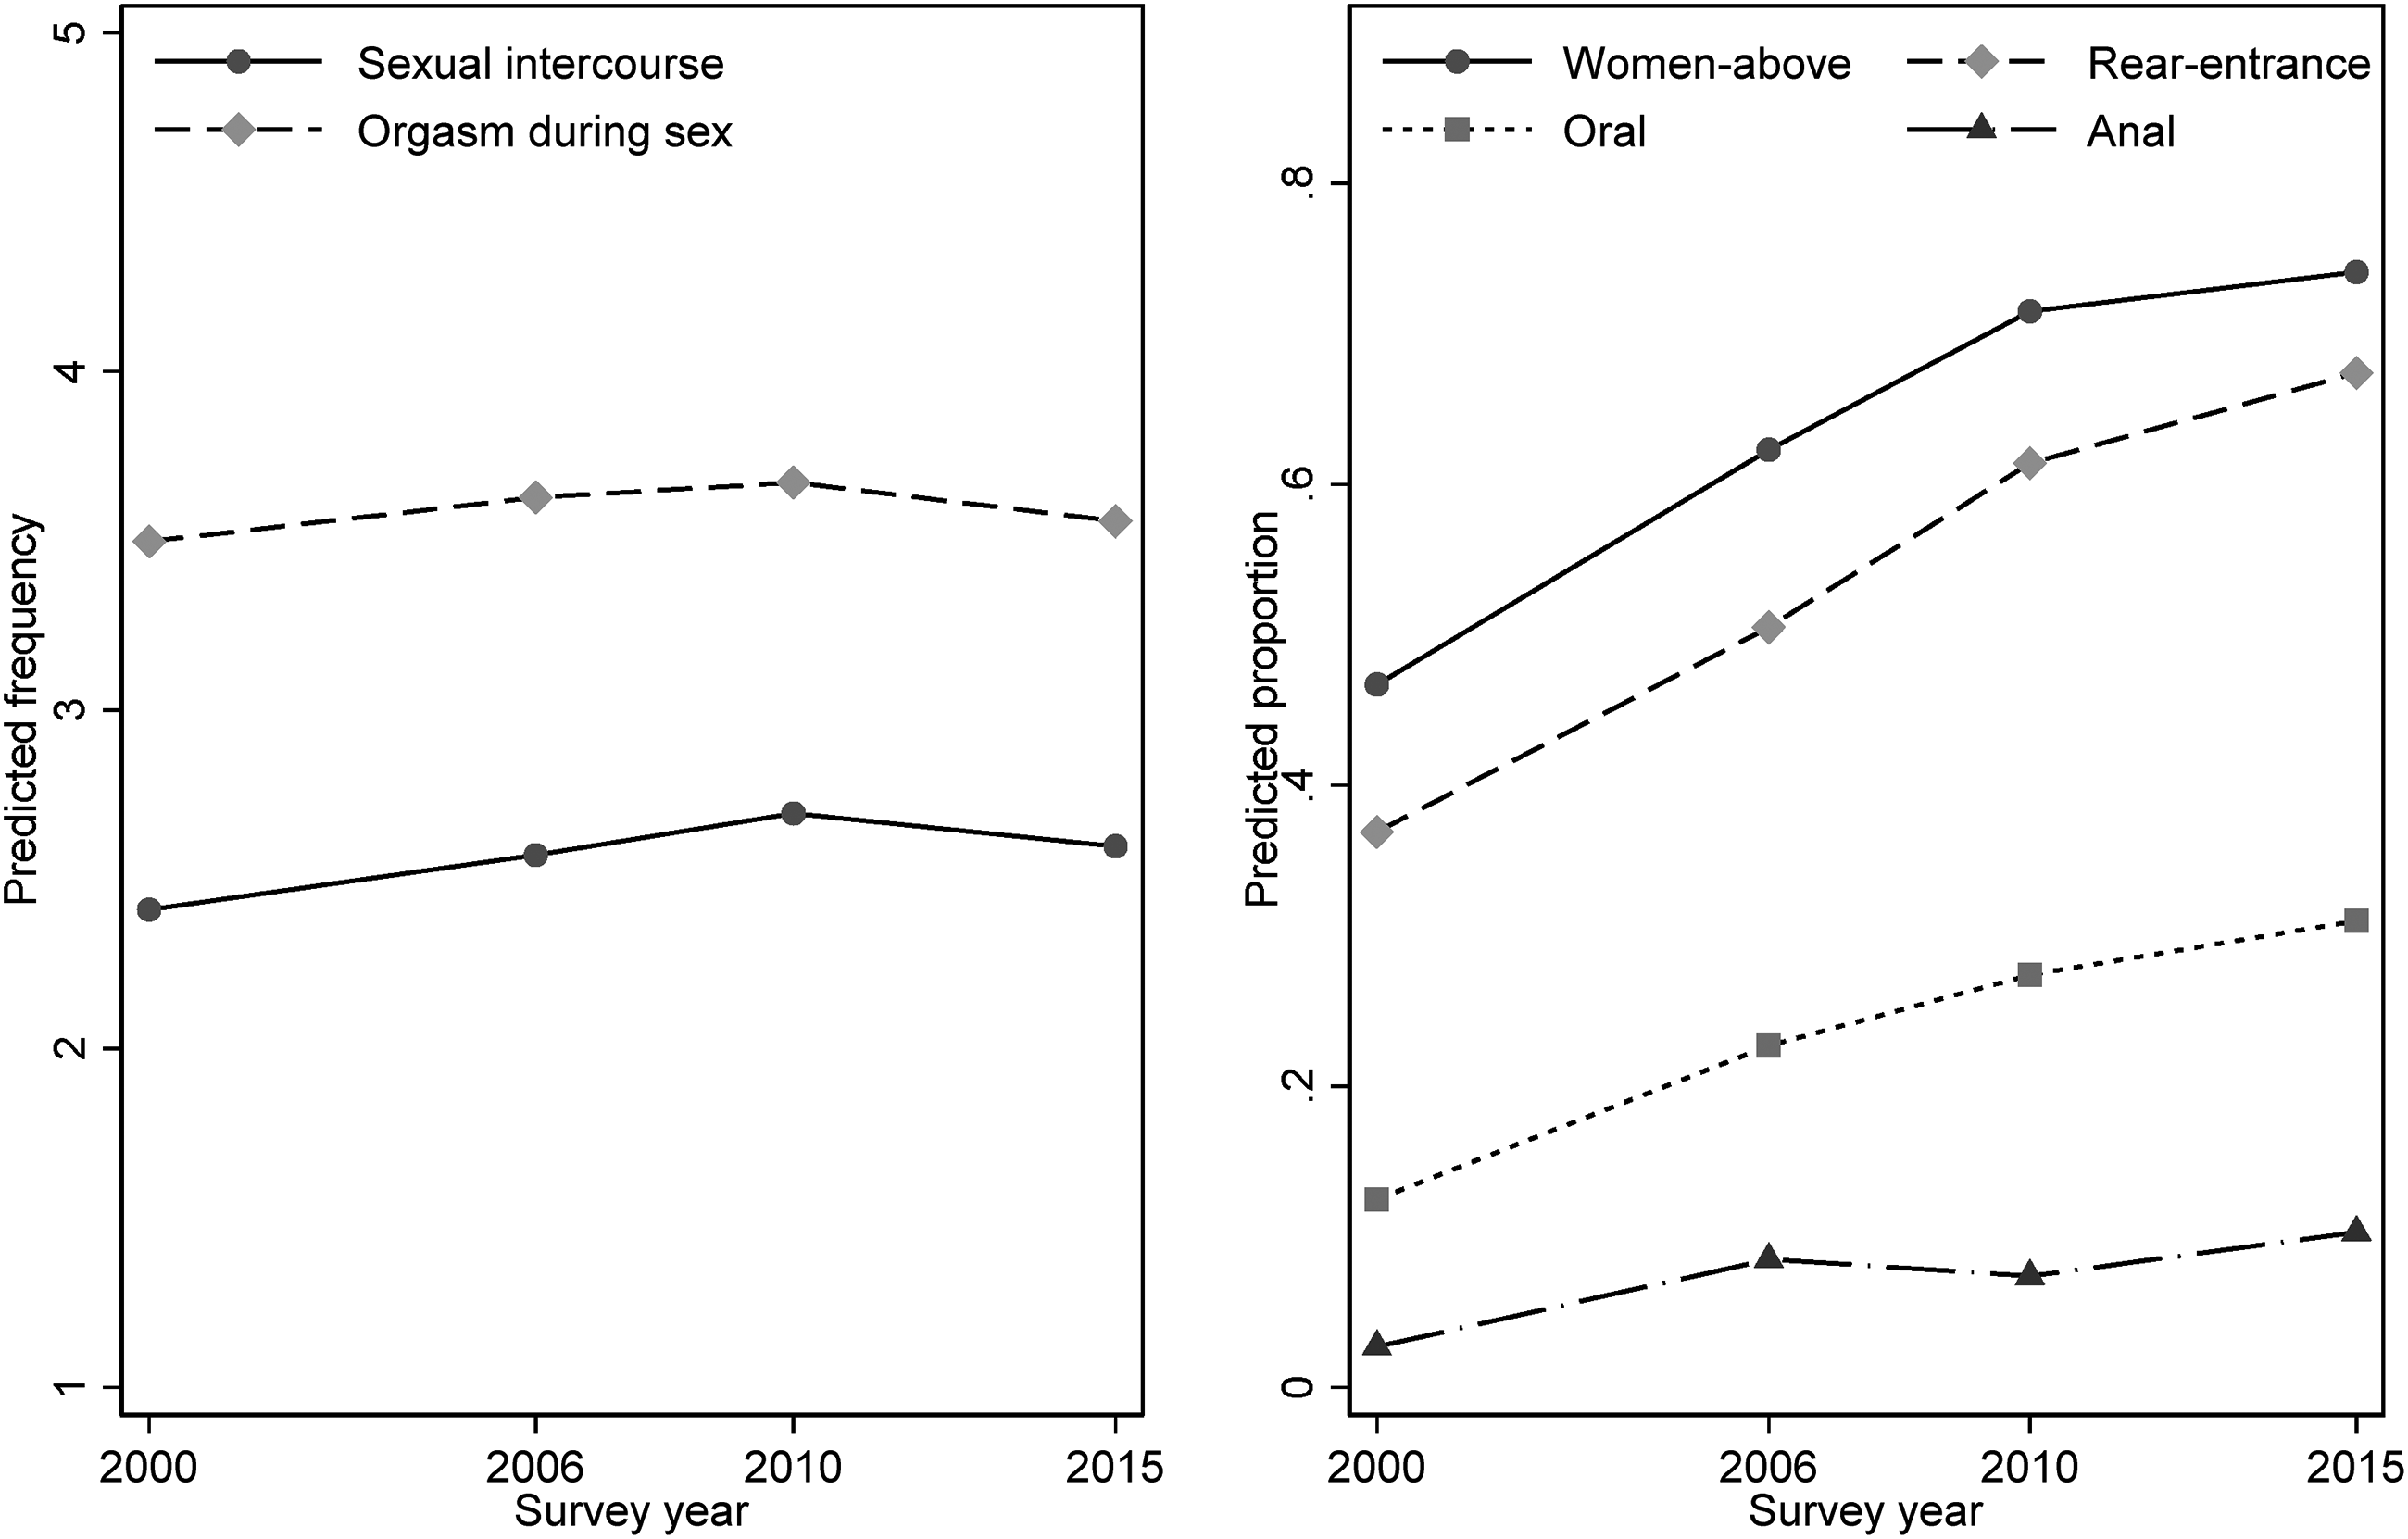
Predicted performance on each indicator of marital sex: by period.
We now pay further attention to the interactive effects of social class and time period. Regression estimates are reported in Table 4. As shown in the first column, the social class pattern in sexual frequency has undergone some directional changes during the period 2000–2015. In this case, the main effects of the survey year dummies indicate an upward trend in sexual frequency among middle-class respondents. Moreover, the significant coefficients for the interaction terms indicate a relatively larger increase among lower-class respondents on the one hand, and a relatively smaller increase among upper-class respondents on the other hand. The main and interactive effects taken together would suggest a negligible change in sexual frequency over time among people from the upper class.
Interactive effects of social class and time period on marital sexual experiences.
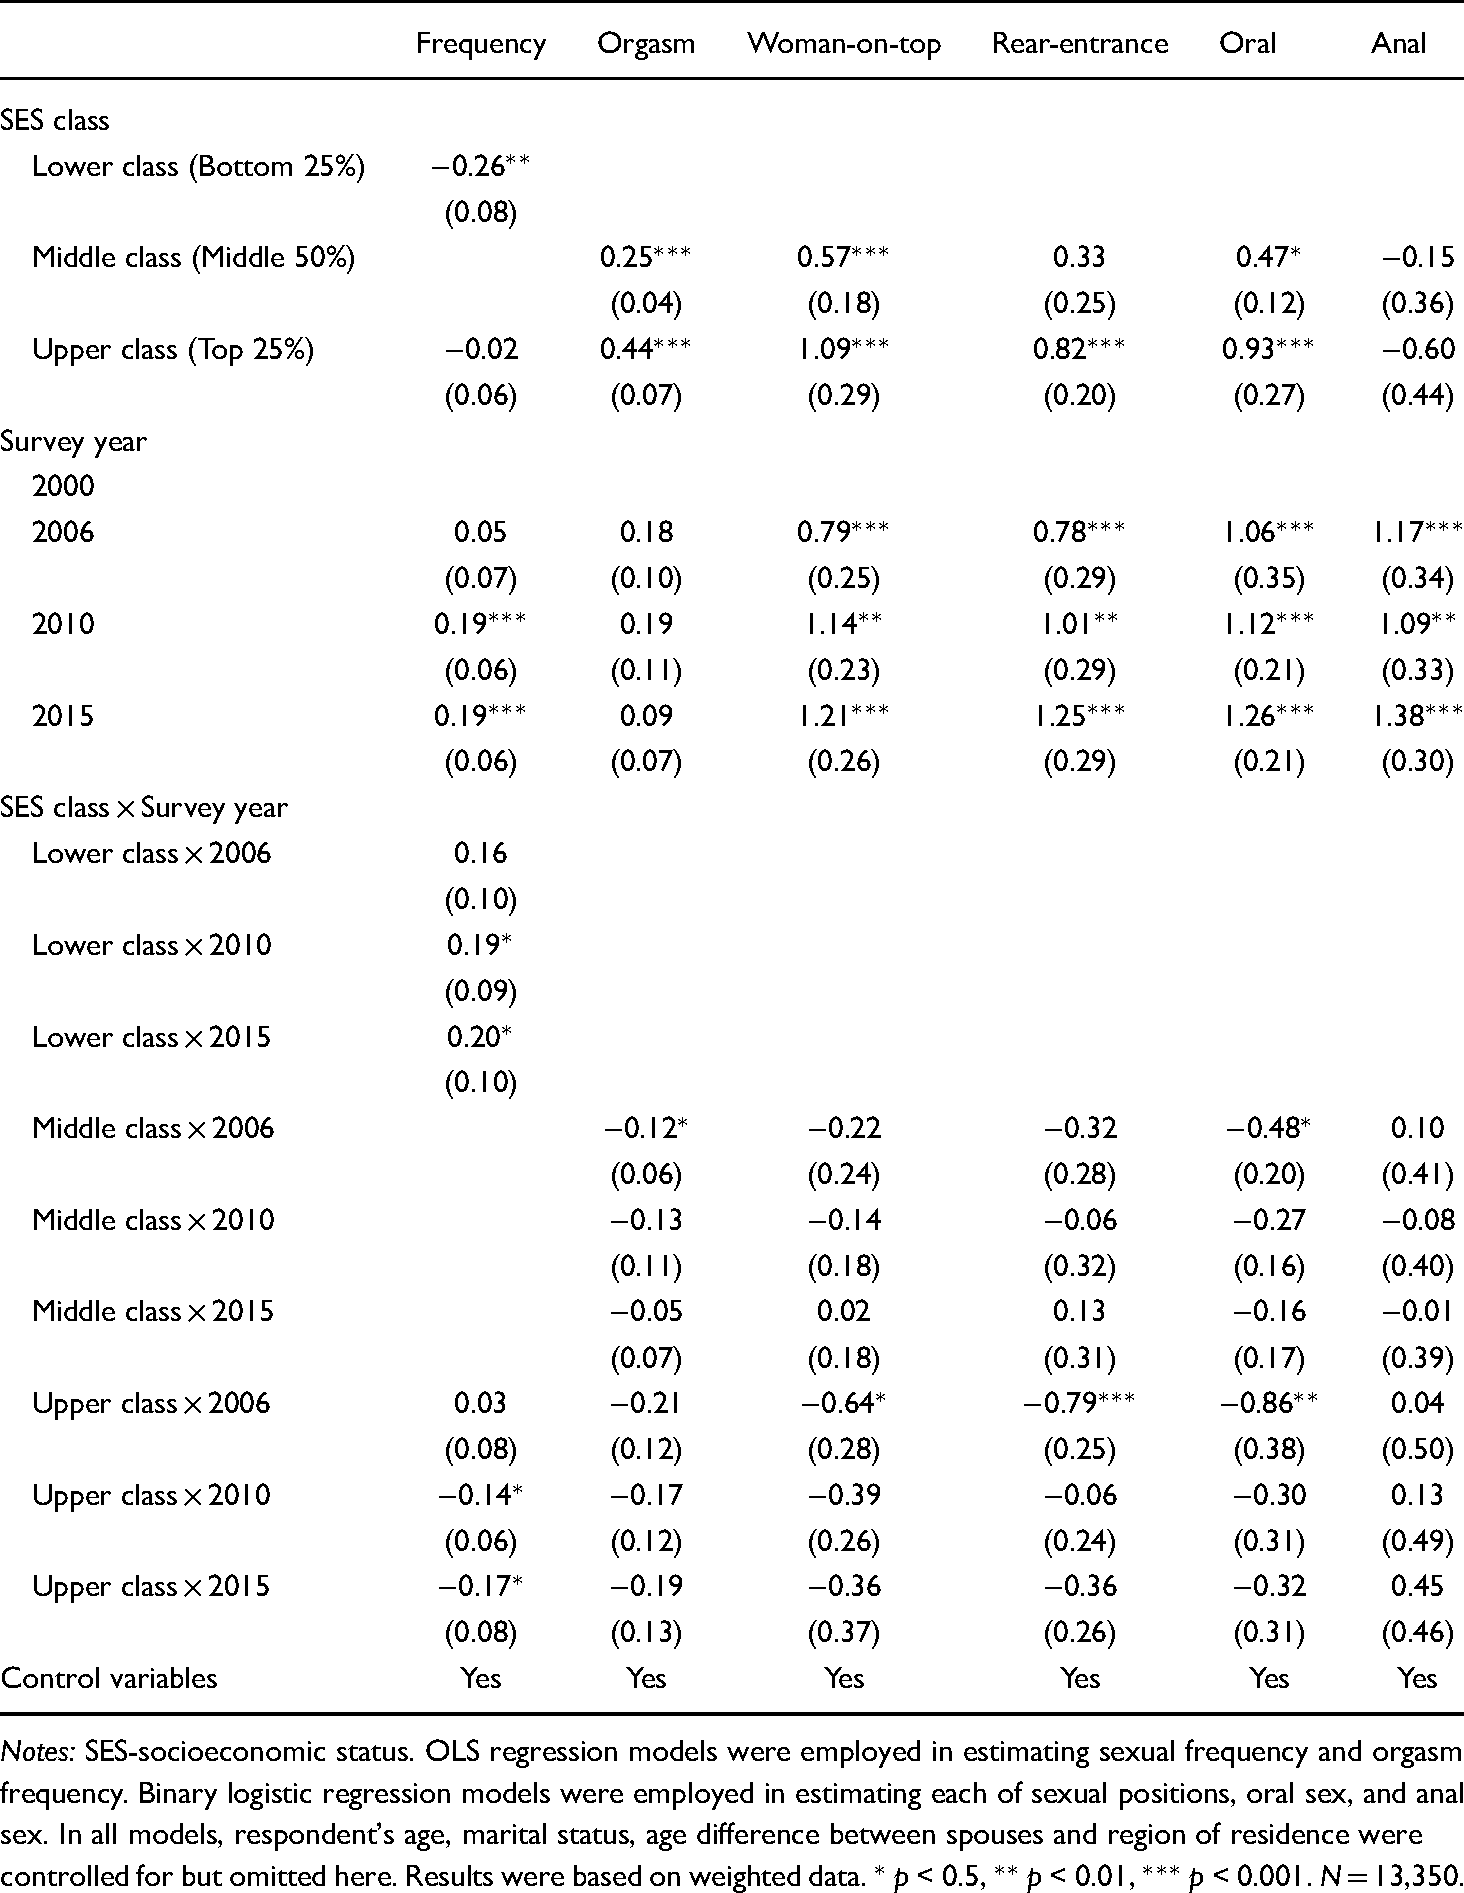
Notes: SES-socioeconomic status. OLS regression models were employed in estimating sexual frequency and orgasm frequency. Binary logistic regression models were employed in estimating each of sexual positions, oral sex, and anal sex. In all models, respondent's age, marital status, age difference between spouses and region of residence were controlled for but omitted here. Results were based on weighted data. * p < 0.5, ** p < 0.01, *** p < 0.001. N = 13,350.
Columns 2–5 report the interaction effects of social class and time period on orgasm, coital positions, and oral sex. We do not see any clear and meaningful time-varying patterns. A few significant coefficients on the interaction terms are related to the short period 2000–2006. This may be a real reflection of the societal change or a distortion due to the variation in data quality. In either case, more data and better research designs are warranted. Here in this paper, we conservatively suggest that the positive social class gradients in orgasm frequency, engagement in the woman-on-top coital position, engagement in the rear-entrance position, and the likelihood of practicing oral sex have remained largely unchanged during the period 2000–2015. Finally, as reported in column 6 of Table 4, we do not reach any significant findings regarding the social class pattern of anal sex, possibly due to the relatively low prevalence of anal sex. As revealed in Table 2, the prevalence of anal sex in the year 2015 was indeed still much lower than the prevalence of oral sex in the year 2000. Therefore, until recently, the majority of Chinese married adults remain reluctant to incorporate the practice of anal sex into their regular sexual repertoire.
Conclusion
The social class differentials in marital sex have been studied for over a half-century, but empirical evidence is far from conclusive. In the United States, the Kinsey reports revealed substantial differences in a wide range of sexual aspects across different social classes based on large-scale yet unrepresentative data (Kinsey et al., 1948; Kinsey et al., 1953). Subsequent studies, however, had yielded inconsistent findings (Call et al., 1995; Laumann et al., 1994; Weinberg and Williams, 1980), partly due to the time when the data were collected, the representativeness of the data, and the specific sexual domain that was concerned. In regions outside the United States, empirical evidence is much more limited. And China is no exception.
Does social class matter for martial sex in today's China? The answer we provide is mostly yes. Utilizing data from a population-based, repeated cross-sectional survey that has been conducted at four time points during the period 2000–2015, we find significant social class differentials in sexual frequency, orgasm frequency, the likelihood of using the woman-on-top and rear-entrance coital positions, and the engagement in mutual oral sex. Considering the sexual frequency, the middle class seems to be the most active. In other aspects, we observe a clear and positive class gradient, that is, the upper class is ahead of the middle class which, in turn, is ahead of the lower class. There are at least two possible explanations for such a social stratification in sexual practices. One possible reason could be that people in higher classes show more positive attitudes toward the nature of sex. Previous research indicates that higher-class people are less likely than their lower-class counterparts to consider sex as “dirty” or “shameful” (Pan and Huang, 2013). Another possible reason is particularly related to the women. In the face of the social control of traditional sexual norms, higher-class women may show greater willingness and capabilities to liberalize their sexual practices. Indeed, previous research has revealed that higher-class wives are more likely to initiate sex (Do et al., 2018; Pan and Huang, 2013) and hug, kiss, and caress their partners before sexual intercourse, compared to their lower-class counterparts (Pan and Huang, 2013). The only exception is anal sex, which has been relatively low in prevalence and roughly evenly distributed across different social classes.
Temporally, we document a clear upward trend in sexual frequency, the engagement in various coital positions, and the experience with oral and anal sex. This is in stark contrast to the recent findings in the United States. For example, one study used data from the General Social Survey (GSS) and showed a significant decline in sexual frequency among people with partners from 1989 to 2014 (Twenge et al., 2017a). Another recent study based on a national online survey further revealed significant declines in sexual frequency, oral sex, and anal sex (Herbenick et al., 2022). These discrepancies highlight the need to situate sexuality research in specific social contexts. There appears to be no clear evidence suggesting any directional changes in orgasm frequency among Chinese married adults over time.
Finally, our further investigation of the interactive effects of social class and time period largely confirms the stability of the class differentials in most of the sexual aspects, including orgasm frequency, the experience with coital positions and oral sex. A notable exception is sexual frequency. Over time, the overall upward trend in sexual frequency has been a combination of a significant increase in the middle class, a much larger increase in the lower class, and a negligible increase in the upper class. As such, we tend to speculate that sexual frequency may fade away as a significant factor in understanding the social stratification in sexuality in the contemporary Chinese context.
We are aware of several limitations in and future directions for this research. First, our repeated cross-sectional data, despite the long time span they cover, include only a few time points, which limits our capacity to observe more nuanced dynamics regarding class differentials in marital sex. Second, respondents in our data were restricted within the age range of 20–59. Hence, the findings in the current study cannot be generalized to older adults, which is indeed a very important group in sex research. Older adults aged 60 and above had reached 250 million and constituted approximately 18% of the total Chinese population by 2018. Third, although we have controlled for the age structure throughout the analysis, we might obtain more nuanced findings if we focus on specific age groups or birth cohorts (e.g. every 5 or 10 years). Most notably, married young adults aged 20–29 in our data indeed experienced a steady decline in sexual frequency from 2006 to 2015, similar to the recent findings from a few Western countries such as the United States (Twenge et al., 2017b; Ueda et al., 2020) and Germany (Beutel et al., 2018). It is also worthwhile to notice the fact that the population of young married adults in China is becoming a highly self-selected population group with the ever-postponing of marriage entry nationwide in China (Yu and Xie, 2015). Both the practical and statistical concerns centering on this specific population segment merit further research attention. Nonetheless, our findings may provide a valuable benchmark for future research, with special attention to more refined age groups in the population.
Footnotes
Acknowledgements
The manuscript has benefited from constructive comments and suggestions from Yu Xie and Chunni Zhang.
Contributorship
Yueyun Zhang, Xin Wang, and Suiming Pan designed the research; Yueyun Zhang performed data analysis; Yueyun Zhang and Xin Wang wrote the manuscript; and all authors reviewed the manuscript.
Declaration of conflicting interests
The authors declared no potential conflicts of interest with respect to the research, authorship, and/or publication of this article.
Funding
The authors disclosed receipt of the following financial support for the research, authorship, and/or publication of this article: The original data collection has been funded by the Major National Science & Technology Specific Projects of Chinese Government (2008ZX10102) and The Ford Foundation, Beijing (1065-0331, 1070-0226). The funders had no role in the preparation and submission of this manuscript.