
Abstract
Numerous studies have investigated the prevalence and social correlates of depression in China, but less is known about trends in depression prevalence and inequalities across time. Using nationally representative data from the China Family Panel Studies, we examine patterns of depressive symptoms over time from 2010 to 2018 among Chinese adults. We assess trends across time in depression disparities by educational attainment and household income using random-intercept logistic regression models. We find that the overall prevalence of depressive symptoms increased significantly in China over this period of time; increases in depression were significant for men and women, rural and urban residents, and the non-elderly. We also find that the rate of increase in depressive symptoms was more rapid among people with high levels of education and family income. Thus, though depression inequalities favor higher socioeconomic groups, this disparity is declining.
Introduction
Over the past four decades or so, China has experienced unprecedented and continuous economic growth. Yet despite enjoying a greatly improved standard of living, the Chinese people have become more exposed, especially in recent years, to a challenging environment, such as the slowdown in economic growth, rising income inequality, increasing market competition, remarkable fluctuations in stock and housing prices, the soaring cost of living, rapid urbanization, and uncertainty about the future, all of which may do harm to their mental health (e.g. Chen et al., 2014, 2015; Ding et al., 2020; Wang and Granados, 2019; Wei et al., 2021; Yu, 2008). Depression is a common mental health problem worldwide, and has become an important cause of morbidity and mortality in China (Zhou et al., 2019). It also constitutes a huge economic burden on Chinese society. It is estimated that in 2012 the medical costs attributable to depression and depressive symptoms accounted for 14.7% of total personal expected medical spending in China (Hsieh and Qin, 2018).
Once a low priority in the government's agenda, the mental health of the people (including depression/depressive symptoms) has gained increasing attention from the central and local governments in China. To promote mental health, governments have implemented a series of laws, policies, and regulations, improved access to and the quality of mental health services, and raised the public's mental health literacy (for a review, see Chen and Guo, 2021; Liu et al., 2011). Of particular note, in 2019 China issued the Healthy China Action Plan 2019–2030, which specified the objectives and comprehensive strategies for the promotion of public mental health.
Meanwhile, the number of studies of mental health in general and depression/depressive symptoms in particular among the Chinese people is increasing (for reviews, see Baxter et al., 2016; Cheng et al., 2016; Zhang et al., 2012). Studies conducted to date have assessed the prevalence and social correlates of depression and depressive symptoms in China. For example, using data from the China Mental Health Survey, conducted from 22 July 2013 to 5 March 2015, Huang et al. (2019) obtained a 12-month prevalence for depressive disorders of 3.6%, and a lifetime prevalence of 6.8% among Chinese adults. Analyzing data from the 2011 baseline survey of the China Health and Retirement Longitudinal Study (CHARLS), Lei et al. (2014) found that depressive symptoms were significantly associated with age, sex, marital status, physical health, and residence among Chinese people aged 45 and older. They also found socioeconomic gradients in depressive symptoms, as did several other studies (Li et al., 2014; Ruiz et al., 2019; Wang and Granados, 2019; Xu et al., 2016; Yu, 2008; Zhao and Ruan, 2019).
Yet how depression/depressive symptoms are changing over time, and for whom, remain empirical questions, since the existing studies' focus on point-of-time prevalence or differentials. In this article, using a five-wave dataset spanning eight years (China Family Panel Studies [CFPS] 2010, 2012, 2014, 2016, 2018), we carry out a rigorous study of secular changes in depression prevalence in the Chinese population, paying special attention to trends across time by socioeconomic status (SES). Trends and socioeconomic differentials in depression prevalence are important, not only to those adversely affected by them, but also to policy makers intent on reducing social inequalities and improving population health. Considering that mental health is a key yet understudied component of population well-being (World Health Organization, 2004), examining trends in the prevalence of depression is also of great importance to medical sociology.
Theory and evidence
Trends in depression in today's China
The public believe that, compared to ten years ago, mental health has declined in China (Chen and Guo, 2021). Nevertheless, previous studies have reported inconsistent results. A meta-analysis of the prevalence of depressive symptoms in Chinese adults identified decreasing depression between 1986 and 2017 (Liao and Lian, 2019). Similarly, Zeng and Jian (2019) found decreasing prevalence among middle-aged and elderly people during 2011–2015. By compiling data from the China Mental Health Survey and other regional surveys, Huang et al. (2019) determined an “inverted U-shaped trend” during 1982–2013, with depression prevalence declining after peaking in 2009. On the uptrend side, Ren et al. (2020) identified increasing prevalence, albeit primarily in those aged over 55.
Trend assessments require comparable data with a minimum variation in sampling and instruments. Some cross-sectional surveys used in the abovementioned research (e.g. Huang et al., 2019; Liao and Lian, 2019; Ren et al., 2020), however, were temporally far apart from each other. In contrast, the direct utilization of longitudinal surveys in previous research (e.g. Zeng and Jian, 2019) does not permit analysts to unbiasedly estimate population characteristics or model population relationships at specific points in time.
As such, we still have relatively little knowledge about overall trends in depression in China, despite piecewise evidence gained from existing literature. The question remains: how have overall trends in depression prevalence changed over time in the Chinese population?
SES and depression
In the US and other Western countries, the prevalence of depression/depressive symptoms varies substantially across subgroups. Studies have found higher depression rates among women, the elderly, and the unmarried when compared to men, the non-elderly, and the married, respectively (e.g. Wittayanukorn et al., 2014). Our central concern is socioeconomic differentials in the distribution of depression/depressive symptoms. A large body of studies has generally documented a negative association of SES with depression (Everson et al., 2002; Freeman et al., 2016; Gilman et al., 2002; Hoebel et al., 2017; Link et al., 1993; Melchior et al., 2013; Miech and Shanahan, 2000; Nishimura, 2011; Rai et al., 2013; Zimmerman and Katon, 2005). Despite the use of a wider range of SES and depression indicators, the results are generally robust (for a review, see Lorant et al., 2003). For example, depression is less prevalent among people with higher education, income, and/or occupational status (Green and Benzeval, 2013; Melchior et al., 2013; Zimmerman and Katon, 2005). Not only do higher SES groups have a lower onset rate of depression but also a lower persistence rate of depression (Lorant et al., 2003).
There are two primary interpretations of the mechanisms responsible for the association between SES and depression: the neo-material interpretation and the psychosocial interpretation. According to the neo-material interpretation, people with higher SES have greater access to material resources such as nutritious food and safe living conditions (Assari, 2017; Lynch et al., 1997; Miyaki et al., 2013; Rai et al., 2013), and also to mental health services which are necessary for diagnosis and treatment of depression (Fang et al., 2019; Li et al., 2021). Other than the direct effects SES has on people's mental health, it also significantly differentiates peoples’ physical health, which generates an indirect effect on mental health (Miech and Shanahan, 2000).
The psychosocial interpretation proposes that psychosocial factors are important in understating the effects of SES on depression. On the one hand, SES affects depression through the stressors faced by different groups (Miech and Shanahan, 2000). Stressful events, such as divorce, unemployment, and bereavement, are underrepresented among higher SES groups (Assari, 2017; Everson et al., 2002; Hoebel et al., 2017; Kim, 2021; McLeod and Kessler, 1990; Ross and Mirowsky, 1999). On the other hand, higher SES groups have access to more social-psychological resources, thereby reducing their chances of being depressed (Link et al., 1993). For example, people of higher SES are more likely to have high self-esteem (Gadalla, 2009; Lorant et al., 2003) and enjoy a general sense of mastery and control over life's challenges (Link et al., 1993). People with higher SES are less likely to feel relative deprivation (Hoebel et al., 2017; Kim, 2021). High SES could also act as a proxy of social relationships and interaction (Kim, 2021). People with higher SES are also better able to advance coping strategies for stress, using their cognitive and non-cognitive skills (Lahelma et al., 2006; Li et al., 2021).
Although previous studies have provided valuable insights into the potential causal mechanisms through which socioeconomic factors are linked to depression and depressive symptoms, we still do not know how these mechanisms may be shaped by the larger sociopolitical context in which they operate, given that these studies were mainly based on data from the US and other Western countries. If these mechanisms manifest themselves in different forms in different contexts, the extension of the findings of research conducted elsewhere to the population in China is potentially problematic, given China's distinct social context. First, Chinese society is stratified by structural collective forces, such as regions and work units (danwei) (Xie, 2016), which may function as structural forces to override the importance of person-level or family-level SES on mental health. Second, in the past decade, China has almost achieved the goal of universal coverage of health insurance (Luo, 2019; Luo and Tong, 2016). The average share of healthcare spending borne by individuals fell sharply from 35.29% in 2010 to 28.36% in 2019 (National Bureau of Statistics of China, 2020). Third, although China is undergoing a market-oriented transition, the family support system still plays an important role in the daily lives of Chinese people. During difficult times, including times when family members suffer from severe diseases, family members, including extended family members and members of kinship networks, are expected to contribute money and support.
In summary, given the complexity of social stratification among Chinese people, in this article we first need to establish, empirically, the extent to which SES and depression are associated in the Chinese context. We then investigate how the strength of the SES–depression relationship (i.e. socioeconomic disparities in depression) has changed over time among the Chinese population.
Change in socioeconomic disparities in depression over time
Fundamental cause theory addresses expectations as to how depression differentials by SES change over time. It argues that socioeconomic resources are always associated with health inequality, because socioeconomic conditions are fundamental causes of health and illness; as such, SES gradients in health cannot be eradicated by eliminating and blocking individual mechanisms linking SES to health (Link and Phelan, 1995; Lutfey and Freese, 2005; Phelan et al., 2004, 2010). SES gradients in health persist because SES embodies a wide variety of resources, such as money, power, prestige, knowledge, and one's social network, that potentially affect morbidity and mortality in many ways. When one mechanism in the SES–health link is eliminated, other potential mechanisms persist. According to fundamental cause theory, SES gradients in depression and depressive symptoms should persist even if individual mechanisms in the SES–depression link may vary over time.
The relatively limited amount of research have emerged so far that deals with trends in mental health inequalities. They generally supports the claim that the magnitude of socioeconomic disparities in depression and depressive symptoms has persisted over time. For example, in the US, England, and Sweden, researchers consistently find that socioeconomic inequalities in the associations between educational attainment and depression have either remained steady (Todd and Teitler, 2019; Weinberger et al., 2018) or have increased (Barr et al., 2015; Katikireddi et al., 2012; Linder et al., 2020; Todd and Teitler, 2019) since the 1990s. Likewise, during the same period, income gradients in depression and depressive symptoms have either held steady (Weinberger et al., 2018) or increased (Hong et al., 2011; Linder et al., 2020). Although most research operationalizes SES in terms of educational attainment or income, there are exceptions. Looking at the period 1993–2000 in the UK, Stansfeld et al. (2011) found few changes in prevalence rates of common mental disorders by occupation.
Do socioeconomic inequalities in depression also show a tendency to remain stable over time in the Chinese population, or have they grown? The answer is “it depends”. Without doubt, higher SES individuals are more able to buffer themselves against risk factors for depression than their lower SES counterparts. Although the assumption of fundamental cause theory that higher SES individuals are usually exposed to fewer stressors than lower SES individuals seems reasonable in developed countries, it may not be the case in developing countries, especially for China which has experienced a different path of industrialization and modernization.
In China, the economic slowdown, rapid urbanization, and mass migration are generating challenges for mental health in the Chinese population. Between 2010 and 2018, the GDP growth rate dropped from 10.6% to 6.8%, while the share of the population living in urban areas reached nearly 60% in 2018, up from 49.5% in 2010 (Figure 1). The “floating population” (i.e. migrants without local hukou [household registration] status) rose by 69.73% between 2010 and 2020 (National Bureau of Statistics of China, 2021). In conditions of economic slowdown, people in higher SES groups might have “more to lose”, and are thereby at higher risk of mental distress (Wang and Granados, 2019). Urbanization and migration in China also can exert a negative impact on overall mental health (Cai and Wang, 2018; Chen et al., 2014, 2015). Since higher SES people are generally overrepresented among urban residents and migrants, they could suffer disproportionally from the adverse consequences of urbanization and migration.
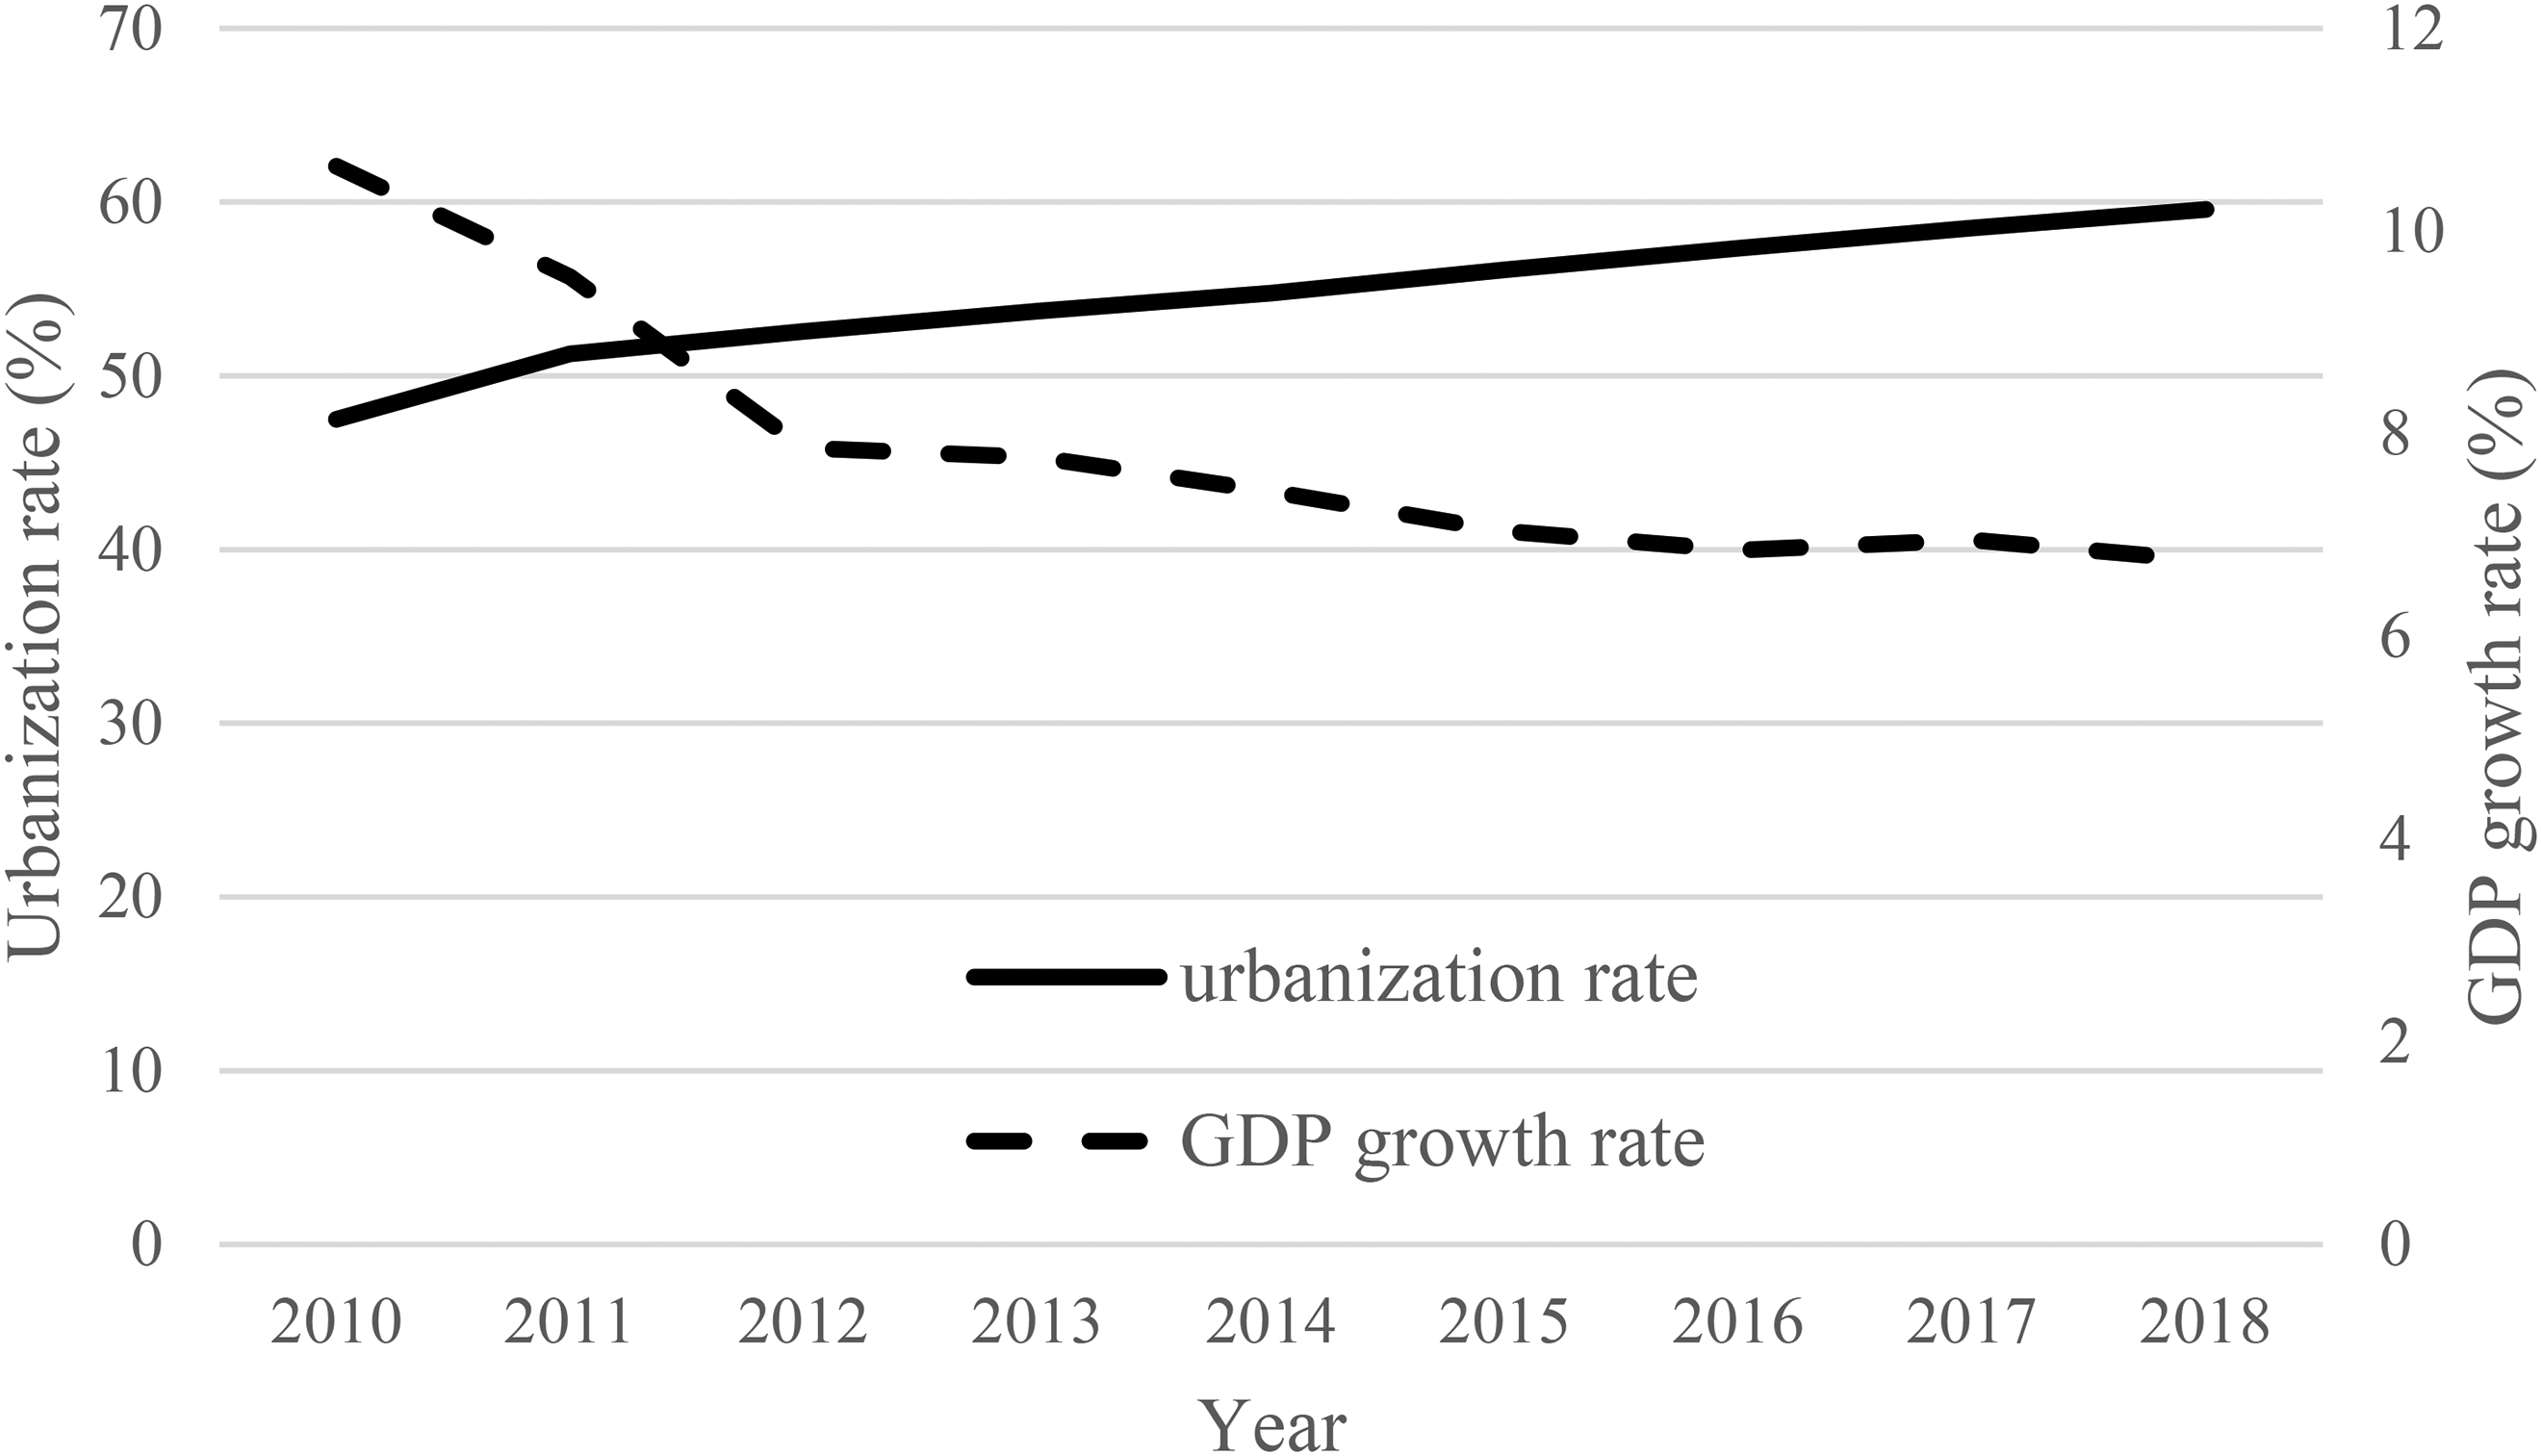
Urbanization rate and GDP growth rate in China, 2010–2018. Source: State Statistical Bureau of China, 2020.
Considering the inconclusive nature of the arguments elaborated above, we cannot predict with confidence whether SES differentials in depression and depressive symptoms will diminish, grow, or hold constant over time in China. To our knowledge, until now only one study has directly examined changes in socioeconomic inequalities in depression prevalence in China. Specifically, Zeng and Jian (2019) used pooled data from the 2011 and 2015 waves of CHARLS to investigate income-related inequalities of depression prevalence in China. The study found that income-related inequality in depression among the middle-aged and older population grew over time between 2011 and 2015. We extend this study by covering a wider population and longer period. We also differ from this study by taking into account cross-sectional analysis of individual data from the longitudinal survey.
Data, measures, and method
Data
For this study, we analyze data from the CFPS, an ongoing project launched by the Institute of Social Science Survey at Peking University (Xie and Hu, 2014). The CFPS is a large-scale, almost nationally representative longitudinal survey, which has so far collected five waves of data: 2010, 2012, 2014, 2016, and 2018. In the baseline survey in 2010 it employed a multistage probability sampling method to randomly select 14,960 households from 25 out of 31 provinces in the Chinese mainland (excluding Xinjiang, Tibet, Qinghai, Inner Mongolia, Ningxia, and Hainan). The survey completed interviews with the sampled households and all members living in these households. Follow-up surveys attempted to track all the original respondents in the baseline survey, as well as the core new family members living with the original respondents.
To examine changes in depression prevalence and inequalities in China, the CFPS is an ideal dataset for a variety of reasons. First, it spans a relatively long time period, and as a newly collected nationally representative dataset, it allows a national view of secular changes over time. Second, it contains rich information on depressive symptoms and SES, which has changed little over the five waves of the data. For depression and depressive symptoms, it contains Likert-type scales; SES measures include education and household per capita income. Third, a series of weights have been developed by the survey investigators for cross-sectional analysis of individual data from the 2010–2018 CFPS waves.
We restrict our analysis to adults aged 16 and older at the time of the survey. Because the samples include young-adult respondents who may not have finished their education, we have also conducted sensitivity tests by starting at ages 25 and 30, and the results are consistent. After excluding invalid or incomplete cases, our analytical sample consists of 31,274 persons in 2010, 28,817 in 2012, 29,294 in 2014, 31,468 in 2016, and 27,795 in 2018.
Measures
Our outcome variable is self-reported depressive symptoms. The questionnaire modules regarding depressive symptoms in the CFPS differ across waves. In the 2010 and 2014 waves, questions to assess depressive symptoms were based on the Kessler 6 Rating Scale (K6), whereas in the 2012, 2016, and 2018 waves, questions were adapted from Center for Epidemiologic Studies Depression Scale (CES-D). The K6 is a six-item inventory asking how often the respondents experience depression, nervousness, agitation, hopelessness, psychological fatigue, and worthlessness during the previous month. The responses for the K6 questions are on a 5-point scale: 0 (never), 1 (once a month), 2 (2–3 times a month), 3 (2–3 times a week), or 4 (almost every day). The possible range of total scores across these six items is 0 to 24, and higher scores on the K6 indicate more frequent or more severe depressive symptoms.
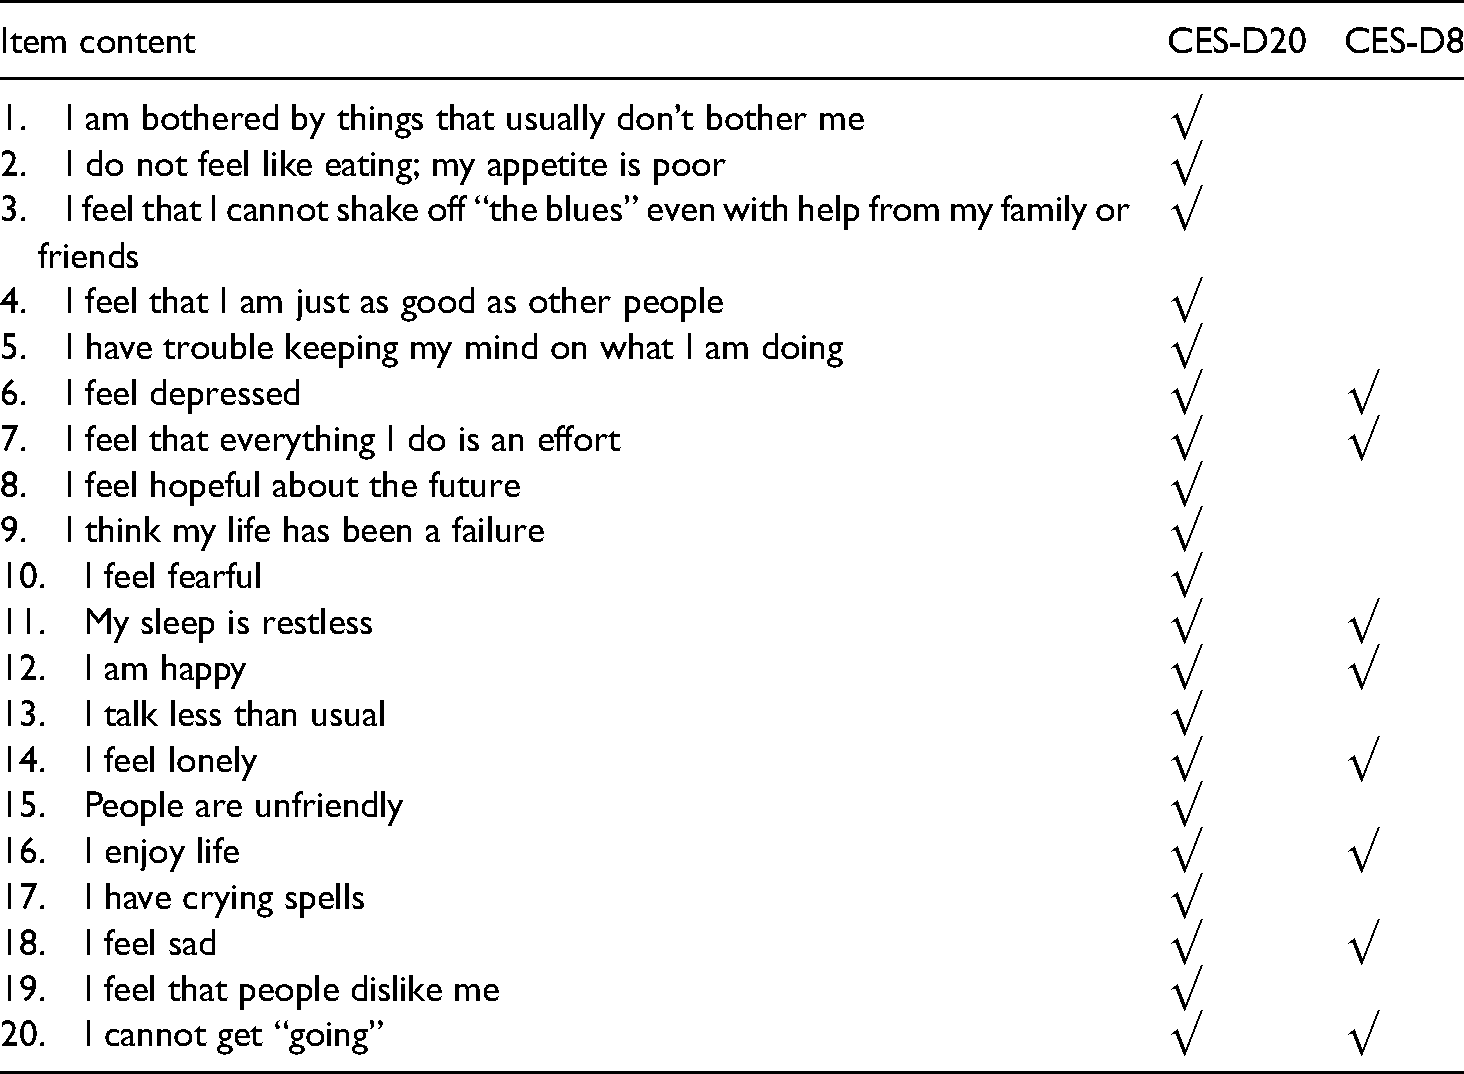
The CES-D scale, originally developed by Radloff (1977), is a 20-question tool, which comprises 16 questions measuring negative feelings and four questions measuring positive feelings. The respondents are asked about the number of days on which they experienced depressive symptoms during the previous week. Responses to the questions are offered on a 4-point scale, where 0 is “rarely” (less than 1 day), 1 is “some days” (1–2 days), 2 is “occasionally” (3–4 days), and 3 is “most of the time” (5–7 days). We reverse-coded the positive questions. The final score for the CES-D scale is the sum of scores for these 20 questions, which ranges from 0 to 60, with higher values indicating more severe depressive symptoms. In the 2012 wave, the CFPS used the original version of the CES-D scale (hereafter CES-D20). Considering that a briefer measurement device could reduce respondent burden and refusal rate, the CFPS attempted to shorten the CES-D scale to a subset of eight items (hereafter CES-D8) in the 2016 and 2018 waves. Specially, in 2016, four-fifths of the respondents were randomly selected to answer the CES-D8 module, and the remainder still answered the CES-D20 module. In 2018, all respondents answered the CES-D8 module. For the sake of continuity, CFPS also converted the score of CES-D8 to that of CES-D20 through the equipercentile equating method. The CES-D20 and CES-D8 questions are reported in Appendix Table 1. Table 1 provides an evaluation of the internal consistency of CES-D8, using the 2016 CFPS data. The Cronbach's α is 0.794, which indicates that internal consistency is acceptable (Boey, 1999).
Internal consistency of Center for Epidemiologic Studies Depression Scale (CES-D).
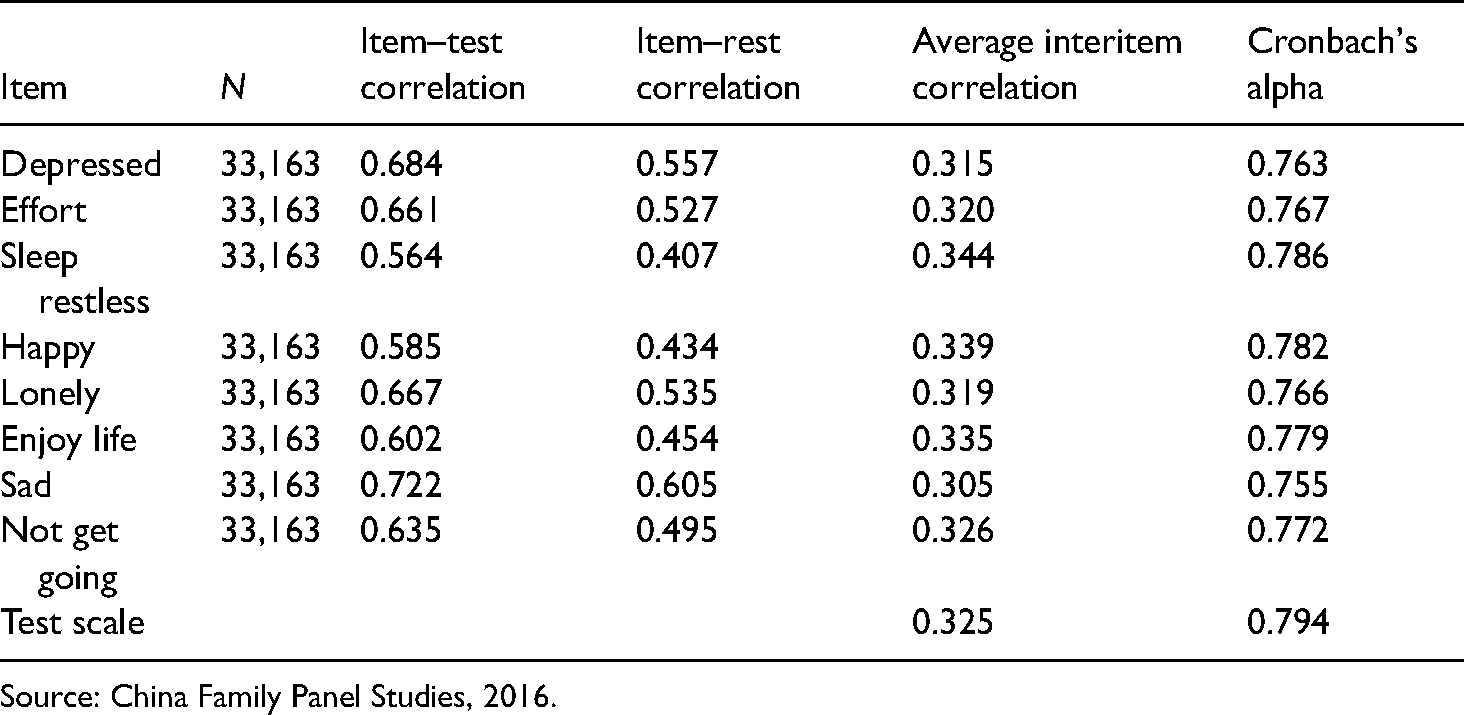
Source: China Family Panel Studies, 2016.
Since a K6 score of 5 or higher (equivalent to a CES-D20 score of 16 or higher, and a CES-D8 score of 7 or higher) indicates a person at risk for clinical depression, 1 we further classify respondents into two categories, “having moderate or severe depressive symptoms”, and “mentally healthy” (coded 0).
Our independent variable is SES. SES is conventionally measured by education, income, and occupational status. Because the proportion of respondents with missing reports on occupation is relatively high, this study employs two indicators of SES: education and household income per capita. We treat education as a four-categorical variable: no education or primary school (coded 0), junior middle school, senior middle school, and any college. To allow for a flexible non-parametric specification of income effect, we group household income per capita into quartiles, with those in the lowest income quartile as the reference group.
The covariates in our multivariate analysis include age, age-squared, marital status, functional capacity, urbanity (based on the current residence of the respondent, rather than hukou status), and province. Age is a continuous variable measured in years. Age and age-squared are included simultaneously to account for the curvilinear relationship between age and mental health. Marital status is also divided into two categories: married/cohabitating, and other. Functional capacity is measured by a modified version of the instrumental activities of daily living (ADL) scale, which asks the respondent to assess the level of difficulty in performing the following seven ADLs: going out for outdoor activities, simple cooking, kitchen activities, taking public transportation, shopping, cleaning, and doing laundry. We recode the original responses into a binary outcome that equals 1 if the person has no difficulty in all seven functions and 0 if they have difficulties in one or more of these functions. 2 Urbanity is also a dummy variable (0 = rural; 1 = urban). To capture provincial variations in socioeconomic development, we also control for the effects of province with dummy variables.
Analytic strategy
We first describe trends in the prevalence of depression among the whole population, stratified by sex, age, and residence, from 2010 to 2018. Using random-intercept logistic regression models, we then examine the association between our outcome variables and two important indicators of SES. An important advantage of the random-effect model is that it is adjusted for clustering of time-specific observation of depression symptoms within the same person over time (Rabe-Hesketh and Skrondal, 2008). To examine how disparities in depression symptoms have changed, we will estimate multivariate statistical models with interactions of SES indicators and survey years. In the regression analyses, survey year was entered as a dummy variable.
Results
Trends in depressive symptoms in China, 2010–2018
Table 2 presents descriptive trends in depression in China from 2010 to 2018. The CFPS questions on depressive symptoms differ across survey waves. For the sake of comparison, we first show the trend between 2010 and 2014 using data from the 2010 and 2014 waves, and then the trend between 2012 and 2018 using the data from the remaining three waves. Overall, depressive symptoms increased significantly from 2010 to 2014. The proportion of respondents with moderate or worse depressive symptoms (K6 ≥ 5) was estimated at 23.7% in 2010; the corresponding figure increased to 26.2% in 2014. Likewise, the period 2012–2018 also witnessed a significant increase in depressive symptoms. Moderate or worse depressive symptoms (CES-D8 ≥ 7) were experienced by 30.1% of the sample in 2012, 30.3% in 2016, and 35.6% in 2018. Despite some fluctuations over time, the results derived from CES-D20 are generally consistent with those from CES-D8.
Mean depression in China, 2010–2018 a .
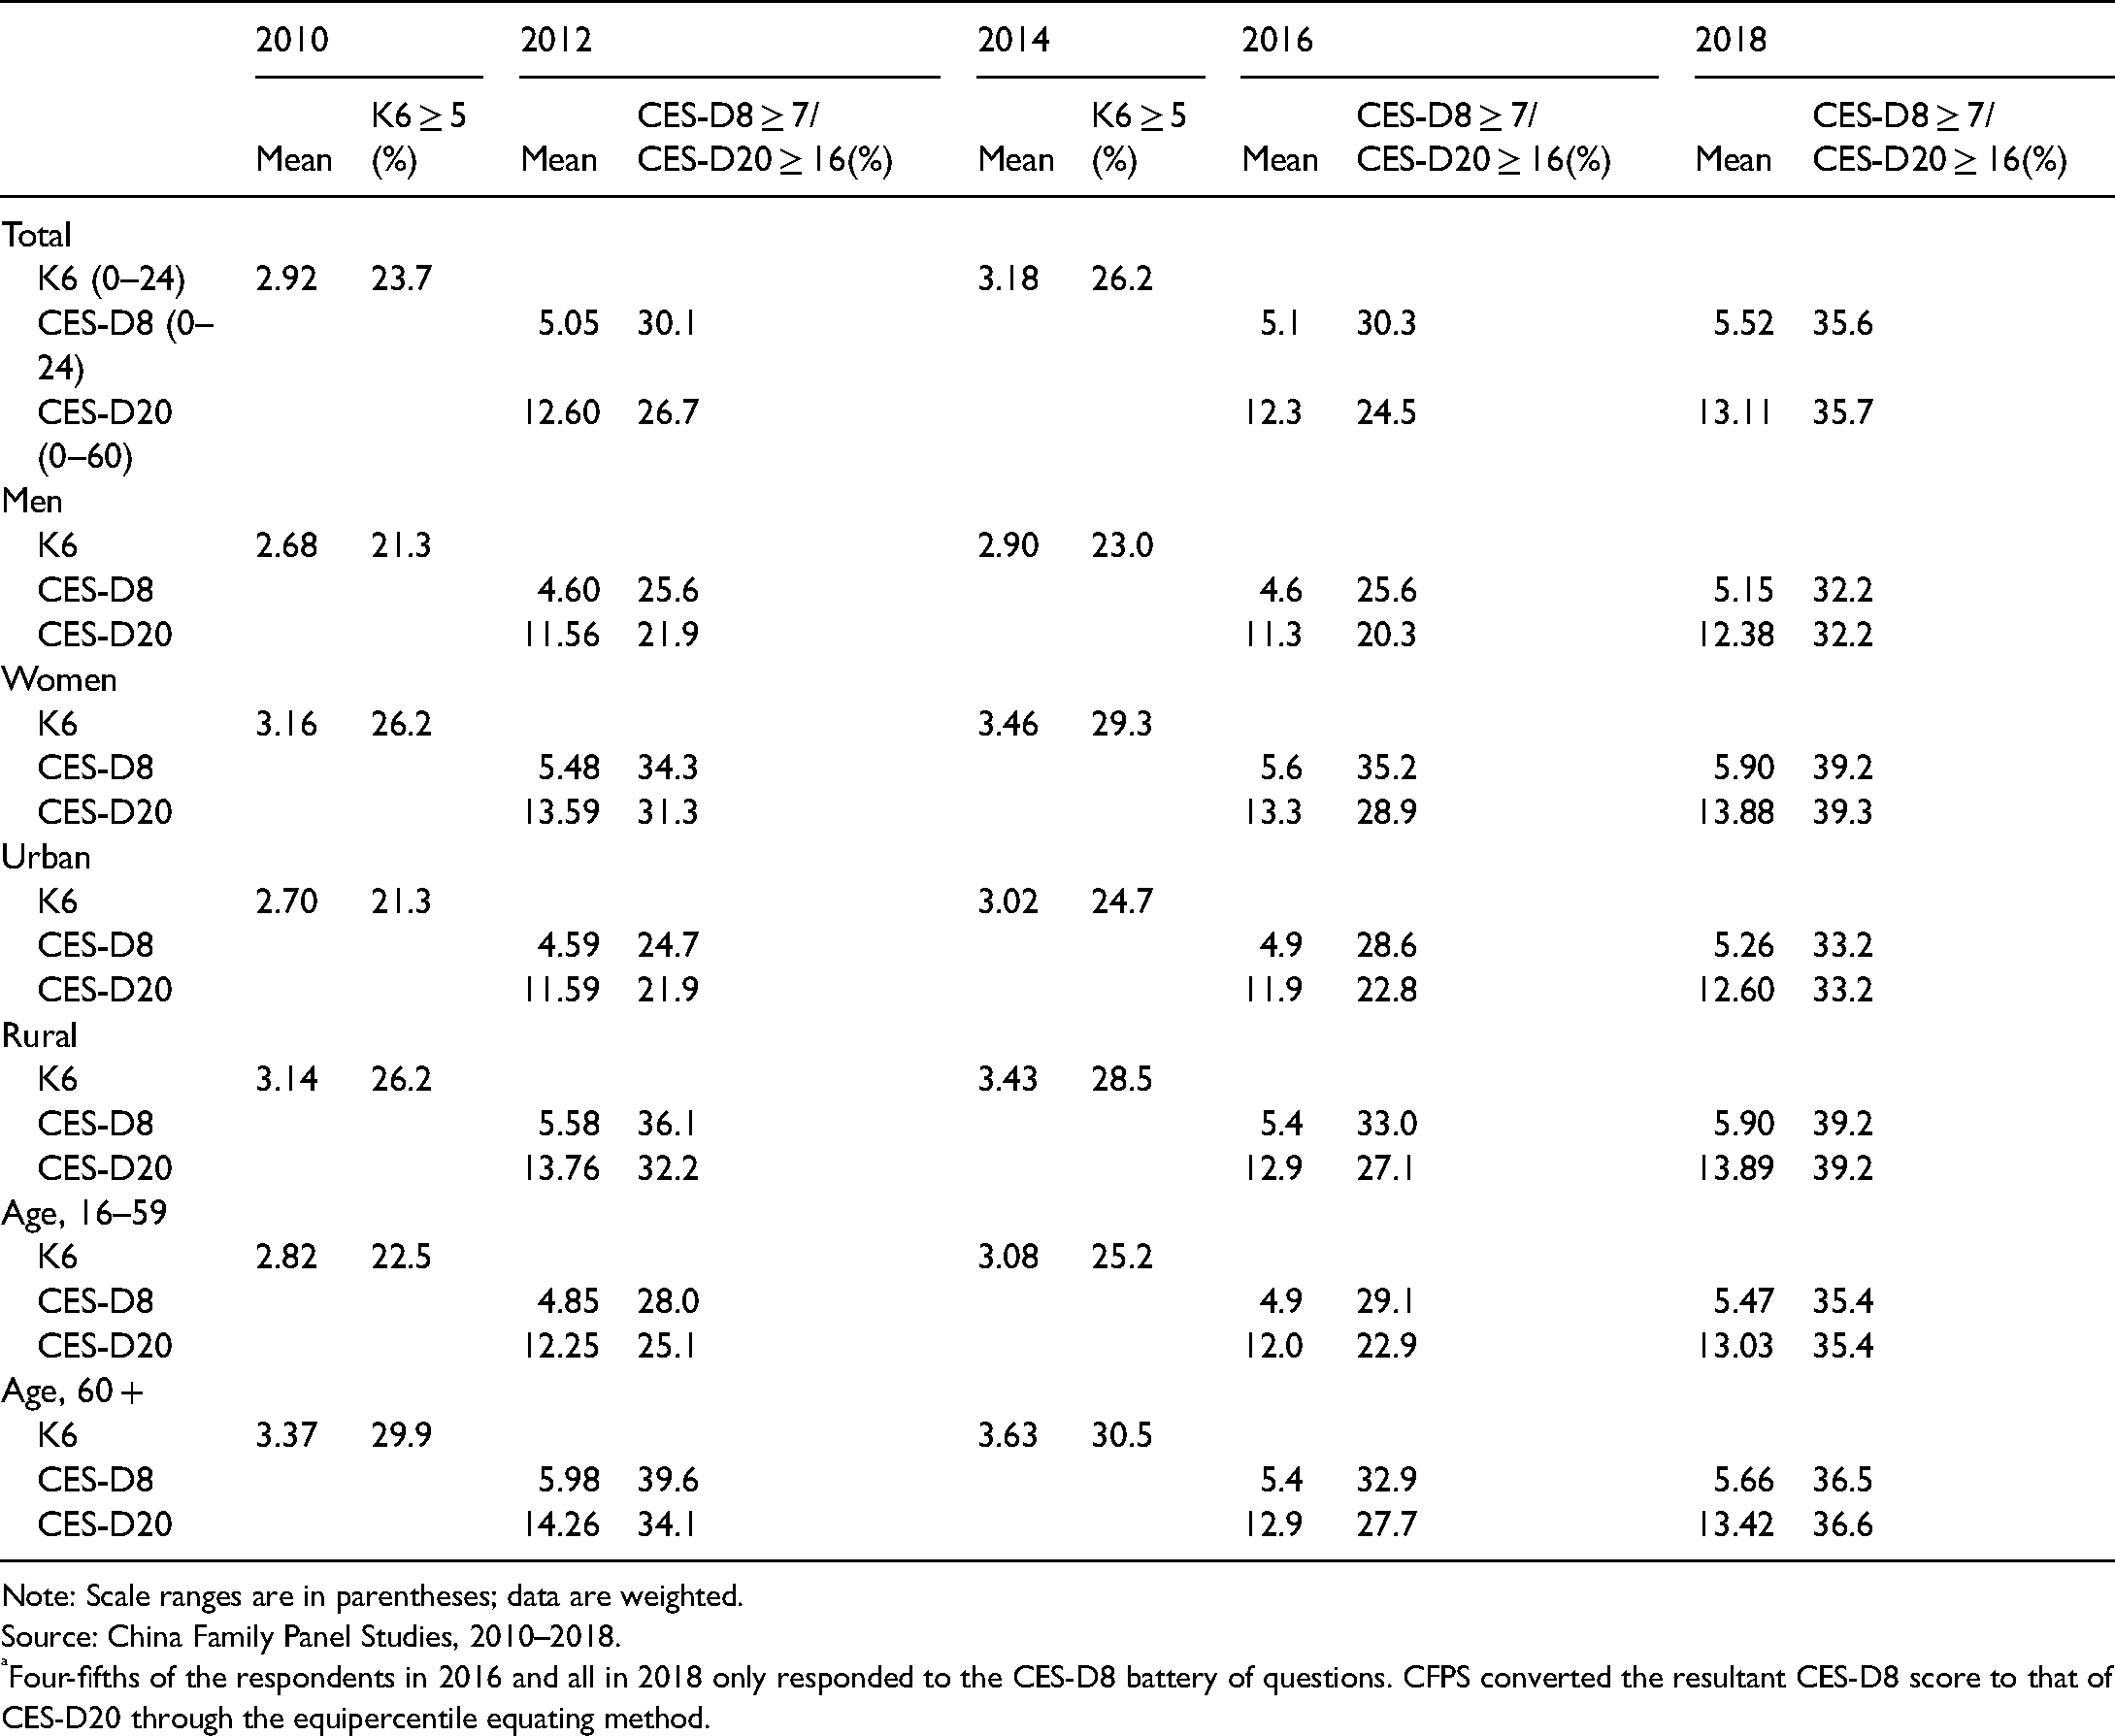
Note: Scale ranges are in parentheses; data are weighted.
Source: China Family Panel Studies, 2010–2018.
Four-fifths of the respondents in 2016 and all in 2018 only responded to the CES-D8 battery of questions. CFPS converted the resultant CES-D8 score to that of CES-D20 through the equipercentile equating method.
We further stratify the analyses by sex, residence, and age. Stratifying the population by sex, significant increases in depression from 2010 to 2014 were observed for both men and women, though women had a higher prevalence of depressive symptoms. The tendency to increase held for both men and women from 2012 to 2018. For example, the proportion of men with moderate or worse depressive symptoms (K6 ≥ 5) increased from 21.3% to 23.0% during the period 2010–2014. The prevalence of moderate or worse depressive symptoms among women increased over this period as well, by 3 percentage points.
A rural–urban differential in depression is apparent; urban residents had a consistently lower prevalence over the eight-year observation window. Both urban and rural residents experienced significant increases in depression over time. Moreover, during the period 2010–2014, urban residents had a larger increase in the prevalence of depression. The share of urban residents who had moderate or worse depressive symptoms (K6 ≥ 5) increased from 21.3% in 2010 to 24.7% in 2014. A similar trend is seen during the period 2012–2018, with the proportion of urban residents having moderate or worse depressive symptoms increasing from 24.7% to 33.2%, compared to a rise from 36.1% to 39.2% among rural residents.
Stratified analysis by age shows that depressive symptoms are particularly prevalent among the elderly (those aged 60 and older). In 2010, moderate or worse depressive symptoms (K6 ≥ 5) among the elderly was estimated at 29.9%, 7.4 percentage points higher than the corresponding figure for the non-elderly. Significant increases in depression from 2010 to 2018 were observed, especially among the non-elderly (ages 16–59). During the period 2010–2014, the prevalence of moderate or worse depressive symptoms (K6 ≥ 5) among the non-elderly increased from 22.5% to 25.2%; meanwhile, this prevalence (CES-D8 ≥ 7) increased from 28.0% to 35.4% during the period 2012–2018.
Socioeconomic differentials in depressive symptoms in China, 2010–2018
To systematically examine socioeconomic differentials in the fraction of respondents with moderate or severe depressive symptoms, we estimate the random-intercept logistic regression models described above. We conduct separate analyses for women and men. We present the regression results for the study period 2010–2014 in Table 3, with the K6 scores coded as a dummy variable. Models for women are presented in the two left-hand columns of Table 3 and models for men are in the remaining columns of the table.
Random-intercept logistic regressions for moderate or severe depressive symptoms (K6 ≥ 5) among Chinese adults aged 16 and older.
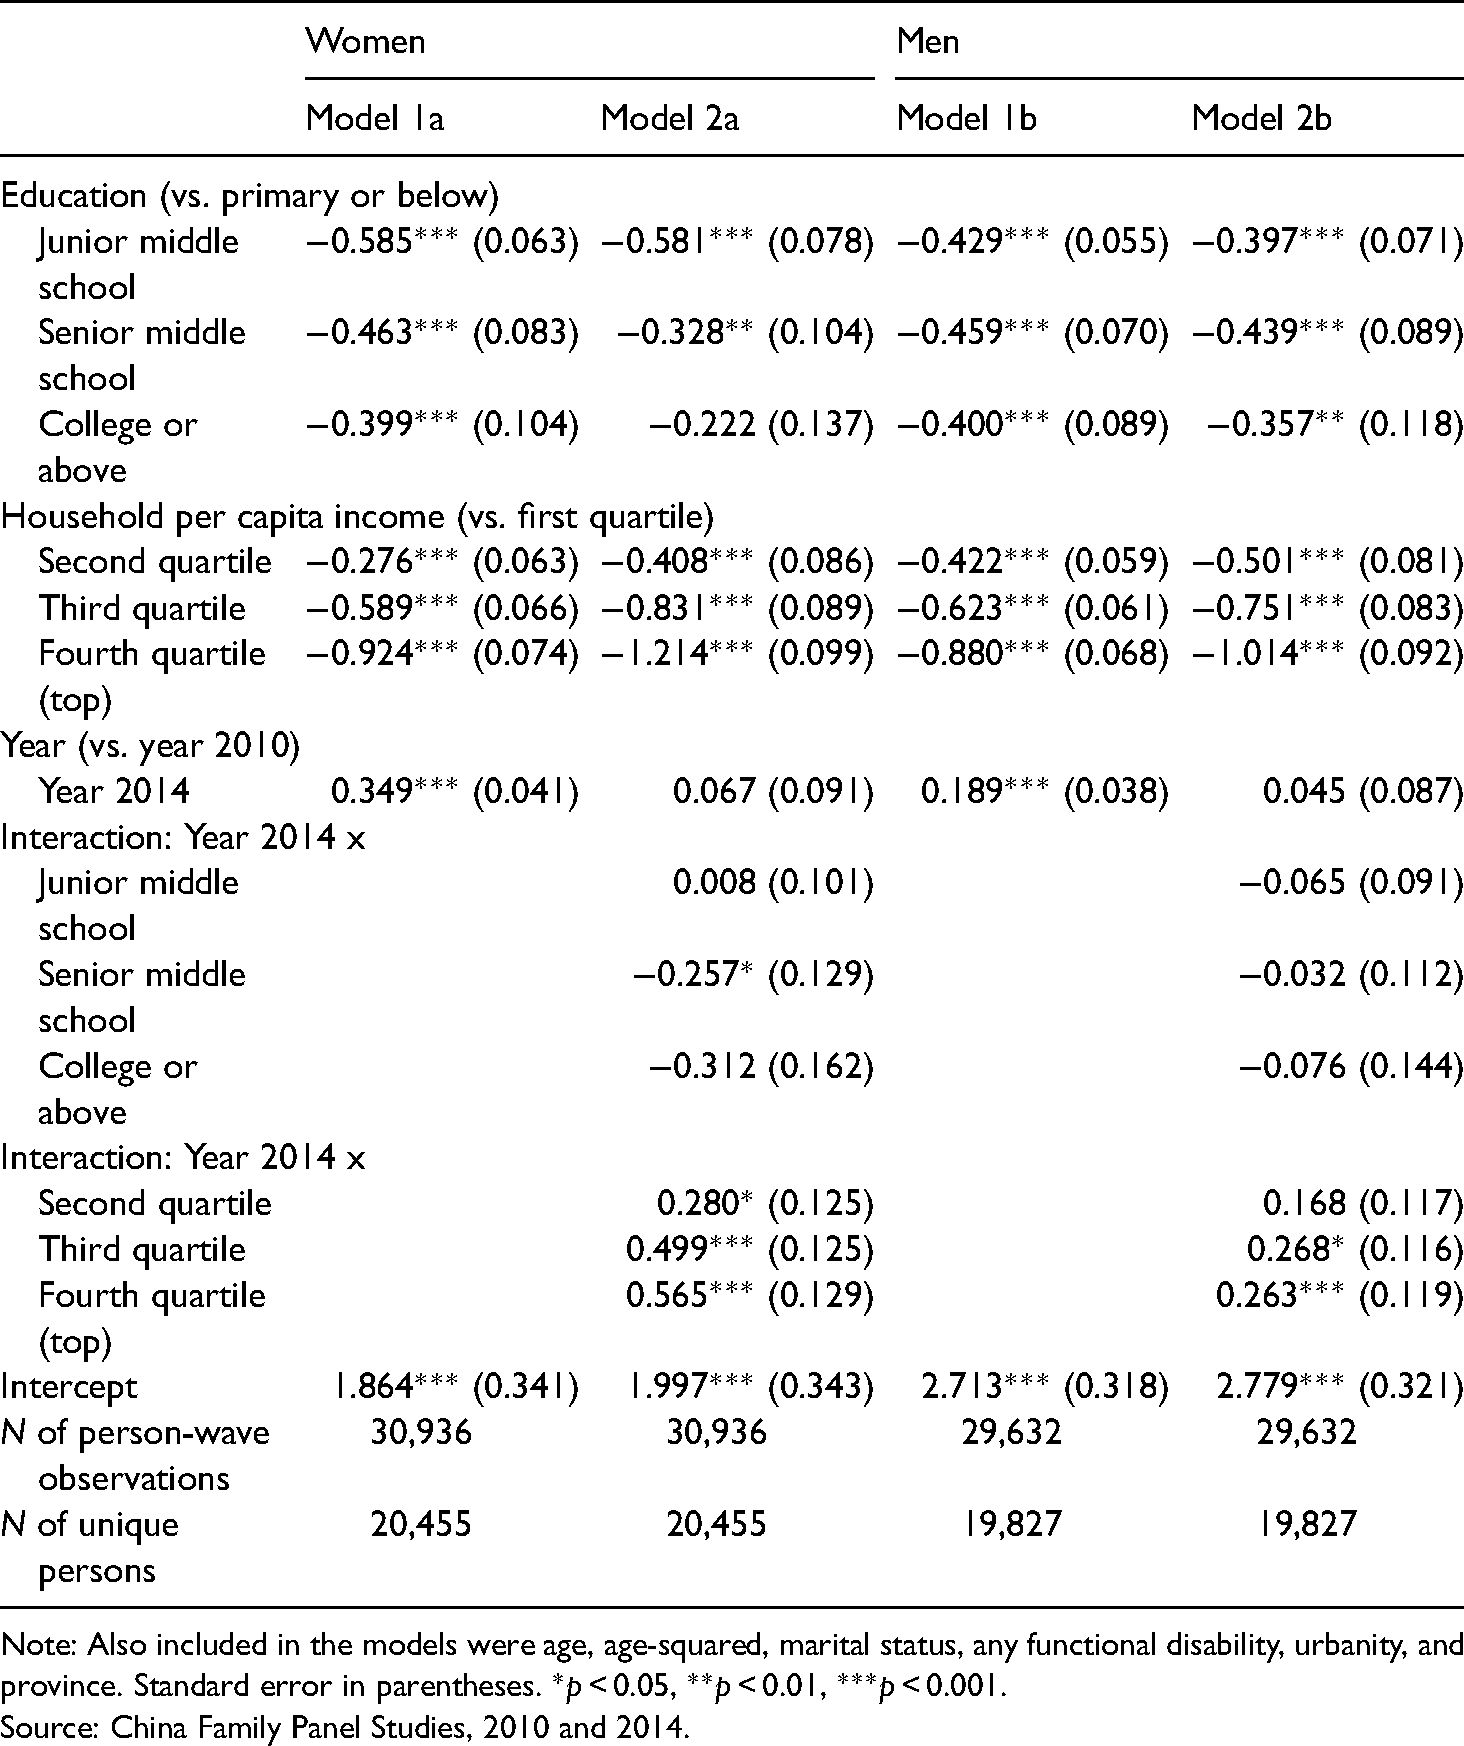
Note: Also included in the models were age, age-squared, marital status, any functional disability, urbanity, and province. Standard error in parentheses. *p < 0.05, **p < 0.01, ***p < 0.001.
Source: China Family Panel Studies, 2010 and 2014.
For women, the results in Model 1a of Table 3 show that the coefficients for the education dummy variables are negative and significant, indicating that groups of people with junior middle school education, with senior middle school education, and with any college education are all less likely to suffer from moderate or worse depressive symptoms when compared to their counterparts who have only a primary school education or lower. Specifically, the odds of having moderate or severe depressive symptoms were about 44% (i.e. exp[−0.585]−1 = −0.443) lower for the junior middle school group, about 37% (i.e. exp[−0.463]−1 = −0.371) lower for the senior middle school group, and about 33% (i.e. exp[−0.399]−1 = −0.329) lower for the college educated group, when compared to the lowest-education group. Likewise, high income can protect people from being depressed. Women in the second-quartile, third-quartile, and fourth-quartile income groups are 24.1% (i.e. exp[−0.276]−1 = −0.241), 44.5% (i.e. exp[−0.589]−1 = −0.445), and 60.3% (i.e. exp[−0.924]−1 = −0.603) less likely to suffer from moderate or severe depressive symptoms, respectively, compared to their counterparts in the first-quartile income group. The positive and significant coefficient for the year dummy variable indicates that the increase in depression among women from 2010 to 2014 was also significant after adjusting for sociodemographic variables.
Assessing trends by SES in depressive symptoms requires paying attention to the interaction terms for year-by-SES categories. In Model 1b of Table 3, the statistically insignificant interactions between education groups and the survey year indicate that there was generally no significant difference in the rate of depression increase across education groups from the year 2010 to the year 2014. In contrast, the interaction terms for year-by-income categories are positive and significant, suggesting that disparities narrowed between the lowest and the other income groups. For example, the odds of moderate or worse depressive symptoms among women in the first-quartile income group did not show a statistically significant increase over time from 2010 to 2014. During the four-year study period, for women in the second-quartile income group, the likelihood of having moderate or worse depressive symptoms increased by about 32%. There was a greater increase over time in the odds of depressive symptoms among women in the third-quartile income group and in the top-quartile income group (65% and 76%, respectively).
Turning to the results for men (the right half of Table 3), we also found that higher SES (regardless of education and income) is associated with lower chance of having moderate or severe depressive symptoms in the beginning of 2010 (main effects of education and income dummy variables). The interactions between the education dummy variable and survey year are not statistically significant, indicating that educational inequalities in depressive symptoms held steady over the course of 2010–2014. In contrast, the positive sign of interactions between income dummy variables and survey year indicate that depression prevalence increased between 2010 and 2014, most dramatically among those in the higher income groups. Both men in the first-quartile income group and in the second-quartile income group did not see a statistically significant change in the likelihood of experiencing moderate or worse depressive symptoms. Those in the third-quartile income group and those in the top-quartile income group saw statistically significant increases in the odds of moderate or worse depressive symptoms of about 31% and 30%, respectively.
Trends in depression disparities during the period 2012–2018 were substantially the same as those during the period 2010–2014. The random-intercept logistic regression models in Table 4 show the trends across time in depression prevalence among both women and men, using the definition of having depressive symptoms (moderate or worse) based on CES-D8 ≥ 7. Again, models for women are presented in the two left-hand columns of Table 4 and models for men are in the remaining columns of the table. Among women, lower education levels are associated with higher depression rates across the entire time period; that is, the better educated people become, the less depressive they are. The interaction terms between education groups and the survey year are generally significant and positive. They indicate that depression prevalence grew from 2012 to 2018, most significantly among those with higher educational attainment (although as for depressive symptoms, the growth rates across education groups were not strictly monotonic in each survey wave). On the contrary, the year–income interactions are not significant.
Random-intercept logistic regressions for moderate or severe depressive symptoms (CES-D8 ≥ 7) among Chinese adults aged 16 and older.
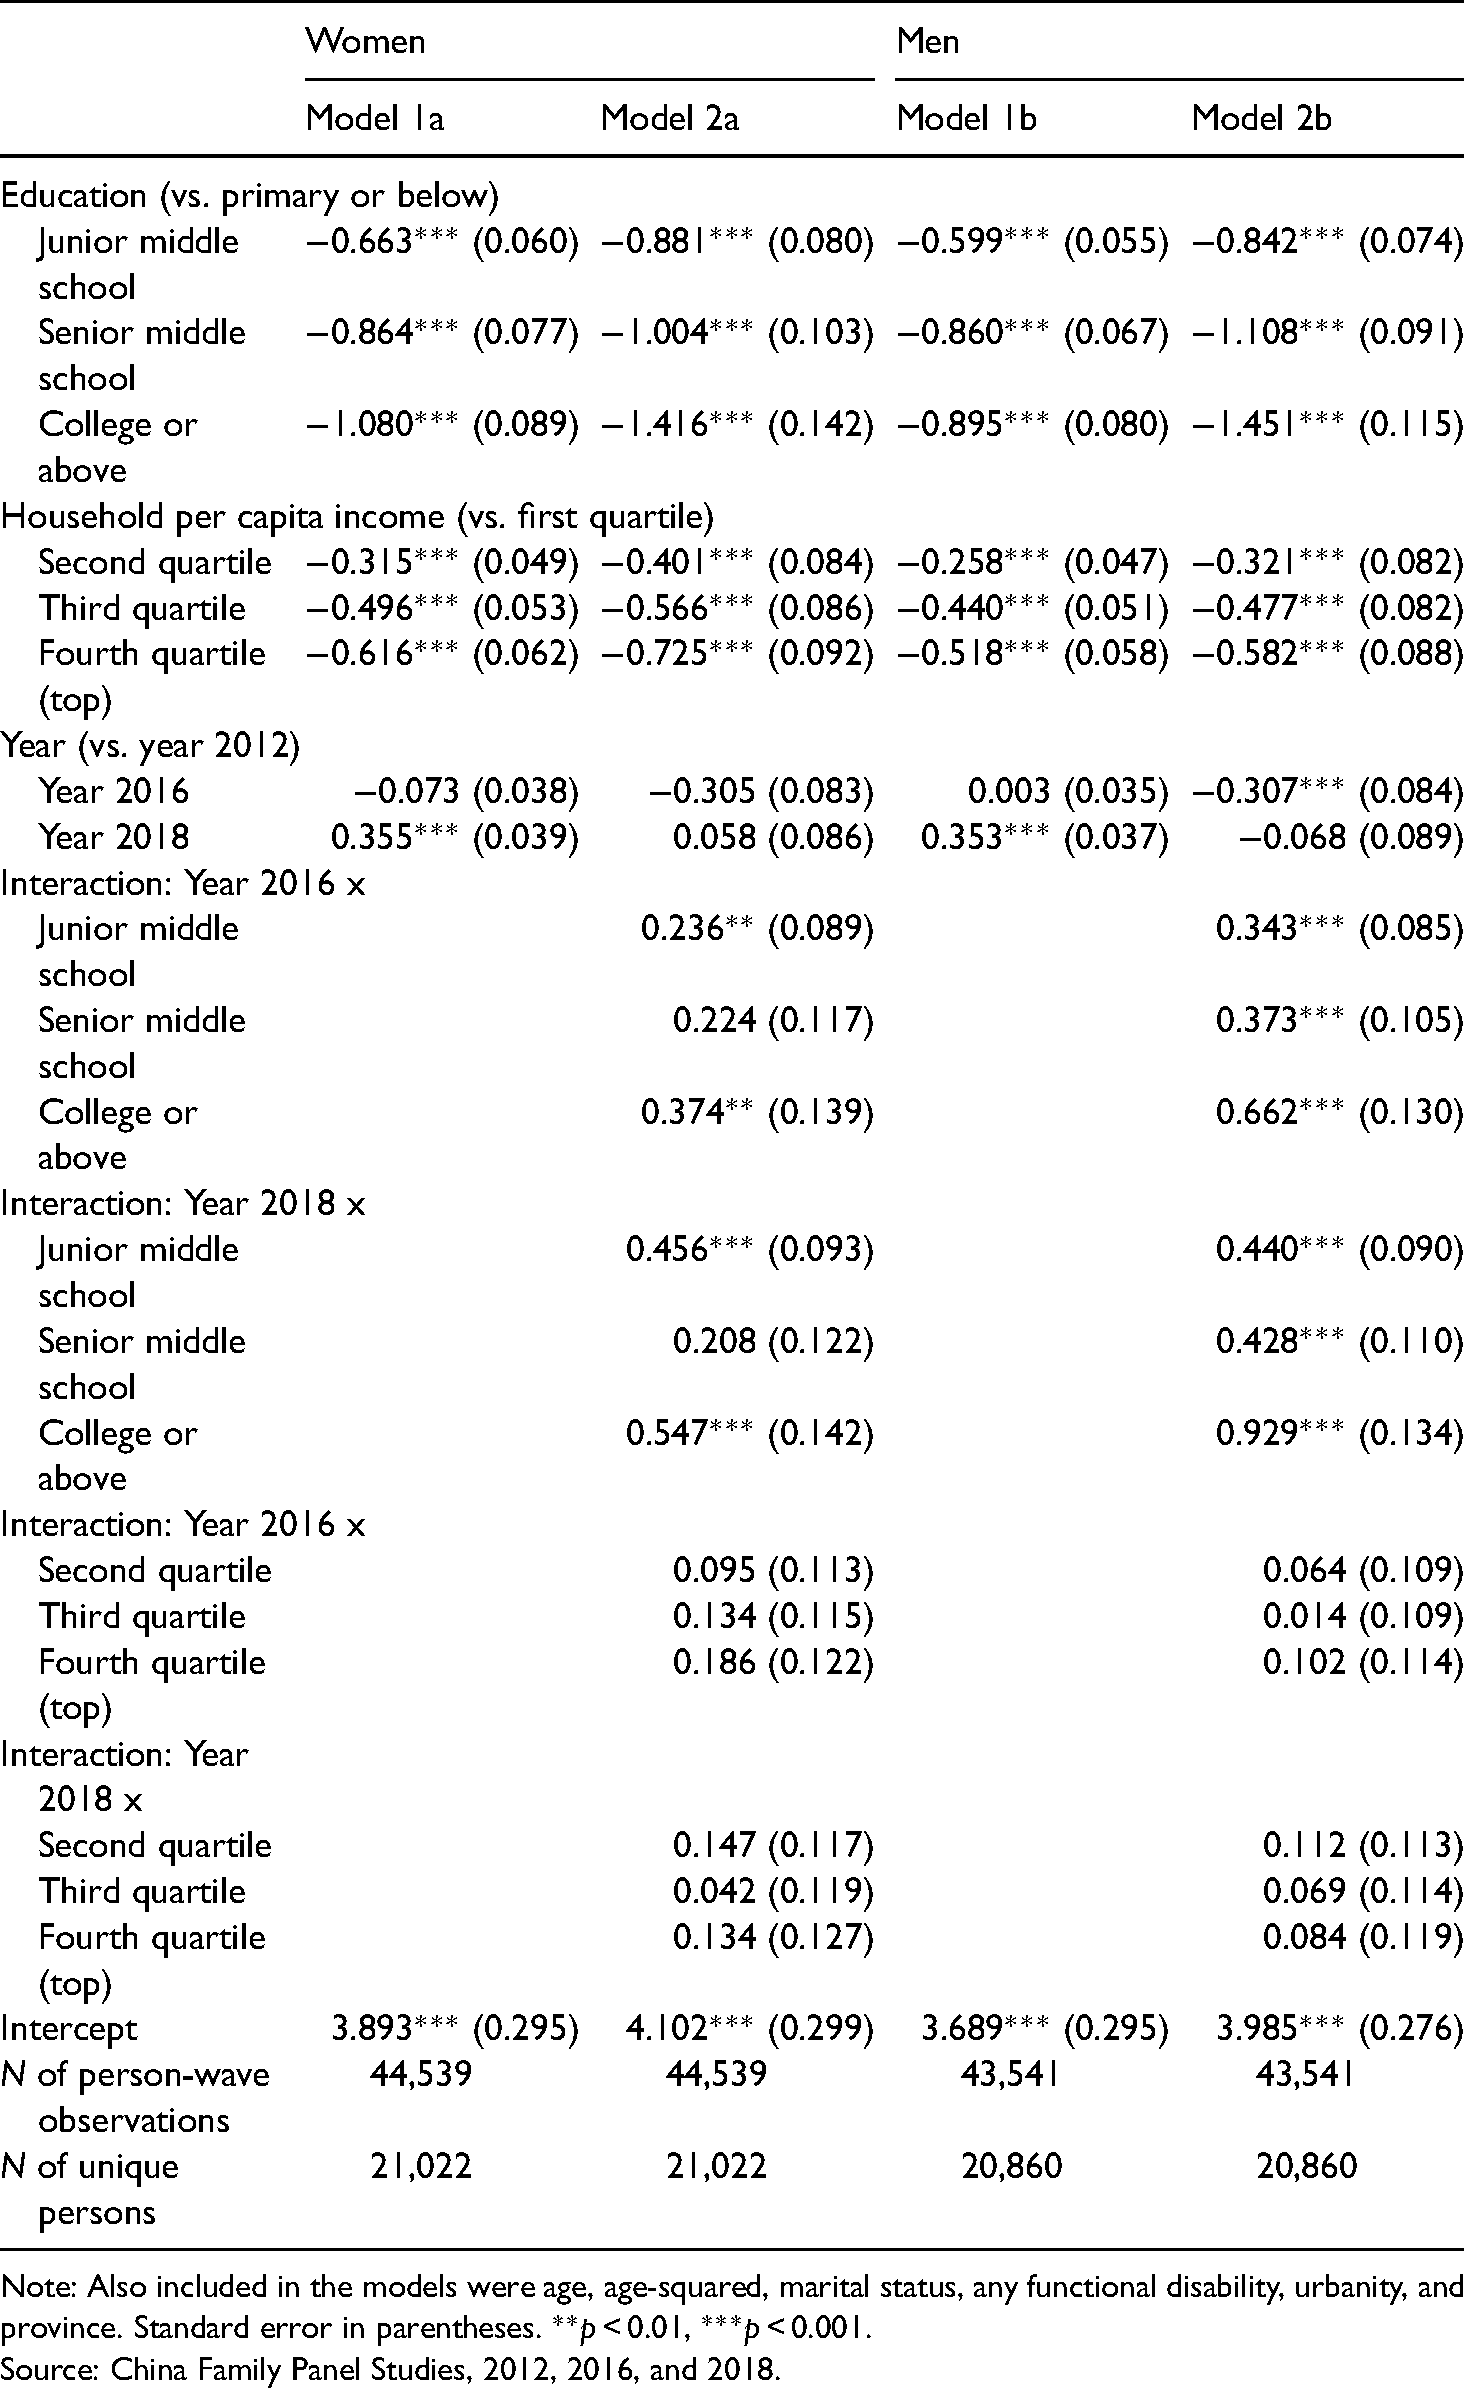
Note: Also included in the models were age, age-squared, marital status, any functional disability, urbanity, and province. Standard error in parentheses. **p < 0.01, ***p < 0.001.
Source: China Family Panel Studies, 2012, 2016, and 2018.
In terms of disparities in depression and depressive symptoms during the period 2012–2018, the same patterns were present for men as for women: a negative relationship between two indicators of SES and depression prevalence; an increase over time in depression, especially among those with more educational attainment; and trends across time in the odds of depressive symptoms were not significantly different by income categories.
Discussion and conclusion
This study aims to investigate trends across time in the prevalence of depression from 2010 to 2018 in the Chinese population aged 16 and older. We extend the previous literature on depression prevalence in three areas: (a) we provide the most up-to-date information on secular changes in depression prevalence in China; (b) we evaluate the external validity of existing findings concerning the SES–depression association by examining this association among Chinese adults; (c) we examine trends across time in depression by SES in the Chinese context.
A key finding is that there was a significant increase in the overall prevalence of depression and depressive symptoms in China during the eight-year study period. The initial year of this study period, 2010, already saw a high fraction of Chinese adults suffering from high levels of depressive symptoms, with nearly 24% of the population having a K6 score of 5 or more. Afterwards, an overall increase in depression prevalence persisted among Chinese adults. This pattern generally remains consistent across sex, age, and residence divides. Though less optimistic than that presented by Easterlin et al. (2012) for the period 2006–2010, the finding of a substantial uptrend in depression for China between 2010 and 2018 is consistent with recent evidence from studies of adults in Western countries (e.g. Barr et al., 2015; Linder et al., 2020; Weinberger et al., 2018) and of adults in China with older data (Ren et al., 2020). The estimated high and continuously growing prevalence of depression in recent years calls for the government to pay more attention to the mental health of the population, as well as to the construction of sustainable mental health systems and services.
This study provides new evidence in support of a negative association between SES and depression among adults in China. While China is characterized by its particular social, cultural, and political systems (e.g. Confucianism and the work unit), which may function as structural forces to override the importance of person-level or family-level SES on mental health, we find overall strong evidence for a negative association between (both person-level and family-level) SES and depression among Chinese adults. Given the existence of social inequality in China, a large rural–urban gap and regional disparities may contribute to the high fraction of people suffering from moderate or severe depressive symptoms. Any policy designs towards the reduction of rural–urban and regional disparities would lead to improvements in the mental health and reductions in health disparities.
Our main finding is concerned with trends across time in depression by SES. Here, we find that the rate of increase in depression was more rapid among people with high levels of education and family income, and therefore depression inequalities showed a tendency to decline between 2010 and 2018. This finding is not consistent with the expectation of fundamental cause theory—the association between SES and health is robust and persistent over time, while no fixed set of intervening factors accounts for this association (Link and Phelan, 1995; Phelan et al., 2004, 2010). However, we do not mean the complete rejection of this theory, since depression is only one dimension of health outcomes. We speculate that convergence by SES over time is partly due to higher SES groups suffering disproportionally from the adverse consequences of economic slowdown, urbanization, and migration.
There are several limitations of this study. First, stigmatization towards mental illness and inadequate mental health services may lead to an underestimation of depression, especially in rural China. Due to potential differences in mental health literacy, we may also underestimate socioeconomic disparities in depression prevalence. Second, depression symptoms were self-reported, using the K6, CES-D20, or CES-D8 scale. Self-reporting is subject to recall or reporting bias. Moreover, although the reliability and validity of the K6/CES-D20/CES-D8 scales has been well established, they will never be a substitute for clinical diagnosis (Li et al., 2021; Verbeek et al., 2019). It should also be noted that the prevalence estimated from the K6/CES-D20/CES-D8 is not comparable to the overall rate of depressive disorders estimated from the China Mental Health Survey, because the latter adopts a clinical-based instrument. Third, we do not rule out the possibility that depressive symptoms can affect SES, and that some unobserved variables can confound the relationship between depression and SES. The relationships between the two variables are not necessarily causal. Finally, future research is needed to explore the determinants of the increase in depressive symptoms, and why depression prevalence increases faster among higher SES groups.
Footnotes
Acknowledgment
The authors would like to thank Chunni Zhang for her very helpful comments.
Declaration of conflicting interests
The authors declared no potential conflicts of interest with respect to the research, authorship, and/or publication of this article.
Funding
The authors disclosed receipt of the following financial support for the research, authorship, and/or publication of this article: This work was supported by the Fudan University's “Double First Class” initiative key project “Sociological Theory and Method Innovation Platform for Social Transformation and Governance”, and the Shanghai Municipal Education Commission Research and Innovation Project (E00026).
Notes
Appendix Table 1. Center for Epidemiologic Studies Depression Scale (CES-D) questions.
| Item content | CES-D20 | CES-D8 |
|---|---|---|
| 1. I am bothered by things that usually don’t bother me | √ | |
| 2. I do not feel like eating; my appetite is poor | √ | |
| 3. I feel that I cannot shake off “the blues” even with help from my family or friends | √ | |
| 4. I feel that I am just as good as other people | √ | |
| 5. I have trouble keeping my mind on what I am doing | √ | |
| 6. I feel depressed | √ | √ |
| 7. I feel that everything I do is an effort | √ | √ |
| 8. I feel hopeful about the future | √ | |
| 9. I think my life has been a failure | √ | |
| 10. I feel fearful | √ | |
| 11. My sleep is restless | √ | √ |
| 12. I am happy | √ | √ |
| 13. I talk less than usual | √ | |
| 14. I feel lonely | √ | √ |
| 15. People are unfriendly | √ | |
| 16. I enjoy life | √ | √ |
| 17. I have crying spells | √ | |
| 18. I feel sad | √ | √ |
| 19. I feel that people dislike me | √ | |
| 20. I cannot get “going” | √ | √ |