
Abstract
How was testing—and not testing—for coronavirus articulated as a testing situation on social media in the Spring of 2020? Our study examines everyday situations of Covid-19 testing by analyzing a large corpus of Twitter data collected during the first 2 months of the pandemic. Adopting a sociological definition of testing situations, as moments in which it is no longer possible to go on in the usual way, we show how social media analysis can be used to surface a range of such situations across scales, from the individual to the societal. Practicing a form of large-scale data exploration we call “interpretative querying” within the framework of situational analysis, we delineated two types of coronavirus testing situations: those involving locations of testing and those involving relations. Using lexicon analysis and composite image analysis, we then determined what composes the two types of testing situations on Twitter during the relevant period. Our analysis shows that contrary to the focus on individual responsibility in UK government discourse on Covid-19 testing, English-language Twitter reporting on coronavirus testing at the time thematized collective relations. By a variety of means, including in-memoriam portraits and infographics, this discourse rendered explicit challenges to societal relations and arrangements arising from situations of testing and not testing for Covid-19 and highlighted the multifaceted ways in which situations of corona testing amplified asymmetrical distributions of harms and benefits between different social groupings, and between citizens and state, during the first months of the pandemic.
Introduction
In the Spring of 2020, testing, and not testing, for coronavirus 1 emerged as a central concern as our societies grappled with the pandemic. As World Health Organization head Tedros Adhanom Ghebreyesus put it in a video release on 16 March 2020: “We have a simple message for all countries: test, test, test.” 2 At the time, much of the media debate about the new coronavirus focused on the need for diagnostic testing and contact tracing, and in many if not most countries, testing was central to the government response to Covid-19. In the United Kingdom, the Prime Minister made an analogy with pregnancy testing to define its approach. In March 2020, Boris Johnson declared that the United Kingdom can turn the tide of the disease in 12 weeks, citing “the possibly rapid rollout of an antibody test ‘as simple as a pregnancy test’” as key to achieving this. 3 Testing for coronavirus would soon be as easy as the familiar practice of taking an over-the-counter test at home, or wherever you want. This emphasis on “testing made easy” is reminiscent of an argument in social studies of health, where self-testing and self-tracking have been identified as key instruments for realizing (neo-)liberal forms of health governance anchored in self-responsibilization (Kapeller & Loosman, 2023; N. Rose & Novas, 2005). 4 The confidence in market solutions expressed by Boris Johnson also invokes the ideal of the entrepreneurial state (Martin, 2022), as self-testing was framed as a significant commercial opportunity for the United Kingdom. 5 However, even as this “success” formula was flaunted, the actual situation in March 2020 was marked first and foremost by a lack of availability of coronavirus tests of any kind.
In this context, we asked: How was testing and not testing for Covid-19 reported in everyday media? How was coronavirus testing articulated as a testing situation in digital reporting in the Spring of 2020? As politicians projected what initially seemed unrealistic scenarios of “testing made easy,” were journalists, experts, and everyday people reporting on the constraints and challenges involved in testing for Covid-19? To address this question, we undertook a study of posts related to Covid-19 testing on Twitter during the period March–May 2020, based on an initial data set of 75 million tweets. We focused on Twitter due to the role that it played in this pandemic and in other crises as a medium for following and participating in news and events, the sharing of everyday life, and as an emergency communication platform (Burgess & Baym, 2020; Rogers, 2013). Different from other studies of Covid reporting on Twitter (Cheng et al., 2021; Green et al., 2022), our study implements an interpretative methodology called situational analytics (Marres, 2020) to identify coronavirus testing situations from a large volume of Twitter data collected. At the outset of our study, we defined testing situations in terms of moments in which the constraints and challenges of testing—and not testing—for coronavirus become apparent, but, as we will discuss, our data analysis showed an unexpectedly (for us) strong preoccupation in Twitter reporting on coronavirus testing with collective relations, with the ways in which the Covid pandemic and pandemic responses put to the test relations between individuals and communities, citizens and governments, and between different social groupings and professions. In this respect, we observe a contrast between the focus in Twitter reporting on Covid testing as a challenge to collective relations and responsibilities and the UK government’s discourse on testing as an individual responsibility (Andreouli & Brice, 2022). We develop this perspective on the situational articulation of social relations at scale by adapting the qualitative methodology of situational analysis (Clarke, 2005) for the analysis of social media, through a practice of “interpretative querying” of large data sets.
The article is structured as follows. We begin with a discussion of our conceptual framework and methodology for analyzing testing situations with of digital and visual methods. A key affordance of social media for the study of testing situations is that it enables us to study such situations across scales, from the household to the nation and perhaps even global level. As our initial data set consisted of 75 million tweets, we were struck from the start by its potential for developing such a cross-scalar analysis of testing situations, but this comes with significant analytical and methodological challenges. We discuss our strategy for data reduction, which consists of a combination of query design and “sub-setting” in some detail, as it is a core element of our interpretative approach to social media analysis, allowing to conduct qualitative analysis on large quantitative data sets. Next, we present our interpretative research design and our use of lexicon analysis to surface salient situations from Twitter data and of image analysis to determine what composes these selected situations. We then provide an overview of our principal findings, and the wider contribution that our approach seeks to make, showing how social media research can be used to surface societal perspectives during a time of emergency. In our conclusion, we reflect on the possibilities of social media research to provide insight into public engagement with Covid-19 (M. Green et al., 2021) and the potential of such research to inform expert understandings of a public emergency.
Analyzing Testing Situations Across Scales: Twitter Accounts of (Not) Testing for Coronavirus
When coronavirus testing emerged as an urgent concern in the Spring of 2020, we were reminded of sociological ideas about the double-sided nature of testing in society. As Marres and Stark (2020) note, a physical test may do double duty as a social test. Robinson (2020) demonstrates the principle in relation to pregnancy testing: When you take a pregnancy test, you are testing your body, but at the same time, your relationships are being put to the test. Discovering that you are pregnant (or not), tests your relation with a partner, your friends, family, and it is likely to challenge wider relations, with an employer and the state. The French sociology of testing (la sociologie des épreuves) has proposed that tests and testing may function as a sociological heuristic: the way we test—or not test—can reveal the type of society we live in (Barthe et al., 2013). Linhardt (2009) showed how particular tests—such as on-the-road alcohol tests used by the French police—can serve as empirical occasions, moments in which underlying collective relations are rendered explicit, as in this case, the public management of the population by the French version of a nanny state. Marres (2020) discusses how scientific testing today takes place “beyond the laboratory,” in online platforms and in settings like road trials of smart vehicles, something which puts society to the test in yet another way: Everyday environments in society are being re-configured as test environments.
These ideas seemed highly relevant to the Covid-19 emergency that unfolded in the Spring of 2020. Improvised arrangements for coronavirus testing were being set up “beyond the lab” across communities, in shopping malls, parking lots, streets, and eventually, airports. It seemed intuitively clear to us that testing for coronavirus, too, did double duty as a social test. But how exactly? At the time, English-language news articles on coronavirus testing tended to focus on the availability and relative merits of different types of tests and testing infrastructures (PCR vs. antibody tests, symptom-based testing through apps). In some cases, the social and political aspects of testing were addressed, as when The Financial Times reported in May 2020 on “How the coronavirus pandemic has tested UK doctors.” 6 But such articles rather focused on the ways Covid put individuals to the test, and not so much their relations.
Scrolling through Twitter, however, we did find reports of corona testing that highlighted its socially testing character. For example, users in California reported on the ways in which the new coronavirus testing infrastructures disadvantaged some social groupings as compared to others. In San Francisco’s Tenderloin neighborhood, registration for free coronavirus testing required a smartphone, highlighting how pandemic governance consolidated digital inequality: “Alphabet-owned company requires a smart phone and linked @google account [. . .] In.The.Tenderloin.” 7 Other Twitter users drew attention to the practical challenges raised by coronavirus testing for people with symptoms: “How can people ill with Covid be expected to drive to a testing center to get a test?” 8 (see Figure 1). The striking part about such social media accounts, we found, was the emphasis they placed on the practical constraints involved in testing and not testing for Covid-19 (“no phone”). We were struck by the way some offered a situated perspective (“Asking as a non-driver”) and alluded to socio-technical challenges in the implementation of coronavirus testing, such as digital inequality.

Situational accounts of (not) testing for Covid-19 on Twitter, May 2020.
Could social media analysis help demonstrate how (not) testing for coronavirus had proven socially testing in the first few months of the pandemic? 9 As noted, when the Covid pandemic started, Twitter was a prominent platform in our societies for participation in media events as well as for communication of emergency and disruption (Burgess & Baym, 2020; Perriam, 2023; Thelwall & Thelwall, 2020). Over the last few years, scholars have turned to Twitter to analyze public reactions, controversies, and sentiment about various aspects of the pandemic, such as vaccination, social distancing, lockdown, and face masks (see, e.g., Cascini et al., 2022; Charquero-Ballester et al., 2021; Pascual-Ferrá et al., 2021; Xue et al., 2020). It appears the topic of testing (and not testing) is less frequently addressed (for a review of studies on social media and the Covid-19 pandemic, see Tsao et al., 2021). Given the informal accounts of testing situations we had encountered in this medium, it seemed for us to be uniquely suitable to study the situational challenges raised by testing and not testing for coronavirus in society.
Fortuitously, our colleague Iain Emsley had decided to capture Twitter data on the subject (query: coronavirus) on 23 March 2020. By the end of May 2020, this data set had grown to the size of 75,739,264 tweets. Faced with such a large data set, how should we practically go about identifying testing situations? Our large Twitter data set proved rather unwieldy, as it took us many hours to run a single query. This practical challenge of conducting interpretative social media research at scale found a corollary in an analytic challenge posed by our project, that of specifying the scale at which coronavirus testing situations unfold. On the one hand, the testing situations that were reported on Twitter, like the one in San Francisco’s Tenderloin, unfolded on the local scale. But testing situations equally arose on the national and indeed global scale. How then to identify testing situations from Twitter data across scales?
Interpretative Querying: Combining Situational Analysis With Digital Methods in Twitter Research
At the outset, we defined our task broadly: We would try to identify Twitter reports that situate the practice of (not) testing for coronavirus in terms of a where, what, and how. However, we soon realized we needed a narrower definition of a testing situation if our aim was to analyze the ways (not) testing for Covid does double duty as a social test. Building on the study by Hutter and Stark (2015), we define this loosely as a moment involving coronavirus testing in which existing capacities, relations, and arrangements in society are challenged and/or put at stake. Given the sociological nuance of this definition, it was clear to us that our study required an interpretative methodology. At the same time, the choice of data source—a voluminous Twitter data set—committed us to semi-automated methods of data collection and analysis. We therefore took up digital research methods and implemented these within the methodological framework of situational analysis (SA), an interpretative approach to data analysis developed by Adele Clarke and colleagues (Clarke, 2005; Clarke et al., 2016). In the following sections, we take some time to reflect on how we adapted this approach to surface testing situations from large Twitter data sets with semi-automated methods that we refer to as “situational analytics” (Marres, 2020).
A qualitative methodology, SA affirms rather than seeking to bracket the complex topology of situations in knowledge-intensive, ecologically challenged, post-colonial societies. It makes use of techniques of data mapping to surface heterogeneous entities from fieldwork data, to determine what is problematic, remains silent, and/or what can make a difference in a situation (Clarke, 2005, p. 87). SA is explicitly committed to analyzing situations across scales, with its stated aim “to specify which heterogeneous entities—of varying scale and type—compose the particular situation” (Clarke, 2005, p. 78). In our study, we used the SA method of creating compositional maps to conduct an interpretative analysis of Twitter data: data visualizations which display relevant heterogenous entities that have been surfaced from the data and compose the situation in question—non-humans, issues, organizations, actors, things, events, locations (Figure 2). We then interpreted these visualizations to determine which entities compose selected testing situations reported on Twitter and to surface what is at stake in them.
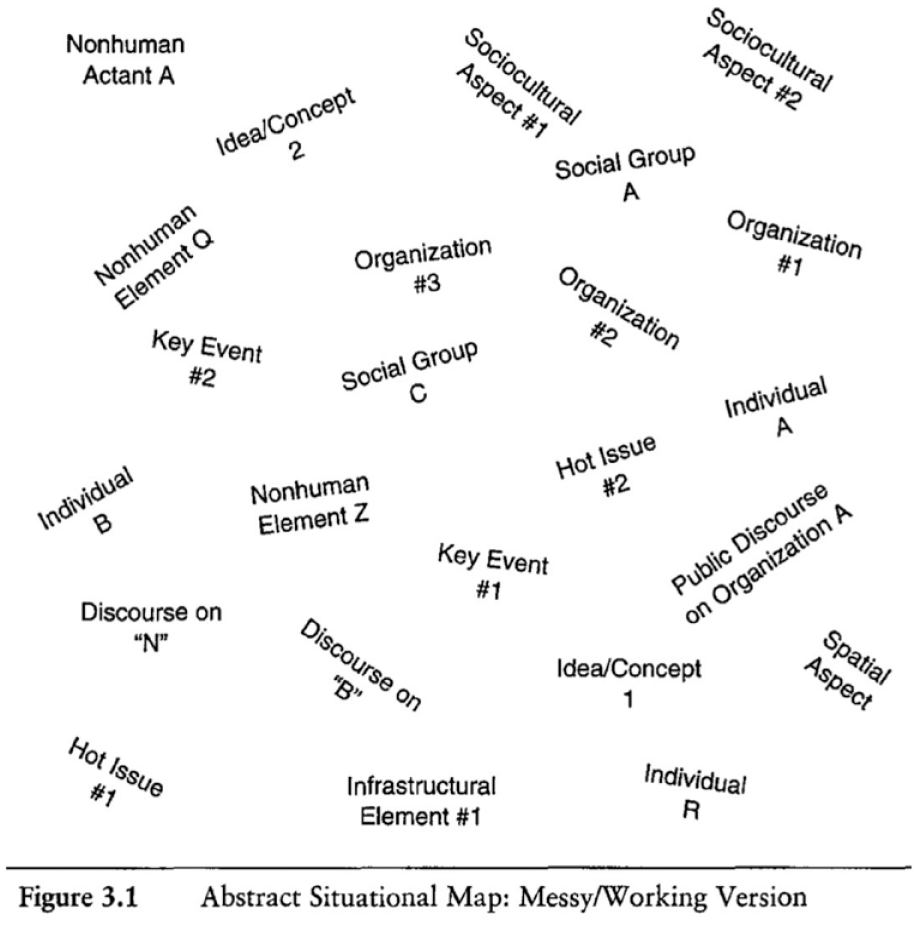
Clarke’s (2005) situational map.
In view of both the volume (scale) and nature of our Twitter data, the following two adaptations of the methodological frameworks of SA are required: First, the inductive approach to data mapping that is adopted in SA is not feasible for the interpretative analysis of large data sets (Nelson, 2020). 10 We addressed this by adopting an interpretative style of querying that we discuss in the following sections. Second, when conducting social research with digital platform data, the analysis needs to be continuously attentive to the “biases of the setting” (Marres, 2015): the fact that platforms like Twitter favor particular types of content (news), demographics, 11 and modes of circulation (Twitter trends) (Bucher, 2018; Rieder et al., 2018). In line with this expectation, the Twitter data set that we created for our study of corona testing situations, which we delineated using the search queries “coronavirus” and “testing,” evinced a clear leaning toward news, celebrities, and memes. SA was developed for the analysis of fieldwork data, and as such, it does assume that the researcher is attentive to biases of fieldwork settings, but in query-driven, automated data collection, as in the case of Twitter research, this sensibility needs to be extended to the logics of both online media platforms and the tools used to study these platforms. 12
Our research design addresses these two challenges in the following ways: First, as discussed in Marres (2020) and Dieter et al. (2019), the use of situational approaches to analyze large social media data sets involves a re-framing—or, more precisely, a re-location—of the “situation” as a unit of analysis. In our social media analysis, we locate “situations” on the level of the data set, as these kinds of data sets exceed our capacities for close reading, and we cannot rely on the interpretation of individual messages to define situations. We make it our objective to surface situations from the data not by reading but by querying our data. Through an iterative process that we call interpretative querying, we formulate and re-formulate query terms to delineate situational data sets from within our larger “coronavirus” Twitter data set, drawing on techniques of query design as developed in digital methods (Rogers, 2017). This approach involves the formulation of queries based on how specific words and phrases are actually used in online spaces, rather than, for example, deriving search terms from the research design to delineate data sets. However, in our approach, we continuously review and revise our queries in the light of our interpretative concern. (How are situations of [not] testing for Covid socially testing? What composes the situations of testing and not testing for Covid-19 in our data set?)
We call this approach to query design “interpretative querying” to foreground two aspects: (1) its iterative character, involving continuous specification and adjustment of the vocabularies of “Covid testing situations” to ensure they are adequate to both our research setting, Twitter, including its media biases, and our research question. Thus, our interpretative analysis attends to platform specificity (Gerlitz & Rieder, 2013) and to the ways in which Twitter dynamics may surface some situations rather than others, for instance, by favoring particular expressions that are suitable for fast dissemination (“positive result”) and through the circulation of distinctive types of images, such as celebrity portraits. However, as the object of our study is the situational articulation of coronavirus testing on Twitter, we equally seek to counter-act platform biases, for instance, through our focus on investigating testing locations, a dimension in our data which is not privileged by Twitter settings. 13 (2) In our interpretative process of data selection and analysis through querying, we continuously return to our overarching interpretative concern. We continuously move between looking at our Twitter data through a sociological lens and attending to medium specificity and between interpreting our queries and query returns on the level of the data set (frequency, relations) and reading a sample of individual tweets. In this regard, our approach is in some ways similar to the abductive approach to large-scale data analysis put forward by Brandt and Timmermans (2021), who argue that this type of data makes it possible to “leverage the large scale at which data have become available to locate surprising empirical findings” (p. 94).
We used interpretative querying to delineate our situational Twitter data sets (discussed below) as well as to structure our data analysis, which involved the construction of data set–specific vocabularies (lexica) to determine what constituted testing situations of Covid-19 on Twitter in the Spring of 2020. In both cases, we approached the detection of relevant heterogeneous entities—relevant to the composition of testing situations—as an iterative process, in which we progressively refine our queries in the light of our data (Munk & Ellern, 2015). Once we had identified a set of Covid testing situations by these means, we took up visual methods of composite image analysis (Niederer & Colombo, 2019) to deepen our grasp of the composition of testing situations on Twitter beyond the analysis of text. This brings us to a last methodological aspect of our interpretative Twitter data analysis: data visualization. Our study did not only use image analysis but also relied strongly on exploratory data visualization to identify and define testing situations during all stages of the analysis, as we developed our queries and lexica by reviewing frequency and network graphs for our Twitter data. In adopting such an interdisciplinary research approach that combines SA, digital methods, and visual methods, we once again find inspiration in abductive data analysis (Timmermans & Tavory, 2012), which affirms the potential of large-scale data as a “trading zone where researchers from entirely different paradigms, despite differences in language and culture, collaborate with each other to exchange tools, information, and knowledge.” (McFarland et al., 2016, p. 13, cited in Brandt & Timmermans, 2021, p. 196). We want to emphasize that it was the avowedly interpretive engagement with large data sets—a commitment to develop social understandings of what testing situations were articulated on Twitter, going beyond merely identifying patterns of communication or sentiment—which made it possible to productively combine methods developed across sociology, digital media studies, and design research.
Curating Data for (and Through) Interpretative Querying: Sub-Setting Twitter Data or “Data Teasing”
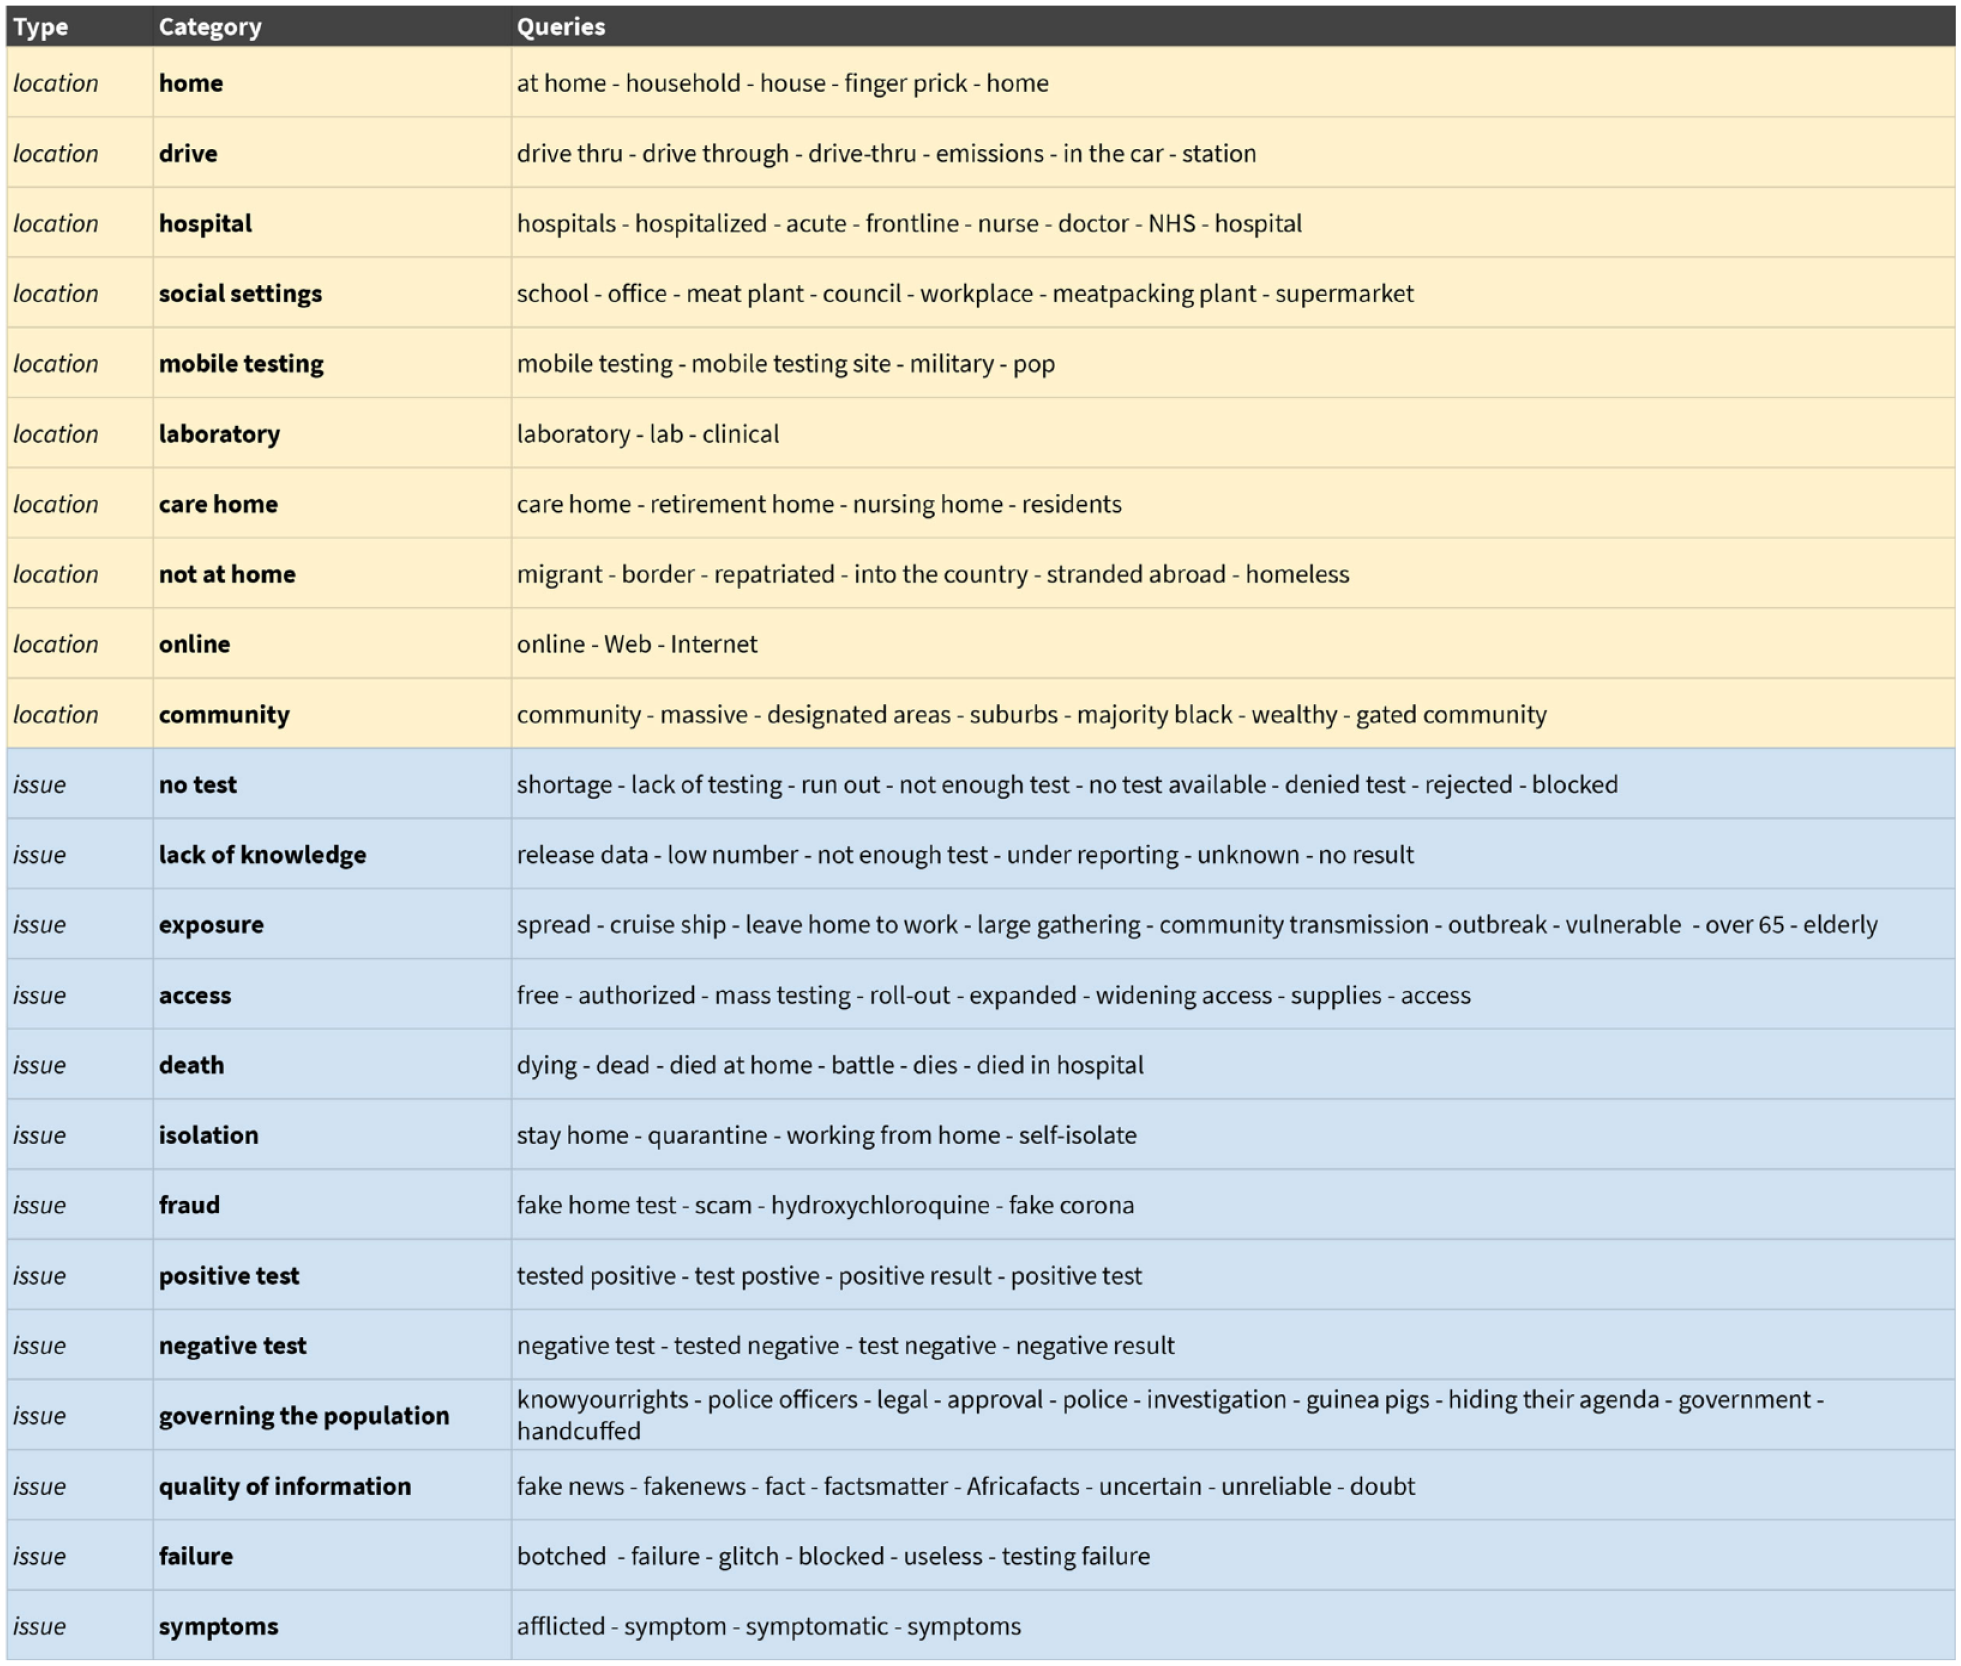
For this study, we drew on a data set of 75,739,264 tweets collected during the period 23 March–27 May 2020 using T-CAT, the Twitter Capture and Analysis Toolkit (Borra & Rieder, 2014), based on a single query “coronavirus” via the Twitter Streaming API. 14 The size of this data set made it too cumbersome and too resource-intensive to browse, analyze, and interpret our data by running queries within the infrastructure of TCAT. To reduce our data, we therefore queried the coronavirus data set for the words “test,” “tests,” “testing,” and “tested” during the interval of 23 March 2020 to 27 May 2020 (and echoing the call to arms of the WHO president). This resulted in a much smaller “coronavirus test*” subset, which consisted of 3,991,250 Tweets, which, however, we felt was still too big—and underdefined—to facilitate interpretative exploration of testing situations in the data. Our answer to this was to devise a technique we called “sub-setting,” a way of using what we call above “interpretative querying” to de-compose data and create smaller data subsets which are more suitable for the kind of iterative data exploration that enables interpretive inquiry. 15 To this end, we created three thematic subsets, each focused on a specific type of testing situations occasioned by (not) testing for Covid and offered a first theory-led demarcation of the data: (1) situations involving “relations” (such as mum, neighbor, the community), (2) those involving “locations” (home, parking lot, laboratory) of (not) testing for coronavirus, and (3) devices (“kit,” “lab”)—although we did not pursue this last query further, and therefore do not discuss it in this article (see Figure 3).

Overview of queries used to create the three subsets.
We conducted several online workshops to explore our subsets and undertook interpretative data analysis in small groups, the results of which are discussed in the following sections. 16 During the workshops, researchers from different backgrounds in digital media studies, sociology, science and technology studies, and design research worked together to continue the “interpretative querying” of our data. During these workshops, the question of what kind of data practices (Ruppert & Scheel, 2021) we were engaged with, and of what “environment of interpretation” we were curating—by configuring Twitter software, data, and query terms—was a live concern. Watching our colleagues and students at work during these workshops helped us realize how our practice of querying Twitter differs from the more common “summary techniques” used in social media analysis, which rely on formal analytical operations (e.g., counting, sorting, filtering, plotting, pivoting) to produce data summaries. In the case of Twitter data, these operations are likely to focus on producing overviews of the most shared posts or most frequently occurring links, hashtags, accounts, and URLs with the aim of identifying formal patterns. We too created some of these overviews, but our aim was to make visible a type of entity that would not readily emerge from the platform-formatted data: testing situations involving (not) testing for coronavirus. Interpretative querying, then, does not seek to “resolve something complex into simple elements,” but rather seeks “breaking up, loosening, releasing.” During our workshops, we playfully defined this interpretative data work as “data teasing,” in the sense of “to pluck, pull, tear; pull apart, comb,” 17 and drawing on Haraway’s notion of cat’s cradle as a way to “pass back and forth to each other the patterns-at-stake, sometimes conserving, sometimes proposing and inventing” (Haraway, 2016). Instead of following and counting platform-defined data points, “data teasing” asks us to engage with data and data structures in a more open-ended manner guided by our interpretative concerns.
Lexicon Analysis: What Composes Covid Testing Situations on Twitter?
What type of testing situations surface from Twitter reporting on coronavirus testing through the circulation of text and images? What can this tell us about the ways in which (not) testing for coronavirus did double duty as a social test in the first months of the pandemic? 18 These were the questions that guided our work of lexicon construction during our online collaborative workshops. The process involved three intermediate steps (see Figure 4). First, we defined types of categories relevant to the research question: To surface testing situations, we would connect relations with issues (say “state” with “not enough tests”) and locations with issues (say “supermarket” with “exposure”). Second, working in small groups, we populated these types of categories with potentially relevant categories for each of the two subsets (family, professions, the state; laboratory, home, community). In a third step, we searched a random sample of the relevant subset for words (query terms) that could serve as indicators for those categories in our data. 19 For each of the two subsets, “relations” and “locations,” each member of the sub-group performed a close reading of a random sample of tweets from that subset, looking for examples of “relations”/“locations” and “issues,” the two category types we had defined. In this way, we revised categories of relations/locations and issues based on what the data surfaced and created new ones, and candidate query terms were put forward for the lexicon analysis. For example, if a Tweet said “my grandmother is unwell but can’t get a test,” the query word would be “grandmother,” which belonged in the category “family.” The issue would be that she cannot get a test, which fit in the category “no test” and the query phrase “can’t get a test.” In group discussions, we reviewed categories and queries which were problematic in some way, such as being underdefined or uncertain.

Procedure for situational data set curation and lexicon analysis.
The lexica presented in Figures 5 and 6 provide an initial overview of the type of entities that populate our thematic subsets, “corona testing relations” and “corona testing locations,” but they do not yet tell us anything about the frequency of their occurrence or the interrelations between these entities. To find this out, we used the Lexicon-based Categorization and Analysis Tool 20 (Le-CAT), a tool developed by James Tripp, to query the subsets. Le-CAT allows you to apply word queries associated with a category (a lexicon) to a data set. It determines the frequency of occurrence for each query and category in the corpus, as well as the relations between them. The purpose of this technique is to scale up and semi-automate interpretative querying, as it allows the application of a custom-built Lexicon to large data sets. We also used Le-CAT to review our lexicon in the making, refine our queries, and discuss what was missing. For example, in the relations data set, some in our group, which included researchers of gender-based violence, had expected to find situations relating to violence in the home or in intimate relations (Onyango & Regan, 2020), but we did not find many references to this in our data. This serves as a reminder that our lexicon analysis does not in any way present an exhaustive overview of the testing situations of Covid-19 and is informed by framings introduced by our researchers.

Lexicon for “coronavirus testing relations.”
Lexicon for “coronavirus testing locations.”
A diagnostic overview provided by Le-CAT showed frequency of occurrence for each of the query terms in our lexicon, which allowed us to revise our initial ideas about coronavirus testing “beyond the laboratory.” We had expected many references to testing “at home,” in “parking lots,” and so on. However, the examination of our data showed that an institutional location was mentioned more often than the home, notwithstanding the government injunction to “stay at home,” which also featured prominently in our data: the care home. We, therefore, created a separate location category for the latter. We also added the category “not at home” to capture references to homelessness and the role of borders and citizenship in the implementation—and thematization—of coronavirus testing. Finally, while much of our interpretative discussions focused on government accountability, its prominence was relatively low in the data. We thus revised our lexicon based on the frequency of occurrence of our query terms in each of the two data sets.
Having refined the categories and queries composing the two lexicons based on our review of the diagnostic files and close reading of tweets, we examined the connections between locations and issues and relations and issues, respectively. We analyzed co-occurrences between categories for each of the two subsets and in the corona testing data set as a whole by exploring alluvial visualizations (Figures 7 and 8). 21 Given that several of the terms in our lexica served as query terms to create the thematic subsets, we concentrated on the latter. Notable for us at the time (June 2020) was the prominence of institutional and organizational locations as locations of testing and not testing for Covid: care homes and hospitals. We were surprised to find this given the public discourse in the United Kingdom, which has led us to expect that locations of improvised and/or “self-testing” in society would have a strong presence in our data, such as the parking lots where pop-up testing centers appeared, and testing at home or online, which were prioritized in media reporting on coronavirus testing, and a notable feature of everyday living with Covid at the time. Such locations did feature but were less prominent in our data than the institutional locations of the hospital and the care home. For “coronavirus testing relations,” the strong presence of state, organizational, and collective actors stands out, with the category of professions and state featuring far more prominently than that of family and intimate relations in connection with challenges and predicaments thrown up by coronavirus testing (test results, exposure, death). 22 We were struck by this result too, in view of the framing of Covid in UK government discourse as a challenge to be addressed through direct-to-consumer testing. At the time, governments across the world framed adherence to Covid policies, including testing as a “collective responsibility,” but as Andreouli and Brice (2022) note, in the United Kingdom, the government’s discourse on Covid sought to “solidify a citizenship model of personal responsibility and self-management” framing “ individual action . . . [as] . . . the ‘only way’ to control the virus.” (p. 562; see also Reicher, 2021 23 ). By contrast, English-language Twitter reporting on testing foregrounded how situations of testing and not testing for coronavirus challenged collective relations.

Alluvial diagram showing the co-occurrence of relations and issues in the coronavirus testing subset (w/o ReTweets). Bar height indicates frequency of co-occurrence.

Alluvial diagram showing the co-occurrence of locations and issues in the coronavirus testing subset (w/o ReTweets). Bar height indicates frequency of co-occurrence.
Regarding the issues featured in the “locations” lexicon, the prominence of “positive test” stands out as the issue most frequently associated with all main locations. Issues of access and availability of testing are prominent in relation to the question of where to test, as does the question of how to test (forms of testing), via a doctor’s appointment, online, or “in the community” In contrast, for the relations queries, the main issues associated with the different actor categories in our Twitter data are, alongside test results, death and exposure, both issues pertaining directly to illness and health. Death and exposure are more strongly associated with society/professions, than with the state. This difference is less notable in the case of test results, possibly as a consequence of the strong emphasis on test results in official government briefings and reports. Both the locations and the relations queries made it clear that the “realities” of illness, health, and death featured much more prominently than epistemic issues pertaining to the quality of information, uncertainty, and information fraud in reporting on coronavirus testing on Twitter during this early period. Lack of testing was not brought up very often on Twitter either. We wondered whether this was an artifact of our lexicon, or of Twitter data, as we were aware from media reporting at the time that several of the locations in our lexicon—such as care home and hospital—were marked by the absence of testing: The most testing locations, societally speaking, are not the locations of testing; or rather, the most testing locations are the locations of not testing. 24 Social issues, such as care and support, also feature less prominently than expected.
In this way, lexicon analysis enabled us to gauge the salience of different types of entities and relations in the composition of coronavirus testing situations. However, it is also clear that our implementation of lexicon analysis is a relatively coarse technique: This form of analysis was helpful as an exploratory first step, providing a way to surface features and possible groupings and categories of entities mentioned in our data sets, but the approach is less suitable for identifying more subtle and implicit dimensions of testing situations, which may involve irony, sarcasm, or implication, modes of articulation for which it is difficult, if not impossible, to identify query terms. To address this, we took up tools of image analysis (for a discussion see Gray et al., 2016).
From Composite to Situational Image Analysis
We turned to image analysis to help us further specify the testing situations that we had identified using lexicon analysis: “coronavirus testing relations” and “coronavirus testing locations.” We devised a research protocol drawing from visual media analysis (Aiello & Parry, 2020; G. Rose, 2016) to implement situational mapping in the analysis of social media images. We relied on the thematic couplings identified through co-occurrence analysis to further subset our data: For a selected set of such situational coupling, we curated a subset of Twitter images present in the relevant subset of tweets (Figure 9). 25
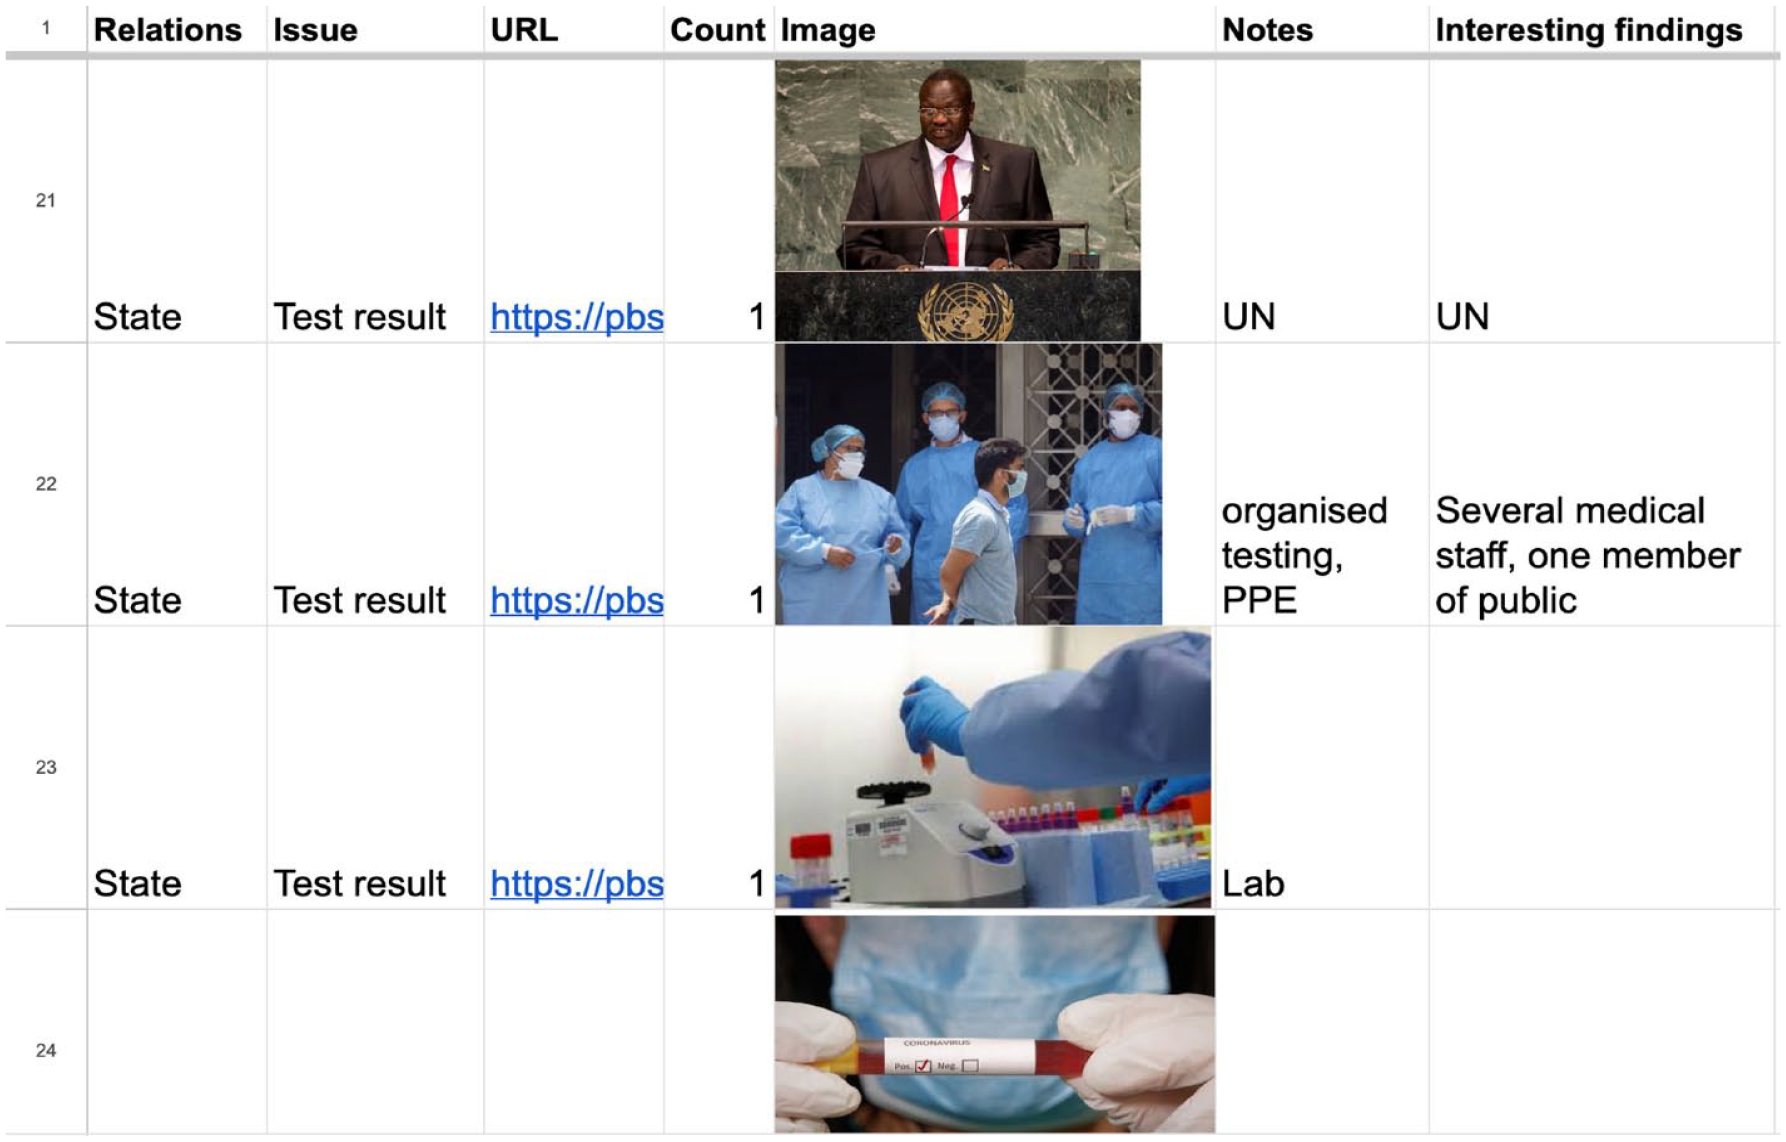
Grid of images for the situational coupling “State—Test result.”
Our subsequent image analysis draws on approaches for analyzing “networked images” developed by Niederer and Colombo (2019), whose study attends to how online images are “networked” through collective practices of linking, sharing, commenting, or tagging, as well as through the formatting, filtering, and recommendation systems inscribed into platforms. “Contextual elements” (tags, texts, comments, timestamps) can then be used to document the social lives of images online. Building on this, we created composite image collections for each of the situational couplings identified through the lexicon analysis. We explored and interpreted the images in these collections in the light of the couplings with which they are associated. What do the images say about the relationship between care homes and testing? Analyzing images on the level of the data subset means approaching them as thematic collections (composites) and shifting our focus from individual images to groups of images as the unit of analysis (Colombo, 2019), as well as affirming that digital visual practices, from image circulation to memetic cultures, can only be accounted for by analyzing collections of images (see Figure 10 for diagrammatic representation of our protocol for situational image analysis).

Protocol for situational image analysis.
To interpret our composite image sets, we adapted the visual research technique at the core of SA, already discussed earlier: compositional mapping (Clarke et al., 2016). Indeed, Clarke has drawn attention to the particular relevance of visual materials in the composition of a situation, and she recognizes the relevance of visual analysis to understanding “how visuality is constitutive of those situations” (Clarke et al., 2016, p. 205). In our composite image analysis, we approach images not so much as elements composing situations, but rather as empirical heuristics: By analyzing images as composites, on the level of the thematic data-subset, the interpretation of an image-compo-set can help to specify that subset’s theme. While computational techniques are increasingly used by researchers to label (single) images automatically, we devised a protocol of interpretative image analysis to facilitate a collective process of interpretation (through group work), which, we feel, is critical to eliciting the aboutness of a given situation, to determine what is at stake, through the interpretative specification of composite elements (as well as of what is missing).
There are a few other differences between our visual SA and that proposed by Clarke et al. (2016). Most importantly, given the large volume of images in our data sets (which, for some couplings, can be over 1,000), we use image grids as a format to facilitate collective interpretation. Images are displayed for each coupling on a grid and ranked according to the frequency of their occurrence in our data set. We then invited our co-inquirers to populate these grids according to a basic interpretative protocol, focusing on the identification of image type, what is missing, 26 and exemplars (which images exemplify the coupling best in your view?). 27 Finally, in the presentation of our findings, we compose the image corpus for selected couplings into a composite image, which collates all images from each coupling, loosely grouped by themes, into an ordered display. This means, that, in contrast to traditional situational maps, which are made of textual and graphical elements created by the analyst, we retain our source images in the final output. Our composite images can therefore be said to operationalize the indexical methodology of “visualization without reduction” (Manovich, 2011), a form of data visualization applied to visual materials where one does not translate images into graphical marks but retains them in the final output. 28 In our study, we assembled composite images based on relational features, that is, the terms with which they were coupled by Twitter users. That is, in our case, analyzing composite images involves both the identification of relations in data and their qualification through visual interpretation, going beyond their mere juxtaposition and following the interpretative aim identified in Clarke et al.’s (2016) methodology, which is to “provoke the researcher to analyse more deeply” (p. 23).
Situational Image Analysis: What Composes Covid Testing Situations on Twitter (2)?
We started by exploring the image grids with the aim of defining our “axes of interpretation” for composite image analysis. To this end, interpreters selected exemplary images from the image grids for a selected set of “relation–issue” couplings for collective interpretation. Next, we created a matrix representing selected thematic couplings using the visual collaboration platform Miro, where interpreters added and annotated their selected images in the relevant locations in this matrix. 29 At this stage, researchers were instructed not to refer to these images’ accompanying tweet texts unless it was impossible to make sense of an image or pattern of images without doing so. This initial collaborative exploration of the image clusters enabled us to formulate three axes of interpretation to support a more structured analysis of the image collections. These three axes were: (1) How abundant or scarce are the images in this coupling? (i.e., is there a visual vocabulary for this situation on Twitter?); (2) How does this image specify the coupling?; (3) Which visuals are missing from this coupling? (e.g., pictures of home interiors in the “issue–home” coupling).
This initial exploration allowed us to further specify the entities and events composing our testing situations. For example, the “care home–exposure” coupling included an image of a full House of Commons listening to Matt Hancock, the Health Secretary, giving a statement about the unfolding scandal of the increase in care home deaths during March–May 2020, as older patients were released from hospitals into care homes without testing. 30 At this stage, our image analysis also surfaced the laboratory as a prominent location of testing, with laboratory imagery featuring prominently, even as other testing locations did feature testing sites “beyond the laboratory,” including drive-ins, parking lots, supermarkets, and shopping malls. Third, the images in the coupling “society/profession–test results” showed defining professions that have been put to the test by the Covid crisis. These included Covid health care personnel, public sector workers on Covid-related duties that differ from their usual vocation, public state officials, and Covid-regulation enforcers. Finally, even if death emerged as a prominent issue in relation to multiple locations, including the laboratory, the care home, and communities, it is missing from the picture strictly speaking. The scenes depicted in images are often those of building facades (e.g., of care homes or laboratories) as seen from the outside. These are the spaces where presumably death occurs—or is being spoken about—yet the viewer remains unable to see what is “inside.” This suggests that the situational specificity of “death” in tweets about coronavirus and testing remains “behind closed doors.” We also noticed testing materials and objects often found in laboratories (e.g., test kits, test tubes, etc.) to be present in other spaces, such as the care home.
Based on this initial exploration, we created a more formal code book for image thematic coding. We worked with groups of interpreters to code images from selected issue couplings during a 2-day intensive workshop. 31 These codes covered both image content and genre (e.g., prison, in-memoriam portrait, infographic, etc.). We coded all images for nine thematic couplings in the relations subset, namely those at the intersections of “state,” “intimate relation,” “family,” “exposure,” “death,” and “positive result.” These were selected in view of their relative prominence in the relations subset, as well as the relatively strong contrasts between the categories involved, which we expected would make them easier to compare. Based on this thematic coding, we then clustered the images into image composites, where similarly coded images are placed in proximity to each other in the visual space. Finally, to perform the analysis of each coupling’s image composite, we arranged all composite images in a matrix that maps onto the selected thematic couplings (see Figure 11). In the following section, we discuss our main observations of the composite image matrix.

Matrix of composite images for selected situational couplings.
The first thing that stands out for all couplings involving relations is the prominence of portraits. One could say that the portrait represents Twitter’s diverse actor composition, combining personal and professional registers: politicians, celebrities, workers, friends, and family (although scientists are notably missing). However, Covid also inflects how portraits figure in our data: portraits of public sector workers in their uniforms, including of military, police, medical, and prison workers, as well as photos of individuals wearing masks, and portraits which on closer scrutiny prove to be screenshots of video conference calls. These types of portraits are present to different degrees across the couplings, with individual and couple portraits especially prominent in the “intimate relations” couplings. There are also some notable differences: While celebrity portraits dominate the “positive result”–“intimate relation” situation, the portraits associated with “death” are often used to commemorate ordinary individuals or (members of) couples who have lost their lives due to coronavirus, pointing toward the uneven distribution of mortality risk across societal sites and groups. The in-memoriam portraits include key workers who lost their lives in high-risk environments, wearing professional uniforms. In the coupling with “state,” the portrait is joined by other figures. Here, official tables, dashboards, and graphs showing population-level statistics are a notable presence, which is the case for all couplings involving the state. Equally featuring across all couplings, but especially in relation to the state, are generic images depicting the virus, news alerts and news headlines, and generic images focusing on the techno-materiality of testing (test kits, test tubes).
In the couplings involving “positive result” and “death,” we also find the portraits and infographics discussed earlier. The “death–family” coupling also shows ceremonies of mourning, funerals, praying, and churches, surfacing appeals to a community of care. Images of funerals, notably absent in “state” and “intimate relation” couplings, display adjusted modes of sociality: standing apart together, often in personal protection equipment (PPE), to mourn the loss of human lives. The “death–state” coupling features not only numbers and statistics but also tributes to ordinary individuals who lost their lives in key public sector worker roles. The “intimate relation”–“death” equally features the in-memoriam portrait as a means to publicly mourn individuals who lost their lives due to coronavirus. The category “positive result” in all its couplings also contains images of coronavirus testing situations, especially in its coupling with the state: images of health workers in PPE, drive-in testing, hospitals, testing outdoors, and in pop-up setups such as tents, as well as images of testing kits and temperature checks in the streets, in airports, and supermarkets. In the coupling “family–positive result,” we also found gestures of care and caring such as adjusting a mask, holding a baby, chatting to an elderly person, embracing, and kissing.
Unsurprisingly, couplings involving the state present more collectivizing visuals, such as population statistics, while intimate relations feature individuals or small groups. Striking are the media genres and modalities by means of which these collectivizing and individuating effects are achieved and which our visual analysis surfaces: graphs, tables, maps, and news when it comes to the state, and screenshots of video calls and in-memoriam portraits when it comes to intimate relations. There are also related differences in terms of the volume of visuals associated with the different categories. The situation “death”–“intimate relation” is specified through images to a much lesser extent than “state”–“death.” There are fewer and more similar images in the former category. In this coupling, just as in “family”–“death,” portraits dominate. In the coupling of “death” and “positive result” with all relations categories, we find street demonstrations to protest the fate of loved ones. Striking is an image of protesting in front of a correctional facility to denunciate the risk conditions in these sites by means of a portrait of a loved one who lost their life in this environment.
When it comes to the sites featuring in visuals across our three “relations” couplings, institutional and public locations are present, including prisons, care homes, hospitals, laboratories, schools, meeting rooms, street with people, public gatherings, and airports and clinics with queues. The situations of “exposure” are more prominently specified in terms of locations than those associated with “positive result” and “death.” Particularly notable here are images of streets and airports, as well as prisons and correctional facilities. In relation to exposure, we also find laboratory activities featured, from sample collection to sample handling in lab settings and test results. Whereas the medical laboratory is seen mostly from the inside, for prisons, the view from outside tends to dominate. As with the pictures of care homes seen from the outside, these images of buildings often keep the viewer outside of these sites of high exposure and vulnerability and limited power and agency. In the case of prisons, these sites are presented from the outside and separated by defensive structures, such as barbed-wire fences, reinforcing the image of containment, a source of clear danger in the context of Covid. The exception is the coupling “intimate relations–exposure,” where the prison is, on the contrary, seen not from the outside but through close up images of inmates inside. Finally, notable in their absence are images of domestic settings and everyday living with testing and test results, which may reflect the medium (Twitter is more publicly oriented than other social media platforms).
Conclusion
Reflecting on our image analysis in the light of our research question—what makes situations of testing and not testing for Covid-19 socially testing?—what has stayed with us most is that the situations of coronavirus testing are not the most testing situations. This is the case in the general sense that testing for Covid provides a mechanism to protect individuals and groups from being tested by Covid, while not testing for Covid make it more likely that people are exposed to the disease.
Our analysis located this general insight by showing that the notable locations of (not) testing for Covid, locations like care homes, hospitals, and prisons, were marked by exposure and death. Perhaps something similar can be said of relations: The relations that mediate coronavirus testing such as those with health professionals administering and analyzing tests and with celebrities (“positive result”) are not the relations most tested by coronavirus, which are no doubt the relations with key workers and with loved ones lost to Covid-19. In this regard, we also note a stark contrast between the practice and the object of our social media analysis: The slow interpretative process of creating, refining, and exploring data sets stands in contrast to the testing situations, the sense of emergency, predicament, and the loss, that we encountered in our data. Yet the situations that we surfaced from Twitter reports and images also gave a “face” to the first months of the Covid pandemic.
We found not only locations of too little testing (care homes) but also locations with lots of testing positive (hospitals and correctional facilities). We found image composites highlighting national trends (e.g., “positive result” with “state”) and some displaying portraits of people who were not public figures (e.g., “positive result” with “intimate relation” or “family”). Alongside stock and generic imagery of lab and medical situations (particularly as media access to hospitals was limited in the early phases of the pandemic), we found images of particular protests, scenes of intimate care, and moments of coronavirus testing in the streets, parking lots, and airports. We found that some testing-related issues (e.g., lack of tests) were more prominent than others (e.g., concerns around fraud in reporting tests). We noticed that some types of images were also more visible than others—such as facilities being depicted from the outside rather than from within. In addition to images of testing devices (e.g., unboxing test kits), we could see the arrangements which made testing work, including workers, infrastructure, and the spaces which were adapted into testing facilities. Through accounts like these, as well as through the circulation of specific visual forms, like in-memoriam portraits and data dashboards, we found that media formats with currency on Twitter equally participated in the articulation of testing situations in this setting.
Our analysis surfaces tropes that tell us as much about Twitter as about the unfolding Covid-19 pandemic. Much of what we found replicated mainstream reporting narratives, focusing on actors rather than practices, with politicians and people of public interest featuring much more prominently than personal accounts from ordinary people, in line with Twitter’s profile as a platform for engagement with news (Burgess & Baym, 2020). Reporting often focuses on test results of individuals, groups, and regions, as well as institutional efforts to implement protective measures, rather than on situations of testing and not testing for coronavirus. Dominant voices here include politicians, celebrities, and media organizations, with the voices of experts, scientists, and local and everyday perspectives notably being less conspicuous. Using digital methods to scale up SA to the level of the whole data set, we must thus contend with discourses that risk to dis-articulate the situational ontology of, in this case, (not) testing for coronavirus, in a social media environment like Twitter. However, through our iterative process of interpretative querying, we were nevertheless able to tease out a plurality of other actors, entities, sites, issues, and relations involved in the articulation of coronavirus testing situations on Twitter.
Through our iterative work of interpretative querying, we re-composed online materials to surface the ways in which coronavirus testing situations challenged and thereby articulated relations at different scales during the first months of the pandemic—from the mediated closeness of video calls to full-body suits in hospitals, portraits of lost loved ones, pop-up testing sites, and screenshots of news graphics of cases and deaths. While many of these types of visuals may be mundane when considered individually, taken together, they enable differentiated considerations of how Covid testing tested collective relations. Importantly, the articulation of coronavirus testing situations on Twitter offers a refutation of the idea that the unfolding Covid-19 pandemic was governed through “testing beyond the laboratory.” In Spring 2020, we started out from the suggestion that self-testing would form the core element of coronavirus testing, with free testing services provided by the state in the community—in shopping malls and parking lots—and that commercial direct-to-consumer testing services would enable citizens to take charge of their own health. What we found instead was that institutional locations, like the hospital, the care home, and the laboratory, played a key role as sites of (not) testing for coronavirus. This finding aligns with the claim put forward by the sociologist Sylvia Walby (2021), who argues that Covid-19 re-topicalized the opposition between neo-liberalism and social democracy.
Unexpectedly, we found that (not) testing for coronavirus problematized collective relations, between citizens and the state and between different professional and social groupings. In this regard, our SA surfaces the ways in which testing—and not testing—for coronavirus gave rise to testing situations across scales, not just in the sense of reporting local, national, and global situations but also in the sense of thematizing relations between individual situations, socio-economic groupings, and the (ir)reponsibility of the state. In the data we interpreted, testing for coronavirus threw into relief the unequal distribution of harms, risks, and benefits between differentially positioned social groupings: those in critical public sector roles, single households, carers, medical professionals, politicians, and so on (Keck et al., 2019). Public health experts (Chung et al., 2021) have shown how arrangements for coronavirus testing played a role in the distribution of risk and harm across society: In the United Kingdom, where testing capacity was low especially at the onset of the pandemic and the government did not initially provide economic support for self-isolation, the capacity to take responsibility was distributed highly asymmetrically across society—with the precariously employed carrying particularly heavy burdens for “taking responsibility through testing” as self-isolation meant loss of income, with testing arrangements thus generating forms of irresponsibility in one and the same go. This critique did not feature prominently in our Twitter data, but what did feature on Twitter were the politicians that presided over this situation; the portraits of the key workers and loved ones lost to Covid; and the care homes, prisons, hospitals, and transport systems where they were exposed to the virus, not tested for coronavirus, and not protected.
Footnotes
Acknowledgements
We want to acknowledge the important contributions to this study by the participants in the following workshops: the virtual workshop on “COVID-19 testing on Twitter: Surfacing testing situations beyond the laboratory,” co-organized by the Centre for Interdisciplinary Methodologies (University of Warwick), the Department of Digital Humanities (King’s College London), and the Public Data Lab (22–23 June 2020); the online workshop at the Digital Methods Initiative Summer School, University of Amsterdam (July 2020); and the hybrid workshop “Test Society/Covid-19” hosted by Media of Cooperation, University of Siegen (December 2021). We owe some of our insights in and formulations of Covid testing situations to Helena Suarez Val who also improved the Le-CAT software, as well as our understanding of it. For the purpose of open access, the authors have applied a Creative Commons Attribution (CC-BY) license to any author accepted manuscript version arising from this submission.
Declaration of Conflicting Interests
The author(s) declared no potential conflicts of interest with respect to the research, authorship, and/or publication of this article.
Funding
The author(s) disclosed receipt of the following financial support for the research, authorship, and/or publication of this article: This work has been funded by the Univerisity of Warwick’s Global Research Priorities Fund as well as by the Deutsche Forschungsgemeinschaft (DFG, German Research Foundation)—Project-ID 262513311—SFB 1187.