
Abstract
Extreme weather-related events like wildfires have been increasing in frequency and severity due to climate change. Public online conversations that reflect on these events as climate emergencies can create awareness and build support for climate action but are also used to spread misinformation and climate change denial. To what extent automated social media accounts—“social bots”—amplify different perspectives of such events and influence climate change discourses, remains unknown, however. We use Twitter and the 2019/2020 Australia bushfires as a case study to explore this issue. Utilizing more than 1 million Tweets, we identify how climate change is framed in the context of those fires, and to what extent social bots affect specific climate change frames, including the spread of misinformation. Our results show that climate change represents a substantial part of online conversations about fires. The bushfires are primarily framed as a climate change issue including its measurable impacts and political perspectives. Climate denial represents a small share of this conversation and receives limited amplification. Social bots seemingly contribute to the climate change conversation, both through frames that support and oppose climate action, and amplify to larger degree frames appealing to emotions, such as sympathy or humor. We also find that Twitter discussions about the role of social bots in spreading climate denial are amplified more than actual climate-critical frames propagated by bots. A complex interplay between social bots, Twitter conversations, and online news media is emerging, which shapes discussions about climate change and wildfires.
Introduction
The latest Intergovernmental Panel on Climate Change (IPCC, 2021) report reiterates the “unequivocal” human influence on the warming of the atmosphere, ocean and land, and highlights the strengthened evidence in changes of extreme events like heatwaves, heavy precipitation, droughts, and tropical cyclones. The occurrence of extreme events such as floods (Demski et al., 2017), wildfires (Craig et al., 2020), or storms (Rudman et al., 2013) triggers public debate and engagement with the reality and impacts of anthropogenic climate change (Boudet et al., 2019).
Recent research indicates that experiencing extreme weather events can potentially influence public support for climate mitigation measures and policies (Hoffmann et al., 2022), although this may partly depend on prior attitudes toward the topic of climate change (Sambrook et al., 2021) and the effect is likely not immediate (Carlton et al., 2016). Online social media play an increasingly important role in those public conversations on climate change (Pearce et al., 2019) and have become a dominant information source for the wider public (Anderson & Auxier, 2021).
Consequently, the role of social media communications on climate change has received broad research attention (see for example (Pearce et al., 2014, 2019; Williams et al., 2015). Online climate change discourses encompass all major digital media (Pearce et al., 2019; Tandoc & Eng, 2017) and show distinctive geographical and political divisions (Jang & Hart, 2015). Social media can equally serve to educate, mobilize, and build public support for climate policies (Tandoc & Eng, 2017) but also distribute misinformation, skepticism, and at times even outright climate change denial (Dahal et al., 2019; Jang & Hart, 2015; Treen et al., 2020). The active propagation of these opposing positions can result in polarized online conversations on the subject of climate change (Kubin & von Sikorski, 2021), a general phenomenon that is documented for a broad range of domains and subjects, including issues such as elections (Bail et al., 2018), vaccinations (Mønsted & Lehmann, 2022), food (Garcia et al., 2019), or most recently the Covid-19 pandemic (Cinelli et al., 2020).
Such polarized conversations can emerge quickly around discrete events, often tapping into existing social networks of issue advocates which mobilize almost instantly (Garcia et al., 2019). To what extent such mobilization and thus debate is amplified by automated social media accounts (so-called “social bots” (Ferrara et al., 2016)) has become the intense focus of social and political science research, and not least since the 2016 U.S. presidential election the use of social bots to amplify the diffusion of low-credibility content and misinformation has been documented (Bessi & Ferrara, 2016; Linvill & Warren, 2020; Shao et al., 2018). These developments raise important questions about the responsibility of social media platforms, suitable research strategies, available countermeasures, and the potential need for regulating social media platforms (Bail, 2022; Starbird, 2019).
Social Bots
All major social media platforms provide technical architectures (Application Programming Interfaces (APIs)) that enable the automation of social interactions and content generation, thus allowing for the creation and parallel deployment of large numbers of automated social media accounts that can build social communication networks and create content. Automated accounts utilizing these APIs may be used for beneficial or malicious purposes ranging from news aggregation, user assistance or entertainment to spam and sophisticated influence campaigns (Stieglitz et al., 2017).
The tools to create and run automated social media accounts are also freely and openly available for all major social media platforms (Assenmacher, Adam et al., 2020) although with a particularly large concentration on “Twitter bots” (Kollanyi, 2016). Such tools require limited technical experience and equipment to be run at scale. While Assenmacher, Clever et al. (2020) in a recent mapping of open code repositories argue that the sophistication of open bot tools does not merit the term “intelligent automation,” the advances and availability in open-source machine learning tools suggest that such tools may be increasingly utilized for social bot automation as well. More sophisticated tools are likely already available but may either not be required to achieve the desired automation objectives or are not publicly shared by their creators (e.g., “secret services”) (Assenmacher, Clever et al., 2020).
A growing body of evidence indicates that automation has become a mainstream feature of the social media ecosystem. (Bessi & Ferrara, 2016) for example, analyze 20 million Twitter messages around the 2016 US presidential election and conclude that approximately 15% of accounts were likely bots generating nearly a fifth of all Tweets. (F. B. Keller et al., 2020) describe an elaborate “astroturf” campaign during the 2012 presidential election in South Korea where human operators (“trolls”) utilized social bots to spread political content and (Bastos & Mercea, 2017) describe a “botnet” (a coordinated network of bots) contributing to the creation of hyper-partisan information during the UK Brexit referendum.
In contrast to the potential influence of social bots on public opinion and elections, the role of social bots in debates around climate change, in general, has only recently received scholarly attention (Chen et al., 2021; Marlow et al., 2021). While the alleged influence of social bots on climate change receives media attention in the wake of political influence campaigns (e.g., “Bots and Trolls Spread False Arson Claims in Australian Fires ‘disinformation Campaign,’” 2020), actual empirical research on the issue is scarce and typically concentrate on specific questions such as polarization (Weber et al., 2020). The potential impact of social bots on the framing of environmental emergencies such as fires and floods, and their consequential possible influence on long-term perceptions of climate change, thus remains unknown. Considering the volume, speed, and sophistication with which social bots could potentially contribute to public conversations on climate change or environmental topics in general, this perspective deserves a more detailed analysis.
Social Bots and Extreme Events
Extreme events like wildfires are of particular interest. They capture public attention, trigger demand for crisis information and public conversations are part of the “sense-making” process (Fischer-Preßler et al., 2019). Social media communications during such crises have both short-term and long-term impacts on the public reaction and perception of these environmental emergencies; short-term through real-time information shared via platforms such as Twitter that may assist or hinder (Muhammed & Mathew, 2022; Reuter & Kaufhold, 2018; Vieweg et al., 2010) immediate emergency responses; and long-term through discussions that overlay the occurrence of an extreme event like wildfires with the topic of climate change and connected policies. The two dimensions may build and reinforce each other and such communications may fall on fertile ground that matches existing beliefs and ideologies (Hultman et al., 2019).
The actual impact of social media and social bots on the public discourse and public perceptions is contested. Bessi & Ferrara (2016) describe a distortion of the online discussion of the 2016 US election, for example, but Bail et al. (2020) could not identify an effect of social media manipulation attempts on voting behavior. Broniatowski et al. (2018) argue that bots’ and trolls’ contribution to vaccine debates may erode public consensus, while a review by Ortiz et al. (2019) finds that social media in general can create vaccine awareness but not uptake. Puri et al. (2020) suggest that ideological aggregation may actually be attributed to the “self-selection” of social media users.
Social Bots and Framing Theory
The mapping of online to offline personas (Bail et al., 2020) is a major challenge in determining the actual impact of social media and social bots on perceptions of issues such as climate change. This challenge can be addressed by studies connecting for example interviews and surveys with digital profiles of respondents (e.g., Bail, 2021), or potentially through theoretical approaches (e.g., Ross et al., 2019) that explore the likely influence of automated accounts independent of a specific domain and content examples. Framing theory (Chong & Druckman, 2007)—which conceptualizes how communication processes shape an individual’s thinking around an issue—may offer such a theoretical lens that can help to describe the role of social bots in the public discourse on environmental emergencies and climate change and in turn point at approaches to determine their impact.
Not least due to their limited content—Twitter, for example, allows a maximum of 256 characters per Tweet—social media posts on climate change will typically have to rely on a particular framing of climate change, that is, emphasizing a specific perspective of the issue, likely to support an argument for or against climate change mitigation.
According to framing theory, a particular issue (e.g., “addressing climate change”) is framed in terms of a dominant perspective (e.g., “moral prerogatives” or “damages and cost”) and with an intent to secure support for or against the framed issues (i.e., “acting or not acting on climate change”). Framing theory further posits that two primary mechanisms determine the impact and success of a framing: (1) how often the receiver of a framed message is repeatedly exposed to the same frame (and intent) and (2) how often the receiver of a framed message is exposed to frames that conflict with previously held views (Chong & Druckman, 2007). The first would help the success of a communicated frame, and the second would likely reinforce existing views and create opposition to a communicated frame and intent.
Both mechanisms map to key properties of social media platforms and can be exploited particularly well by automated accounts—creating messages at volume and building social networks. Thus, automated accounts reiterating messages may help to reinforce a new framing (and build for example support for climate action), while the easy distribution into networks with diverse views may repeatedly create framing conflicts and reinforce existing views.
In this contribution, we thus want to explore how the public perception of climate change, as expressed in social media, is shaped in relation to an extreme wildfire event and what potential role and impact social bots have in amplifying specific climate change frames. We build on existing research exploring the framing of climate change in Twitter messages during extreme weather events (Roxburgh et al., 2019) and extend this approach to explore the prevalence and role of social bots.
Research Questions
We use the example of the 2019/2020 bushfires in Australia which were unprecedented in scale and duration (Davey & Sarre, 2020), received worldwide attention, created intense media coverage, and generated controversies around the connection between climate change, the extreme heatwave, and the fires (Mocatta & Hawley, 2020). In a related pilot exploration, Graham and Keller (2020) investigated 300 Twitter accounts to assess the role of social bots’ role in spreading debunked arson claims (PolitiFact, 2020) during the Australia bushfires. Our study is motivated by this specific use case but utilizes more than 1 million Tweets sent by more than 670,000 unique accounts during the entire 2019/2020 Australian bushfire season and explores how climate change, in general, was framed in relation to the fires in Twitter, and to what extent social bots shaped online conversations and framings. Specifically, we address the following research questions:
Research Question 1 (RQ1). How prevalent is climate change as a topic in Tweets sent in response to the 2019/2020 Australian wildfire crisis, and what general engagement patterns can be observed?
Research Question 2 (RQ2). How is climate change framed in relation to online conversations about these fires, with which stance and resonance?
Research Question 3 (RQ3). How (frequently) do social bots contribute to online communications on climate change and to specific frames?
Background: The 2019/2020 Australian Bushfires and Climate Change
In 2019/2020, Australia experienced a bushfire season that was unprecedentedly long and severe. Wildfires are a natural part of the Australian ecosystem, and more than 30 large wildfire or mega-fire events have been documented since 1851 for different regions of Australia (Morgan et al., 2020). However, the so-called “black summer” bushfires were unprecedented in that they burned more than 10 million hectares (an area almost twice as large as the largest documented mega-fire in 1951), stretched across multiple Australian states and territories and affected both rural and densely populated urban areas (Davey & Sarre, 2020).
The year 2019 was the warmest and driest year recorded since standardized observations began in 1900 (Jan Van Oldenborgh et al., 2021), creating conditions that elevated the “Forest Fire Danger Index” to its highest since its introduction in 1967 (Royal Commission into National Natural Disaster Arrangements, 2020). First warnings of an unusually early start of the bushfire season in Queensland were issued by fire services in June 2019 (“Bushfire season Starts Early Across Northern Australia Due to Ongoing Hot, dry Conditions,” 2019), July saw smaller fires in New South Wales, developing into major fire events throughout September and October (Davey & Sarre, 2020). By December, hundreds of fires were burning across all Australian states (Davey & Sarre, 2020). Sydney was blanketed in smoke for several days, creating hazardous levels of air pollution (News Life Media, 2019). Fires continued to burn throughout January, a major fire threatening the Australian capital Canberra in late January (BBC News, 2020).
Most fires were extinguished by March 2020 (Davey & Sarre, 2020). A small fire in early May (Mandurah Mail, 2020) concluded a fire season that had lasted almost 1 year, burned through more than 10 million hectares (Davey & Sarre, 2020), caused the death of 33 people, destroyed more than 3,000 homes, and had severe impacts on ecosystems with estimates of up to 3 billion animals killed or displaced (Filkov et al., 2020; Jan Van Oldenborgh et al., 2021; Royal Commission into National Natural Disaster Arrangements, 2020).
Approximately 900 million metric tons of carbon emissions were created by the fires (Filkov et al., 2020). The fires impacted water catchment areas (Davey & Sarre, 2020) and created hazardous air pollution that is estimated to have caused hundreds of excess deaths and thousands of hospitalizations due to respiratory problems (Borchers Arriagada et al., 2020). The economic impact of up to A$20 billion exceeds that of previous fires (Filkov et al., 2020; Royal Commission into National Natural Disaster Arrangements, 2020).
The increased likelihood of extreme conditions precipitating fires of this unprecedented scale and severity can be attributed to anthropogenic climate change (Jan Van Oldenborgh et al., 2021). This connection was also reflected in the public communications during the fires in traditional media as well as social media documented, for example, by the popular Twitter hashtag #climateemergency used in conjunction with Tweets on the fire. With the worsening of the fire crisis, the Australian government faced increasing criticism for its stance on climate change, and senior figures from the Australian fire and emergency services called for stronger emission reduction policies (Chester, 2020).
Chester (2020) summarizes the significant “problem and solution metamorphosis” of the official government narrative throughout the bushfire crisis. Initially, the Prime Minister and his conservative government consistently portrayed the fires as a “natural disaster,” minimized Australia’s contribution to global emissions, claimed negative economic impacts of higher emission reduction targets, and rejected their effectiveness in preventing bushfires (Chester, 2020). After several weeks of fires, the public mood worsened and in early December the government's narrative shifted, now framing the continuing crisis as a problem of “hazard reduction and bushfire preparedness,” putting blame on states and territories for insufficient preventative burning (Chester, 2020). In the public discourse, this was reinforced by incorrect claims of a “green conspiracy” to prevent hazard burning or arson as the main cause of the fires (Chester, 2020; FactCheck, 2020; “Factcheck,” 2019; PolitiFact, 2020). Especially, the debunked arson claims—fueled primarily by an article in one of Australia’s largest newspaper (FactCheck, 2020)—received a significant social media echo, allegedly with the support of social bots and trolls (Graham & Keller, 2020). The spread of misinformation and the impact of social bots in turn attracted substantial mainstream and social media attention around the world, including in high-profile media like the New York Times and The Guardian (“Bots and Trolls Spread False Arson Claims in Australian Fires ‘disinformation Campaign,’” 2020; “Fires Misinformation Being Spread Through Social Media,” 2020; “How Rupert Murdoch Is Influencing Australia’s bushfire Debate,” 2020).
Intensifying criticism of insufficient government financial support for volunteer firefighters and bushfire victims—compounded by public anger over the Prime Minister holidaying in Hawaii in mid-December at the height of the fires—eventually led to another shift in the government’s narrative by January claiming a need for extended national emergency powers, including the ability to declare a national emergency or deploy the military for disaster responses (Chester, 2020). This also became one of the issues addressed by a national public inquiry (Royal Commission into National Natural Disaster Arrangements, 2020) into the 2019/2020 bushfires, which the Australian government announced in February 2020 (Chester, 2020).
The shifting narratives, framings, and key events are also reflected in our dataset of Tweets covering the 2019/2020 Australia bushfires. How they were disseminated and how they resonated is a key part of our analysis.
Data and Method
Tweet Data Collection
We utilized the Twitter Academic Research Product track API 1 which provides access to the full archive of public Tweets sent since March 21, 2006. We first assembled a dataset of Tweets explicitly mentioning the Australia bushfires in the 2019/2020 bushfire season. We considered Tweets posted between June 1, 2019, and May 30, 2020, containing the keywords “australia” and at least one of “bushfire,” “wildfire” or “forest fire.” This yielded 1,097,432 Tweets including replies, quote Tweets, and Retweets; 13.6% of those Tweets are considered unique, that is, they are original Tweets, replies, or quote Tweets (see also Table 1 with counts and percentages of the different Tweet types for all data subsets in this study).
Tweet Counts and Shares by Tweet Type and Tweet Subset.

We chose keywords that reduced ambiguity and therefore excluded more general keywords like “fire” or “burning” but required a reference to “australia” to ensure that our search matched Tweets referencing the fires in Australia. Tweets posted in a local context that may not mention “Australia” will thus be missed. Hence, the number of Tweets posted with reference to the Australia bushfires is likely higher than our sample and more representative of the global than local discourse about the Australia bushfires. Furthermore, we can assume that some originally send Tweets were no longer accessible at the time of data collection because accounts contributing relevant Tweets have since been suspended or may have changed their account visibility.
Identification of Climate Change Tweets
We adapted approaches similar to Roxburgh et al. (2019) and DeVerna et al. (2021) to identify Tweets referencing climate change within the complete set of Australia fire Tweets. Starting with a set of 19 initial keyword patterns including, for example, variations in “climate change,” “global warming,” or “climate hoax” (see the Supplementary Section A.1.1 for more information and a full keyword pattern list). We reviewed Tweets matching those patterns to identify additional keywords. The process was repeated until no new keywords could be identified and resulted in a total of 102 keyword pattern variations.
Applying the complete keyword list matched 108,219 of the 1,097,432 Australia fire Tweets, this subset is referred to as “climate change Tweets” throughout this article, all other Tweets as “general fire Tweets.” In all, a total of 13,132 climate change Tweets are considered unique, that is, are original Tweets, replies, or quote Tweets. Table 1 indicates the counts and percentages of the different Tweet types for this dataset.
Climate Change Frames
We adapted the climate change frames coding schemes by O’Neill et al. (2015) and Roxburgh et al. (2019) which were employed in previous studies that explicitly analyzed climate change frames in Tweets. Our approach differs in the number and definitions of certain frames. Furthermore, our utilized methodology and coding scheme design reflects the conceptual structure of “framing theory” as summarized by Chong & Druckman (2007).
The framing of an issue in communication highlights one perspective, with the intent to give this “frame in thought” a higher salience and in turn influence a person’s attitude toward or against an issue. As stated earlier, the major premise of framing theory according to (Chong & Druckman, 2007) is that an issue can be viewed from multiple perspectives, which—in an idealized model—combine as the sum of positive and negative evaluations to form an individual’s overall attitude toward this issue.
Here we are interested to explore which frames are invoked by Tweets referencing climate change in the context of the Australia 2019 bushfires. Thus, with reference to “framing theory,” the issue is climate change and its mitigation, where frames are invoked in support or opposition to climate action (framing intent) to influence recipients’ overall evaluation of the issue and in turn attitude. Throughout the text, we use the terms “climate action” or “addressing climate change” interchangeably, and the opposing stance is captured by “climate inaction.” Table 2 provides an overview of the employed frame coding scheme.
Summary of Applied Frames for Tweet Coding. Detailed Descriptions and Instructions for Coders Are Included in the Supplementary Material (see Section A.1.2).

Our framing scheme was adapted based on frames suggested by O’Neill et al. (2015) and Roxburgh et al. (2019) and defined after several rounds of reviews during which the frames were tested based on small (50–100) random samples of Tweets from our dataset.
Our frame coding scheme also suggests a high-level grouping (called “Frame group” in Table 2) of the employed frames, which is referenced in the presentation of results:
Foundations and premises for climate (in)action: Frames in this group highlight fundamental reasons, concepts or values that are cited to justify acting or not acting on climate change and include Settled Science (SS), Contested Science (CS), Uncertain Science (US), and Morals and Ethics (ME). These frames are based on orthodoxies or values that imply action or inaction. According to (O’Neill et al., 2015) frames like “settled science” or “contested science” assume a linear policy model, the implied action follows directly from the acceptance of the frame’s proposition.
Climate change impacts: Frames in this group highlight the observable or predicted impacts of climate change, are almost exclusively invoked in support of climate action, and include Connection to Extreme Events (EX), Damages and Costs (DC), Individual Human Needs (IHN), and Security, Conflicts and Equality (SC).
Solutions and responses: Frames in this group highlight potential strategies and measures of addressing climate change as well as the effects of these solutions and include Political and Ideological Struggle (PIS), Economic Dimensions (E), Co-benefits and Opportunities (CO), and Technical Solutions (TS). All these frames could be invoked in support or opposition to climate action.
Communication and reflections: Frames in this group represent a meta-level framing in that they may highlight aspects of the climate change discussion that employs the frames in the other groups and include Role of Science and Media (ROSM), Information and Debate Integrity (IDI), Humor, Satire, Parody, Ridicule (HSP), Emotion, Sympathy, Charity (ESC). Frames in this group could be invoked in support or opposition of climate action.
Coded Tweet Samples
For our main analysis, we selected a subset of the most retweeted Tweets from the dataset of 13,139 climate change Tweets with distinct content. Since Retweets duplicate original Tweet content, the amplification of content through Retweets allows us to assess the prevalence and resonance of different climate frames with regard to the complete dataset. While the content of a Retweet is identical to the original Tweet, the Retweets are contributed by different (potentially automated) accounts, which is a key element of our analysis. We chose to apply a frame analysis to the 412 most retweeted Tweets, which allows us to infer climate change frames for approximately 67% of all Tweets in the complete dataset and also at the same time covering 76.4% of all unique Twitter accounts in the dataset.
All Tweet samples were coded independently by two coders who were asked to assign a primary frame, the perceived framing intent (i.e., in support or opposition to climate action), and whether the Tweet constituted an example of climate change denial. In the case of different assignments for each of the captured properties, they were discussed by coders and either a common assignment was agreed or the Uncertain (UN) frame or “not sure” for other properties was assigned. Additional information about the selection and coding of samples is available in Supplementary Section A.1.2.
Social Bot Analysis
We employ the machine learning classifier Botometer (Sayyadiharikandeh et al., 2020) to determine the likelihood of automation for individual Twitter accounts. Botometer returns several specialized bot scores as numeric values in the range of 0 to 1, with higher values indicating a larger likelihood that an account is automated, that is, a Twitter bot (see also Supplementary Section A.1.4).
We utilize Botometer’s “astroturf” bot score, more specifically, the “ENGLISH astroturf” botscores. This score allows us to consider the element of account automation as well as the likelihood that an account is employed as part of an astroturf campaign, that is, is part of a group of coordinated accounts with the intent to give the impression of an organically emerging grassroots social media movement (F. B. Keller et al., 2020). We obtained bot scores for all unique accounts in the climate change Tweet set.
The problem of “false positives” makes the use of a specific bot score threshold to categorize an account as a social bot problematic (Rauchfleisch & Kaiser, 2020). Our results are therefore provided as distributions of bot scores for groups of Twitter accounts, rather than as a binary assessment based on a predefined threshold. In the interest of easier comparison and visualization of our analysis, we also make use of three bot score classes, where bot score values larger than 0.75 are referred to as likely automated accounts (bots), while scores below 0.25 are referred to as likely non-automated accounts (humans).
Results
Climate Change as a Topic During the Fires
Tweets referencing climate change in connection with the bushfires—according to the keywords we identified—account for 9.86% of the 1,097,432 Tweets in our dataset, 8.81% of all unique Tweets (i.e. original Tweets, replies, and quotes, all of which require the Twitter user to author content), and 10.03% of all Retweets (RTs).
Figure 1 visualizes the temporal dynamics of the two data subsets, indicating both original Tweets (including replies and quote Tweets) and Retweets. The first fire-related Tweet matching our search terms was posted on June 03, 2019, the first Tweet referencing climate change and bushfires on June 06, 2019. The Tweet frequency of both Tweet sets follows largely the same pattern with the main communication activity concentrated between December 2019 and January 2020, when the bushfires were most intense. A range of topics and events were covered by the high Tweet frequency in January, among them the worsening of the fires, direct fire threats to urban areas, the engagement of global celebrities in the discussion about links between climate change and the fires as well as intense criticism of the Australian Prime Minister’s political response to the bushfires.

Daily frequency of Retweets and original Tweets (including replies and quote Tweets) for two datasets with Twitter posts referencing the Australia bushfire in general and posts specifically mentioning climate change in the context of the fires.
Climate change Tweets exhibit different engagement patterns compared with general fire Tweets. Table 3 summarizes the average number of replies, quotes, retweets, and likes generated by original Tweets in either dataset. Climate change Tweets are 3.2 times more likely to trigger replies and 1.6 times more likely to be quoted than general fire Tweets. The latter are slightly more likely to be liked (1.1 times) while both types of Tweets have a comparable Retweet resonance.
Engagement Patterns for Original Tweets.

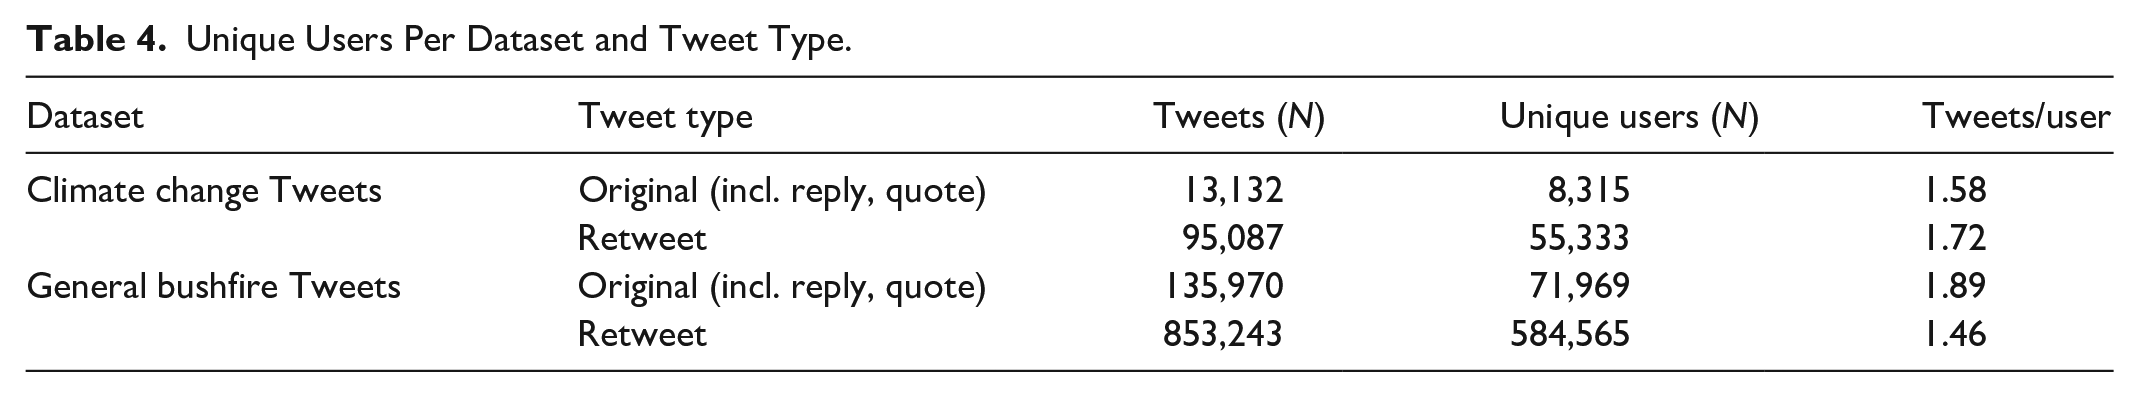
This same Retweet resonance is however based on different user mobilization patterns, which is summarized in Table 4. Climate change Tweets are retweeted by a smaller relative number of unique users compared to general fire Tweets. This means that a user retweeting a climate change Tweet is more likely to do so again compared to a user retweeting a general fire Tweet. In contrast, a user authoring an original climate change Tweet is less likely to do so again than a user authoring a general fire Tweet. Thus, in relative terms, climate change as a topic mobilizes a broader user base but is propagated by a relatively smaller more engaged user base, while the reverse is the case for general fire Tweets.
Unique Users Per Dataset and Tweet Type.
Climate Change Frames
Our analysis of climate change frames focuses on the manually coded sample of the 412 most retweeted climate change Tweets. The distribution of this sample mirrors the Tweet frequency displayed in Figure 1, approximately 52% of most retweeted Tweets was posted during January (see also Supplementary Table S4). Nine of the coded Tweets were no longer accessible at the time of the frame coding, for five Tweets the coders could not agree on a frame (UN) and for four Tweets no frame (NAF) in the defined scheme fit the content.
Table 5 provides an overview of the results of this frame analysis and compares the frequency of frames in the most retweeted original posts, the corresponding frame frequency when considering all Retweets (RTs) of those original Tweets, and finally the resonance of a given frame expressed by the average number of RTs of Tweets coded with that frame.
Comparison of Frame Frequency in the Coded Sample of 412 Most Retweeted Original Tweets and All Corresponding Retweets.


Two frames dominate the most retweeted Twitter posts, the Political and Ideological (PIS) frame (40.9% of top RTs) and the Connection to Extreme Events (EX) frame (15.6%). They do however have distinctly different resonance and are propagated with lower shares and below-average resonance in the complete dataset (on average a Tweet in the coded sample is retweeted 177 times). In contrast, the Damages and Costs (DC) frame has the highest resonance (an average of 832 RTs per Tweet) and accounts for 24.5% of all RTs in the dataset. In terms of resonance, this is followed by the Settled Science (SS) frame (337 RTs per Tweet), which applies to 4.2% of the coded Tweets but 8.0% of all Retweets.
Frames promoting climate change contrarian positions, Uncertain Science (US) and Contested Science (CS), represent only a small percentage of coded Tweets (2.4% combined) and Retweets (2.9% combined), but the Uncertain Science frame has the third highest resonance in terms of Retweets per Tweet (221) in this frame group, which hints at a large mobilization potential for those Tweets.
The “meta-frames”—Humor, satire, parody (HSP), Role of Science and Media (ROSM), Information and Debate Integrity (IDI), Emotion, Sympathy, Charity (ESC)—combined apply to 22.4% of the coded most popular Tweets and 17.6% of all Retweets. The IDI frame does however resonate highly with an average of 207 Retweets in the coded Tweets.
In summary, we thus observe that frames highlighting the causality between climate change and the fires, its devastating impacts, and the need for political action dominate the Twitter conversation, while contrarian framings play a limited role.
This is also reflected in Figure 2. It illustrates the temporal frequency of frames based on the coded 412 most popular Tweets and their Retweets as well as the coded intent or polarity with which the frame is invoked. This helps us to understand if specific frames and intents are communicated continuously or may be tied to specific events.
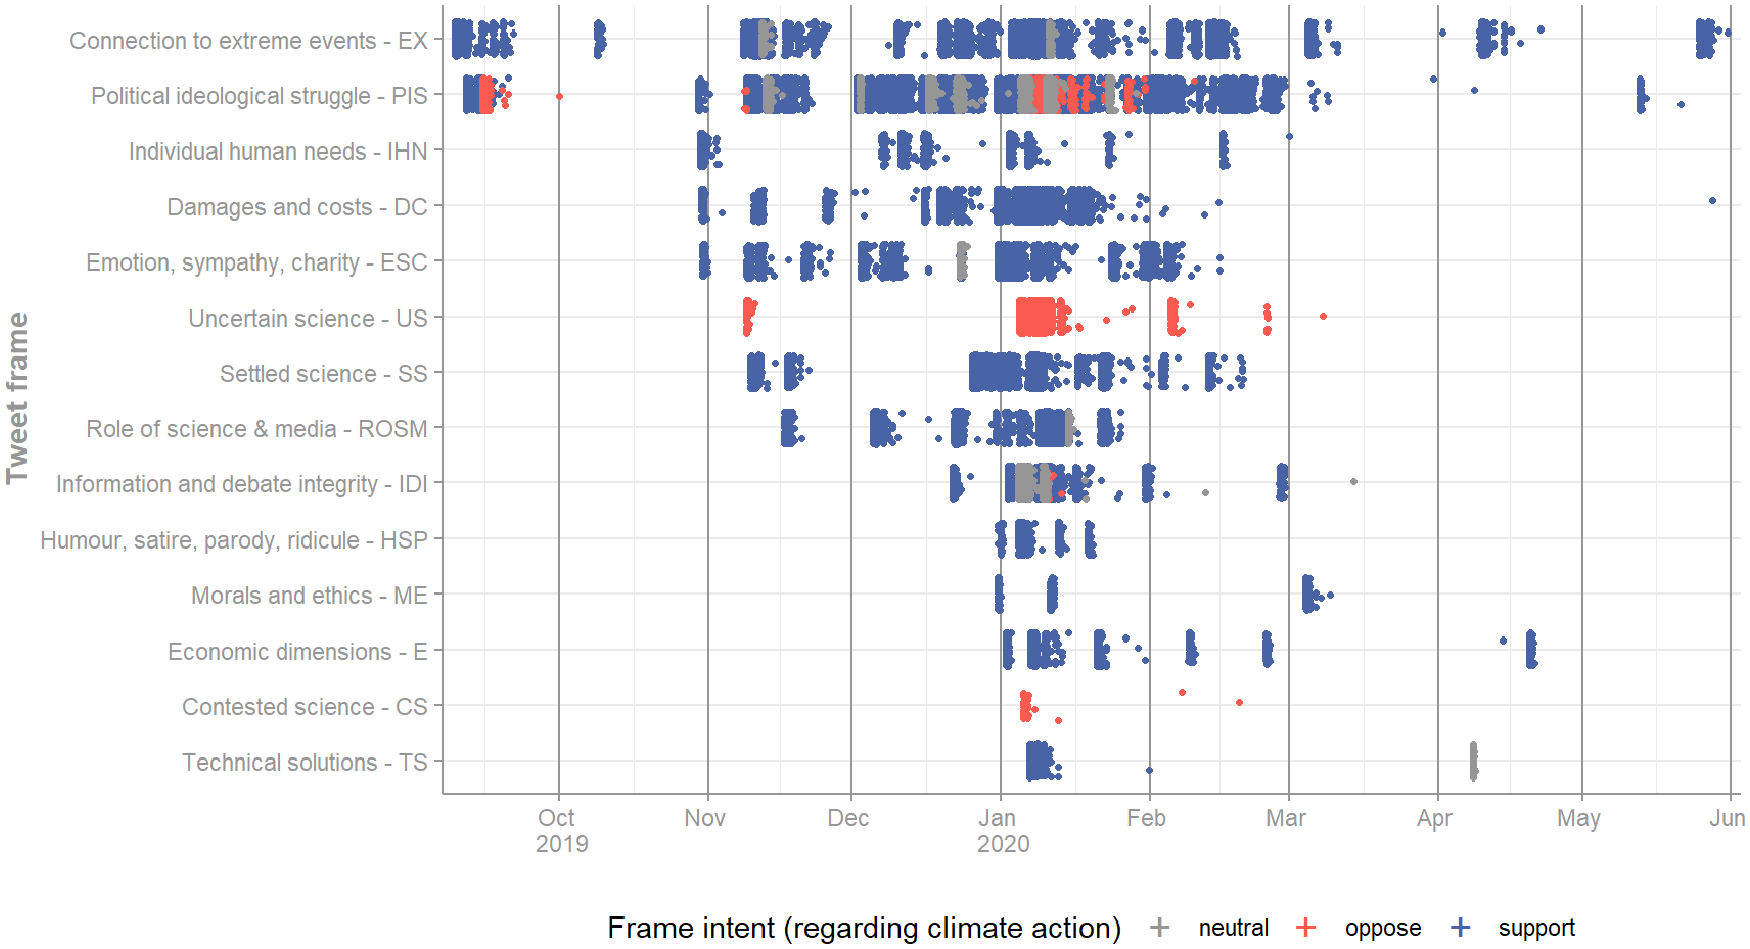
Temporal frame invocation pattern. The figure indicates the publication time and frame intent for all Tweets and Retweets for which frames could be assigned.
In line with the general Tweet frequency (see Figure 1) most of the highly retweeted posts are concentrated in the period of most activity in late December and early January, some frames (HSP, ME, CS, TS) are almost exclusively occurring in this time window. The most persistently popular frame is EX, which is also the first (popular) framing that occurs, followed by PIS, which is also the framing that generates the most controversy, that is, invoked both in support and in opposition to climate action. Only four frame—PIS, IDI, US, and CS, the latter two exclusively—provide such opposing frames.
Frames opposing climate action first emerge and receive some resonance in mid-September 2019 (here blaming environmental regulations and insufficient bushfire prevention strategies), then again in November 2019 with outright climate change denial Tweets. In January 2020, contrarian frames concentrate on the debunked arson claims. Later instances blame again environmental regulations and green as well as left-wing “propaganda.”
Hence, frames seemingly change over time. The dominant framing at the outset of the fires focuses on the connection of fires to climate change as well as the political responsibilities, actions, and policies associate with these. Both these frames persist throughout the fire season. As the severity of the fires escalates, additional frames become popular in late November with a focus on individual impacts (IHN), damages, and costs (DC) as well as appeals to sympathy and emotion (ESC). Discussions around the scientific basis of climate change (SS and US) are added in the next phase and become most intense around the January period. The role of media (ROSM) and the largely self-referential discussions about misinformation and the (social) media echo of the fires (IDI) evolve in parallel. All other identified frames (HSP, ME, CS, TS, and E) emerge during the period of high-frequency Tweeting in January but only the economic framing continues to gather some attention in the aftermath of the main fire period.
Social Bots and Climate Change Frames
To what extent were these evolving framings affected by the activity of social bots? Our analysis concentrates on the “astroturf” bot score for retweeting accounts. Figure 3 provides an overview of bot scores for accounts sharing Tweets coded with the different frames.

Botometer bot scores by frame for Tweets in the climate change Tweet set. The results are based on astroturf bot scores associated with Tweets and Retweets covered by the frame analysis. To illustrate different shares of account types accounts with bot scores less than 0.25 were considered “likely human,” bot scores greater than 0.75 as “likely bot.”
The bot score analysis for different frames highlights that climate change frames are propagated (i.e., retweeted) with different “automation signatures.” The median astroturf bot scores for all retweeting accounts range from 0.25 for the SS frame to 0.48 for the ME frame. Distinctive automation signatures emerge between frames, ranging from the SS frame, where nearly half (48.6%) of all accounts propagating this frame are likely human and only 5.5% likely bots, to the ME frame where 17.1% are likely humans and 11.1% likely bots.
The frames with the highest shares of likely bots are (in order) HSP, ME, IDI, ESC, CS, and DC. It is notable that all of these are frames that can invoke emotions (DC, ESC, HSP, and ME) or content that is prone or known to polarize (CS and IDI). In contrast, a frame invoking a rational angle like SS has the lowest share of likely bots.
Frames exhibit different levels of automated propagation, but without knowing the attributes that trigger a bot—for example, specific accounts, account properties (high follower numbers), links, hashtags or mentions of other Twitter accounts—it is not possible to explain this contribution. We can however state that automated accounts contribute with sizable shares and especially help to propagate frames that emotionalize the climate change conversation around the fires.
Discussion
Climate Change as a Topic During the Fires
In our analysis of more than 1 million Tweets about the 2019/2020 Australia bushfires, we find that Tweets referring to climate change account for a significant share of online conversations (RQ1), 8.81% of original Tweets, and 10.03% of all Retweets were identified as Tweets referencing climate change. While the number of mentions of “climate change” has been increasing on Twitter in general (Shi et al., 2020), these shares are notable. They are substantially higher than those reported in a related study by Roxburgh et al. (2019) on Twitter climate change discourse during three major hurricanes in the United States between 2011 and 2016.
A number of factors may have contributed to the large share of Tweets that connect bushfires with climate change: the unprecedentedly early start of the fire season and its severe impact; the broadly criticized political position of the Australian government on climate change (Chester, 2020) including personal and political scandals during the fires; and the contribution of several celebrities with a large social media reach. All of these did however also apply, at least partly, to the examples reported by Roxburgh et al. (2019)—that is, a politically charged environment during two US presidential elections, Tweets by high-profile public figures, or the out-sized severity of one of the hurricanes—and can thus not explain the higher share of climate change Tweets in our dataset. An additional explanation for the large share of climate change in the Twitter conversation could therefore be that public awareness of climate change in connection with extreme events has increased and that long-lasting wildfires are events that build and retain more long-lasting public attention.
Framing of Climate Change
Our results show that climate change in the context of the bushfires is framed (RQ2) primarily with reference to its impacts (both the causality (EX) and the resulting costs and damages (DC) frames) and with reference to the required solutions and responses, specifically the political and policy responses (PIS). Tweets critical of climate action or denying climate change, such as Uncertain Science (US) and Contested Science (CS), represent only a small share of the Twitter climate-change conversation, and this framing was apparently not very successful in the Twitter bushfire-climate-change conversation as a whole.
Significant attention was nevertheless given to instances of climate denial and misinformation, both by media outlets (e.g., “How Rupert Murdoch Is Influencing Australia’s bushfire Debate,” 2020) and by initial Twitter analyses (Graham & Keller, 2020). This is reflected in our analysis by the high engagement with the IDI frame. The temporal patterns shown in Figure 2 highlight this further. The US frame (especially in connection with the claim of widespread arson) is promoted in early November 2019 without significant resonance but only resonates on social media in parallel with the discussion about instances of social media manipulation and misinformation.
The discussion about bushfire misinformation thus overshadowed (with respect to Tweet or frame share) the actual misinformation itself; results from a related study on discussions about news reports of misinformation during the Australia bushfire also support this interpretation (Weber et al., 2020). The galvanizing event around this appears to have been the attention generated by an article published in a conservative Australian newspaper on January 2, 2020 (FactCheck, 2020). These media links were in turn shared on social media such as Facebook and Twitter; several of these Tweets were captured in our frame analysis as instances of the US frame. Both the original article and the few social media instances in turn triggered reporting in mainstream media (“Bots and Trolls Spread False Arson Claims in Australian Fires ‘disinformation Campaign,’” 2020; “How Rupert Murdoch Is Influencing Australia’s bushfire Debate,” 2020), which then generated an intense and heavily engaged Twitter discussion about the spreading of bushfire misinformation, as captured by the IDI frame in our analysis.
In summary, the main findings of our frame analysis of the most popular Tweets are thus that (1) climate change during the bushfires is largely discussed and communicated with reference to its impacts and costs and that (2) media claims of widely diffused misinformation and climate denial were exaggerated compared to the results of our analysis.
Contributions of Social Bots to the Twitter Discourse
Our analysis shows that the different Twitter conversations—on climate change and specific framings—exhibit different “automation signatures” (RQ3). Tweets framing climate change with an emotional or polarizing perspective show higher shares of automated accounts, whereas contrarian or climate denial frames show lower patterns of automation (together with the fact-focused Settled Science frame).
In contrast to previous claims, social bots appear not to be the main source of climate misinformation nor do they dominate the Twitter climate change conversations. The shares of frames that were covering instances of misinformation (Contested Science (CS), Uncertain Science (US)), or were communicated with an opposing intent (PIS, IDI)—including outright climate change denial—are small and did not resonate with a broad user base. Furthermore, the automation signatures of the most frequently changed contrarian frame (US) is closer to that of the frame with the lowest average bot score, namely, the SS frame.
In fact, the frame with the second largest average (median) astroturf bot score and the highest share of likely bots is Humor, satire, parody (HSP). Responding with humor or satire to a serious event could be a way of coping, a means to communicate political criticism, but also trivialization of an issue. The sample in this group was relatively small and does not allow us to discern whether the contribution of bots in this area is one of adding to polarization through satire or trivialization through the promotion of entertaining jokes. Neither can we discern the intent of deploying these bots, whether it is to intentionally create polarization, mundane motives like propagating “clickbait” or gaining followers, nor the impact on the collective debate or individual users.
Conclusion
Twitter has become one of several online media with a strong influence on the communication and deliberation of important current societal issues. This includes the question of how extreme events attributable to climate change may influence perceptions and acceptance (Boudet et al., 2019) of climate change as a societal challenge. Such extreme events are becoming more likely due to climate change (IPCC, 2021), and are thus likely to provide a common context for the public conversation on climate change.
Consequently, our study explored the Twitter discourse and framing of climate change during the 2019/2020 Australia bushfires. The study built on previous work on climate change framing in online social media (Roxburgh et al., 2019) but combined frame analysis with a large-scale evaluation of automated Twitter accounts to identify “automation signatures” for specific frames. To our knowledge, this is the first attempt to consider social bot influence on the framing of climate change discussions in social media.
We found that the topic of climate change accounts for a substantial share of Tweets referencing the bushfires, larger than those documented for related previous case studies (Roxburgh et al., 2019). We attribute this partly to the nature of the event as well as the increasing invocation of emergency frames of climate change communications in general, for example, through “climate emergency declarations” by governments, organizations, businesses, and other societal actors (Patterson et al., 2021). The apparently increased public attention that climate change receives in connection with catastrophic environmental events and its role in shaping public discourse deserves further investigation, however, for example, by studying similar events along an extended time scale, not least to understand patterns of public mobilization and potentially polarization around the topic of climate change.
A frame analysis—designed in accordance with framing theory (Chong & Druckman, 2007)—of a sample of most retweeted messages reveals that the dominant climate change perspectives are primarily concerned with the causal link between climate change and the fires, its observable impacts and costs as well as political perspectives and responsibilities.
We also found that the discussions about climate change communications and the spread of misinformation during the fires outweigh the actual share of misinformation or outright climate denial. This should be considered in light of research indicating that the debunking of misinformation can in some instances “backfire” (Nyhan, 2021; van der Linden, 2019), increase its acceptance (Lazer et al., 2018), have a continued influence (Ecker et al., 2022), and that journalists and traditional media can play a role in unwittingly generating large exposure for disinformation which otherwise saw only minor engagement in social media channels (Rid, 2020).
Furthermore, with regard to social bots we find that they contribute more to frames invoking emotional themes but not necessarily to frames that negate climate change or are communicated with the intent to oppose climate action. At the same time, we found that messages communicated in support of climate action as well as climate denial frames tap into communities that are quickly mobilized but not necessarily through automation. Taken together, the evidence suggests that the interplay of traditional media outlets, social media, and social bots needs to be explored in more detail to understand both the mechanisms and impacts of environmental misinformation during a crisis event like the Australia bushfires.
Considering the influence of frames in communication and the fact that social bots can communicate indiscriminately and easily at volume, the influence of social bots on shaping public discourse and hence perceptions of climate change cannot be discarded. It deserves and requires however a more detailed exploration, to better understand the potential intent, triggers and impacts, and unintended consequences. Social bots clearly are involved in propagating frames in support and opposition of climate change action, with the potential to create largely automated information cascades, with unknown consequences.
Future research on these information dynamics, communicated climate change frames and potential misinformation impacts should also consider the distinction between local and global discourses. Our data were representative of international discourse on the fires, but local discourses could exhibit distinctive communication and automation patterns with different impacts.
A key challenge of such research is however the timeliness of data collection. Our data source, the Twitter Academic API, opens access to the complete Twitter archive, but post hoc data collection for social bot research suffers from changes in the available data: Accounts become inaccessible due to suspensions or changes in account visibility, thus representing only a partial view of the originally shared Tweets. We argue further that a real-time evaluation of bot accounts paired with data on the dynamics of content and follower networks of individual accounts offer an opportunity to fully utilize framing theory (Chong & Druckman, 2007) by mapping its conceptual impact model on Twitter data and communication processes and thus offer better assessments of the individual impact of climate change framing and in turn the role of social bots.
Supplemental Material
sj-docx-1-sms-10.1177_20563051231168370 – Supplemental material for Automated Framing of Climate Change? The Role of Social Bots in the Twitter Climate Change Discourse During the 2019/2020 Australia Bushfires
Supplemental material, sj-docx-1-sms-10.1177_20563051231168370 for Automated Framing of Climate Change? The Role of Social Bots in the Twitter Climate Change Discourse During the 2019/2020 Australia Bushfires by Stefan Daume, Victor Galaz and Petter Bjersér in Social Media + Society
Footnotes
Acknowledgements
We would like to thank the two anonymous reviewers for their insightful comments which helped to improve the manuscript and triggered interesting new ideas.
CRediT Author Statement
Declaration of Conflicting Interests
The author(s) declared no potential conflicts of interest with respect to the research, authorship, and/or publication of this article.
Funding
The author(s) disclosed receipt of the following financial support for the research, authorship, and/or publication of this article: Research for this article has been generously supported by the Swedish Research Council for Sustainable Development (Formas) through the project “Burning forests, bots and climate change attitudes” (2020-01586). Additional support has been provided by the Beijer Institute of Ecological Economics at the Royal Swedish Academy of Sciences and the research program “Complexity, Technology and Governance.”
Supplemental material
Supplemental material for this article is available online.
Notes
Author Biographies
References
Supplementary Material
Please find the following supplemental material available below.
For Open Access articles published under a Creative Commons License, all supplemental material carries the same license as the article it is associated with.
For non-Open Access articles published, all supplemental material carries a non-exclusive license, and permission requests for re-use of supplemental material or any part of supplemental material shall be sent directly to the copyright owner as specified in the copyright notice associated with the article.