
Abstract
Older adults are increasingly using smartphones. Researchers have identified demographic, attitudinal factors and social outcomes related to inequalities in access, skills, and activities of internet use. While this research has been ongoing for years, studies about the digital inequalities related to the use of smartphones by older adults are still scarce, and they rarely have undertaken sociocultural comparisons of usage. This article builds on an analysis of tracking data of older adults’ (pp. 55–79) smartphone use, to explore digital inequalities around traditional axes of inequality and sociocultural factors that shape older adults’ smartphone use. It adds a comparative perspective for understanding emerging inequalities related to sociocultural contexts to the existing literature. The results show that differences cannot be explained solely by sociodemographic factors, but also possibly by national policies and culture. Particularly, age, on its own, is not able to explain the differences reported. Older adults engage in a range of different activities on their smartphones, and differences between groups across the traditional axes of inequalities do not mirror exactly the differences found in previous research on internet use. This is important considering the risk of emerging new inequalities and the ongoing revisiting of policies to mitigate them.
Introduction
People’s everyday lives have drastically changed since the advent of digital technologies and the widespread adoption of smartphones. This is true for older adults too. With smartphones, older adults can communicate, remain in touch with others and engage in a massive array of activities, from gaming to managing finances. Internet use among older adults has steadily increased over time (Hunsaker & Hargittai, 2018). In fact, over the last 5 years, they have become the fastest growing social group in terms of internet and mobile device adoption in the United States and Europe (Anderson, 2017; Eurostat, 2022a). Smartphone use is arriving to most adults aged 55–74 years in the four countries of this study: Canada, the Netherlands, Spain, and Sweden. In 2020, 54.1% of Canadian adults aged 65+ years used smartphones (Government of Canada and Statistics Canada, 2021). 1 In 2018, 2 in the Netherlands, Spain, and Sweden, 75%, 63%, and 75% of adults aged 55–74 years used smartphones (Eurostat, 2022b). However, the smartphone use of older people tends to be less intensive than younger generations, but it is key to their social connectedness and inclusion (Rosales & Fernández-Ardèvol, 2019a). Given this trend, we should take a closer look at how older adults use smartphones and explore the relevance and nature of the digital inequalities behind smartphone adoption, given that they can have an important role in moderating their wellbeing and social inclusion (Büchi & Hargittai, 2022; Chan, 2018; Stevic et al., 2021).
Studies have analyzed older adults’ access to and use of the internet and the relationship between engagement and various social outcomes, including social capital, digital literacy, citizenship and loneliness (e.g., Francis et al., 2019). However, they rarely have addressed the differences between broader sociocultures of digital technology use (an exception in Caliandro et al., 2021) and even less from a comparative perspective (an exception comparing the United Kingdom and United States in Dutton & Reisdorf, 2019). Past research has shown that older adults’ internet engagement varies depending on certain sociodemographic variables (mainly gender, age, income, and education), as well as their individual digital skills and experiences (Hunsaker & Hargittai, 2018; Reisdorf & Groselj, 2017). Despite the wealth of studies on older people, most of them are underpinned by discourses focusing on their needs, impairments, illnesses, declines and other deficiencies that can be alleviated with the support of technologies (e.g., Cotten, 2017; Fang et al., 2018). Some examples include their lack of social contacts (Baker et al., 2017), poor health (Cotten et al., 2014) and scarce mobility (Hunsaker & Hargittai, 2018). This one-sided view diminishes the perception of older adults as agentic users able to create internet and smartphone use cultures. Studies sometimes fail to even consider the possibility that this group’s reduced engagement could be based on informed and conscious decisions, rather than guided by deficiencies (Wyatt, 2003).
To tackle the complex and unseen inequalities associated with smartphone use, we should first know how and for what smartphone apps are used. This article fills this gap by studying patterns in smartphone app use among older adults. App activities’ patterns are used as indicators of distinct sociocultures of smartphone usage. It redresses the lack of comparative studies on this topic by analyzing smartphone use in four countries: Canada, the Netherlands, Spain, and Sweden. These countries were chosen because they display similar rates of internet access: over 90% (Fernández-Ardèvol et al., 2019; ITU, 2022). As we have argued elsewhere, they constitute relevant contexts for a comparative analysis of digitization of later life as different levels of internet diffusion and smartphone usage have shaped the local digital practices differently (Loos et al., 2022). We explore the frequency and diversity of smartphone use by country, as well as the factors that are related to different patterns of use to show that smartphone use is modeled by social factors such as gender, age, and educational attainment, which are well-known sociodemographic characteristics affecting digital inequalities (Robinson et al., 2020). The four-country comparison also allowed us to identify a wide and diverse range of activity patterns that forms the basis of the discussion about the potential relationship between sociocultural contexts and digital inequalities.
Digital Inequalities and Age
Recent research in this field has called attention to emerging forms of inequality that surface alongside established types of discrimination (Robinson et al., 2020). It has also shown that digital divides (i.e., in material access and subscriptions) reinforce existing inequalities and increase the possibility of these affecting people’s lives (van Deursen & van Dijk, 2019). Older age has been conceptualized as a source of digital inequality since the study of ICT (information and communication technology) adoption began.
The first level of digital inequality research investigated access to computers (Dutton et al., 1987) and the internet (DiMaggio et al., 2004) and users’ sociodemographic characteristics around the concept of the digital divide. At that time, the research suggested that being old was an important predictor of lack of computer and internet access. As internet penetration increased, the second level of digital inequalities was formulated as a critique of the “haves” and “have-nots” dichotomy of the digital divide concept. These studies looked at the differences among internet users in terms of equipment, the autonomy of use, skill, social support, and the purposes for which the technology was employed (DiMaggio & Hargittai, 2001; Gonzales, 2016; van Dijk, 2006). Results found that old people often make less and less diverse uses of the internet, and have lower digital skills than younger generations (Rosales & Fernández-Ardèvol, 2019a). Further studies examined people’s attitudes and motivations toward using the internet (Facer & Furlong, 2001; Reisdorf & Groselj, 2017) in relation to their sociodemographic characteristics. Similarly, old age negatively relates to all the dimensions studied. The third level of digital inequalities (van Deursen & Helsper, 2015) has come to the fore, concerned with the differences in social outcomes (i.e., social capital, wellbeing, social support) in populations with near-universal internet access.
In the three levels of digital inequalities research age is generally considered to negatively affect engagement, which encompasses skills, uses, attitudes, motivations as well as other factors (Hunsaker & Hargittai, 2018; Jones & Fox, 2009; Selwyn, 2006). For instance, those aged 75 +, are less interested in online activities such as email, shopping and civic services than adults aged 65–70 years (van Deursen & Helsper, 2015), which indicates less diverse internet use among this group compared with their younger counterparts. Gender-based differences are not so clear. Although there are several studies showing that more men use the internet than women (van Deursen & Helsper, 2015), others have found no differences, particularly among adults aged 50–65 years (König et al., 2018). The third level has brought more nuance to the fore, which is suggestive of sociocultures of digital technologies use. In terms of activity types, older men display a more diversified use of the internet; they are more interested in shopping, music and video consumption, and civic services than women, while older women are more interested in social entertainment (Hsu, 2018; van Deursen & Helsper, 2015). Higher educational attainment is positively associated with being an internet user in old age, as is computer use prior to retirement (Gilleard et al., 2005; König et al., 2018). Being employed also have a positive effect (Friemel, 2016). Finally, living alone has been reported to negatively affect digital engagement, and email use is less common among those living with others (van Deursen & Helsper, 2015). All agree that digital inequalities of any kind reinforce existing social inequalities (Robinson et al., 2020) but there are few studies using comparative perspectives (some exceptions include Hunsaker & Hargittai, 2018; König et al., 2018).
In addition, smartphone use may not display the same differential patterns than internet use. Research has begun to explore digital inequalities in the use of these devices, considering the new opportunities they afford people (Correa et al., 2021; Hargittai, 2021; Quan-Haase et al., 2021). One such study found differences in the types of activity that people engage in on their smartphones (Tsetsi & Rains, 2017). White, younger and higher-income individuals use smartphones more often to get news and information, while ethnic minorities and younger adults use them more often for social activities than White and older individuals. Some studies have also provided initial evidence that, while smartphones have increased the rates of internet access, those who only use smartphones to connect to the internet do not engage in diverse activities and come from lower socioeconomic backgrounds (Taipale, 2016; Tsetsi & Rains, 2017). The research studying smartphone use among older adults from a digital inequalities’ perspective is scarcer and supports the idea that older adults make less use of smartphones and in a less varied way, (De Nadai et al., 2019). To sum up, more research about the emerging types of inequalities associated with smartphone use by older adults is needed. Accordingly, this study asks the following questions that refer to the older adults analyzed in the study:
To what extent do (traditional) digital inequalities around age, gender, educational attainment, household size, and employment status are related to smartphone use among older adults?
To what extent does the country context shape smartphone usage?
Data and Methods
This study takes an exploratory, comparative, and data-driven approach. Although we gathered large-scale data on older adults’ smartphone activities and statistically found out patterns in our dataset, a qualitative approach was required to categorize the activities/smartphone apps and interpret the results. The method is not entirely computational or manual, nor is it purely quantitative or qualitative, inductive, or deductive. Instead, it is better understood as an exploratory research design about an under-researched social phenomenon (due to the lack of studies about everyday life uses of technology from this social group) from which hypotheses are difficult to draw.
Data come from an international project (see acknowledgments) that involved four teams, each one located in one of the analyzed countries. The research design, developed by authors author B and C, lead to the co-creation and validation of the instruments by all the teams who also translated them into the respective local languages (Fernández-Ardèvol et al., 2019). The study involved older adults between the ages of 55 and 79 years (mean age = 63.88; n = 430) living in one of the four countries selected who are regular smartphone users (Table 1). All the participants were invited to inform the project through a panel of users. Participants received information from the project and signed the corresponding consent form. Each local research team obtained ethical clearance, meeting the requirements at each country level.
Sociodemographic Characteristics of the Sample by Country.

This article uses two primary datasets. The first dataset was gathered by passively tracking each participant’s Android smartphone for four consecutive weeks—February–July 2019. The software employed generates an activity log every time an app appears on the device’s screen, and these logs are taken as a proxy for use (Rosales & Fernández-Ardèvol, 2019b). The second dataset came from an online survey completed by the same participants and asked about sociodemographic data (Table 1).
Over the 4 weeks of tracking, participants’ smartphone app activity amounted to 918,216 valid logs from 3,617 apps. Following usual standards (Jung et al., 2014), we categorized most of these apps for analytical relevance, depending on their main purpose (Table 2). We choose the apps to categorize based on two numerical requirements: (a) at least 7% of users used the app; and (b) the categorized apps covered 85% of the total number of logs. As apps use may be different depending on the sociocultural context of the country, we used the same criteria to classify them across each country.
App Categories.

Note. SNS = social network sites.
After disregarding the apps that did not fulfill requirement (a), we carried out an iterative process to categorize those remaining. First, we took note of the tag that the developers had assigned to the apps in Google Play. Second, three researchers (led by the second author) revised the Google Play classification and reclassified the apps as needed until consensus was reached (three iterations). Two guiding criteria were set out for cases of ambiguity: apps had to be assigned (a) to the most specific category (e.g., WhatsApp remained a messaging app) or (b) to the category that best fit the app’s primary goal (e.g., LinkedIn was redefined as a SNS). The final step involved validating the classification with other team members in each country.
The above-described process assured rigor and reliability. We identified 14 mutually exclusive categories that together included 437 apps (12.1% of the total) and accounted for 829,051 logs (90.2% of the total) (Table 2). They are displayed in order of relevance, based on the percentage of logs they account for (right-most column), our analytical goals and previous literature (Jung et al., 2014).
Finally, two categories were removed from this list before our empirical analysis: System and Tools. End users do not intentionally engage with system apps such as launchers, which justifies our decision not to consider their logs as conscious use. Meanwhile, Tools is a residual label that groups together apps not included in other categories, so, it makes no sense to interpret its meaning.
To analyze the app categories that participants use, we relied on a cluster analysis to summarize the 12 considered dimensions (or categories). The selected method was a hierarchical cluster method that classified the cases by means of a partitioning around medoids (PAM) algorithm, which is appropriate for highly disperse observations—as it is the case when tracked logs are analyzed (Filaire, 2018). The cluster analysis was run on RStudio while other analyses were run on SPSS. The advantage of this analytical approach is that the emergent clusters are defined by each group of participants’ own app use and frequency of use, rather than being taken from a set of activities previously defined by researchers.
The results of our analyses may have been distorted by the media ecology in which participants rely on their everyday life, which may have an impact on their smartphone use. Caution should also be exercised when interpreting these results because of possible selection and data collection bias (i.e., all participants in all countries had attained an above-average level of education and owned an Android device).
Results
The analyses revealed similarities and differences in app use among the participants around two dimensions: percentage of participants using a given app category (app use from now on) and frequency of use -measured as the average number of logs per day in that app category. The results suggest varying sociodemographic-driven patterns of use and non-use within each country, as well as differences among the four countries.
In the sections that follow, first, we describe app use and frequency of use among all participants. Second, we compare both dimensions across all four countries, focusing on any emerging differences. Following this, we present the results of a hierarchical cluster analysis. Finally, we consider the clusters in each country against the aforementioned traditional axes of digital inequality.
Smartphone Use by Country
According to the cross-country comparative analysis, smartphone apps for making calls and sending messages are the most popular overall. In fact, Phone & messaging apps are used by almost 100% of the sample, with no cross-country differences in the use of these apps. In terms of frequency of use, Phone & messaging apps are by far the most frequently used as well. However, some differences can be observed across the four countries. Participants in Canada and Spain use apps in this category more frequently than those in the Netherlands, and significantly more than those in Sweden. The daily averages for the four countries are 30.05, 29.33, 24, and 19.96, respectively (Table 3).
App Use and Frequency of Use Among Participants by Category and Country.
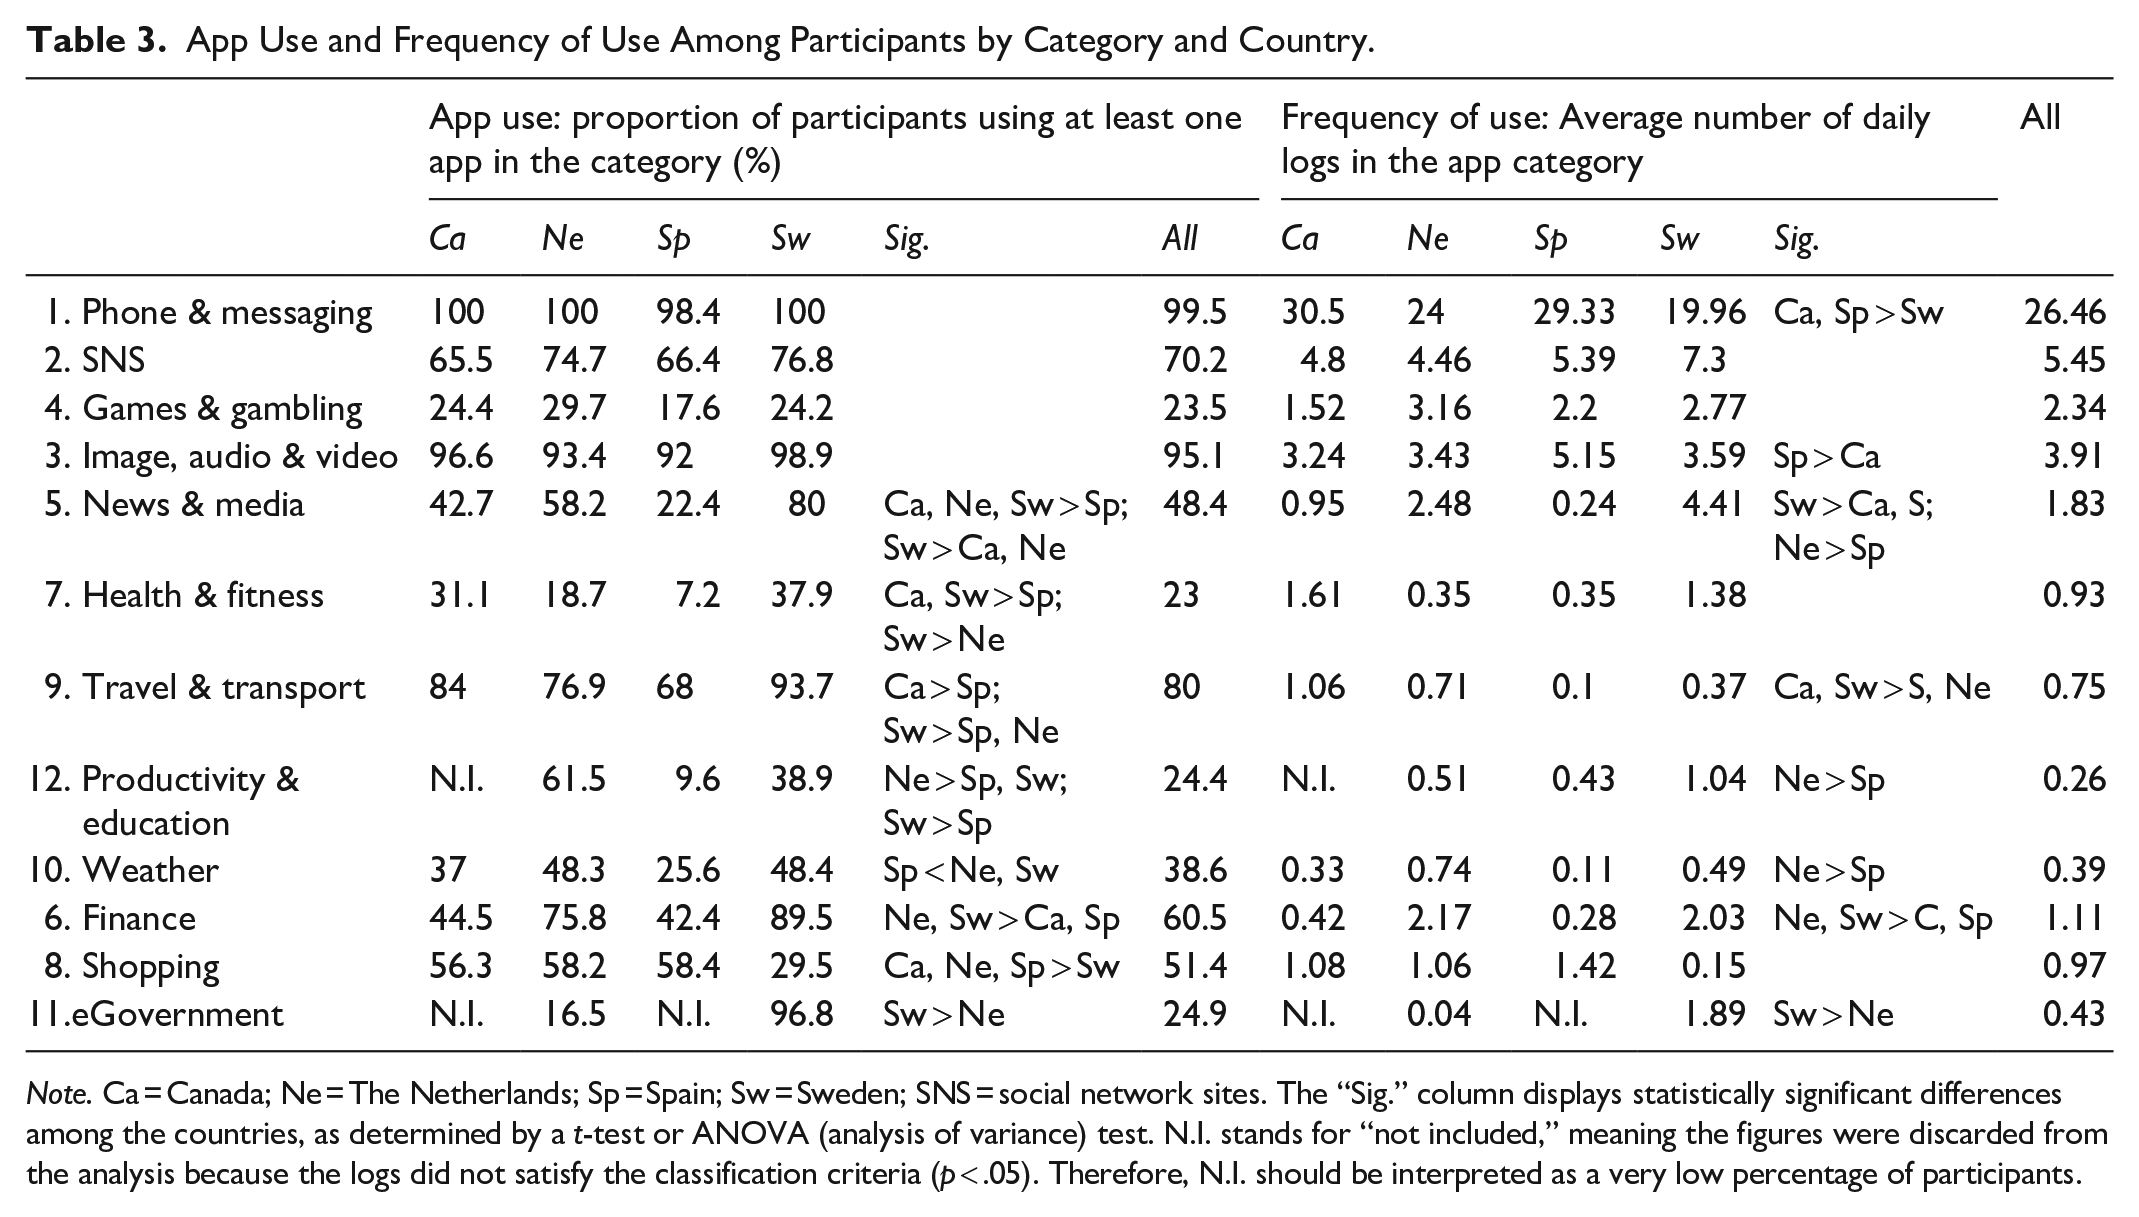
Note. Ca = Canada; Ne = The Netherlands; Sp = Spain; Sw = Sweden; SNS = social network sites. The “Sig.” column displays statistically significant differences among the countries, as determined by a t-test or ANOVA (analysis of variance) test. N.I. stands for “not included,” meaning the figures were discarded from the analysis because the logs did not satisfy the classification criteria (p < .05). Therefore, N.I. should be interpreted as a very low percentage of participants.
Engaging with multimedia content seems to be another main activity undertaken by the participants. Apps in the Image, audio & video category are used by over 90% of the sample in every country, and there are no significant cross-country differences in this respect. Regarding the average number of daily logs, Spain stands out from the other countries with 5.15. Those who do use these apps do so at a higher frequency than the participants in the other three countries. Another similarity among the four countries is the proportion of participants using Games & gambling and SNS apps; no differences are observed in either of the indicators. Furthermore, SNS apps are used frequently in all four countries.
The countries also show several differences in terms of app use, with certain app categories proving more, or less, popular. Most remarkably, Sweden displays a much higher proportion of participants using News & media apps (80%) when compared with Canada and the Netherlands, while Spain’s use is significantly lower, at 22.4%. The Weather category follows a similar pattern, proving less popular in Spain than in the other three countries. It is also worth noting that Finance apps are used by a higher proportion of participants in Sweden (89.5%) and the Netherlands (75.8%) than in Canada (44.5%) and Spain (42.4%).
Another difference concerns the use of Productivity & education apps. In this category, the Netherlands (61.5%) shows a significantly higher proportion of participants than Spain (9.6%) and Sweden (38.9%), which in turn also displays a significantly higher proportion than Spain. There is also a significant difference between the Netherlands and Spain in terms of frequency of use. Canada is not included in the analyzed dataset due to the low proportion of users and daily logs in the category. Regarding eGovernment apps, the proportion of users among the participants is extremely high in Sweden (96.8%) and significantly different from the other country with data, the Netherlands (16.5%). The same holds for frequency of use in this category. This is plausibly because Sweden’s entire population needs to have a digital identification for banking and government services, hence the use of this app is generalized among the Swedish participants.
Looking at the average number of app categories used by country, it is worth noting that participants in Sweden and the Netherlands make use of apps in more categories (9.1 and 8.1, respectively) than in Canada (6.8) and Spain (6.1). This is suggestive of more diverse app use. Although Spanish participants tend to use their smartphones more frequently (122 average logs per day) than in the other countries, the range of apps they use is more limited. Participants from the Netherlands appear to use their smartphones less frequently (86.5 average logs per day), while Canada and Sweden fall in the middle (105 and 102, respectively).
Our analysis shows that some smartphone practices transcend national contexts and are broadly adopted by older adult smartphone users (e.g., Phone & messaging, SNS and Image, audio & video). However, there are categories that differ greatly among the four countries both in terms of use and frequency of use (e.g., News & media, Weather and eGovernment) being indicative of contextual sociocultures of smartphone use affected, for instance, by national policies. The following section explores these differences within each country.
Cluster Analysis
Considering previous findings, we further analyzed the cross-country similarities and differences and link them to users’ sociodemographic characteristics. We conducted a hierarchical cluster analysis for each country to group the participants based on their similarities. The clusters depended on two factors: (1) the actual structure of the observed phenomena—in this case the daily smartphone logs (Table 2), and (2) the methodological decisions concerning the number of clusters. We considered the silhouette test and the size of the resulting cluster to define the optimal number of clusters in each country. Table 4 gathers the clusters’ key characteristics.
Clusters by Country, App Categories and Significant Sociodemographic Characteristics.

Note. Size: number of participants in the cluster and proportion of the total country sample; Diversity: average number of app categories used; Logs: average daily logs generated by all participants in the cluster; Categories: categories that define the cluster; Sociodemographic characteristics: traits for which the country clusters show a significant difference; SNS = social network sites.
Significant differences between country clusters (p < .05).
Each cluster is interpreted according to the activities of its members and deemed more diverse or less diverse. More diverse clusters contain participants in them that engage with a higher number of app categories and use apps more frequently. Less diverse clusters comprise participants who use apps in fewer categories and tend to generate a smaller number of daily logs. As a crucial part of this analysis, we consider the sociodemographic characteristics that are statistically significant for each cluster. This grants a better understanding of who the participants are and what differences emerge with respect to the traditional axes of inequality (e.g., gender or level of education). Finally, after displaying the clusters for each country, we look at the proportion of users and the average daily logs in each app category for each cluster and test for statistically significant differences among them (Tables 5 to 8).
App Use and Frequency of Use, by Category, Among Participants in the Canadian Clusters.

Note. CC = Canadian clusters. The clusters are numbered according to size, from largest to smallest; Sig. part.: indicates existing significant differences (and its direction) in the proportion of participants using at least one app in the category, based on Fisher’s exact test (p < .05); Sig. logs: indicates existing significant differences in average daily logs (and its direction) between clusters, based on the Kruskal–Wallis test (p < .05); SNS = social network sites.
App Use and Frequency of Use, by Category, Among Participants in the Dutch Clusters.
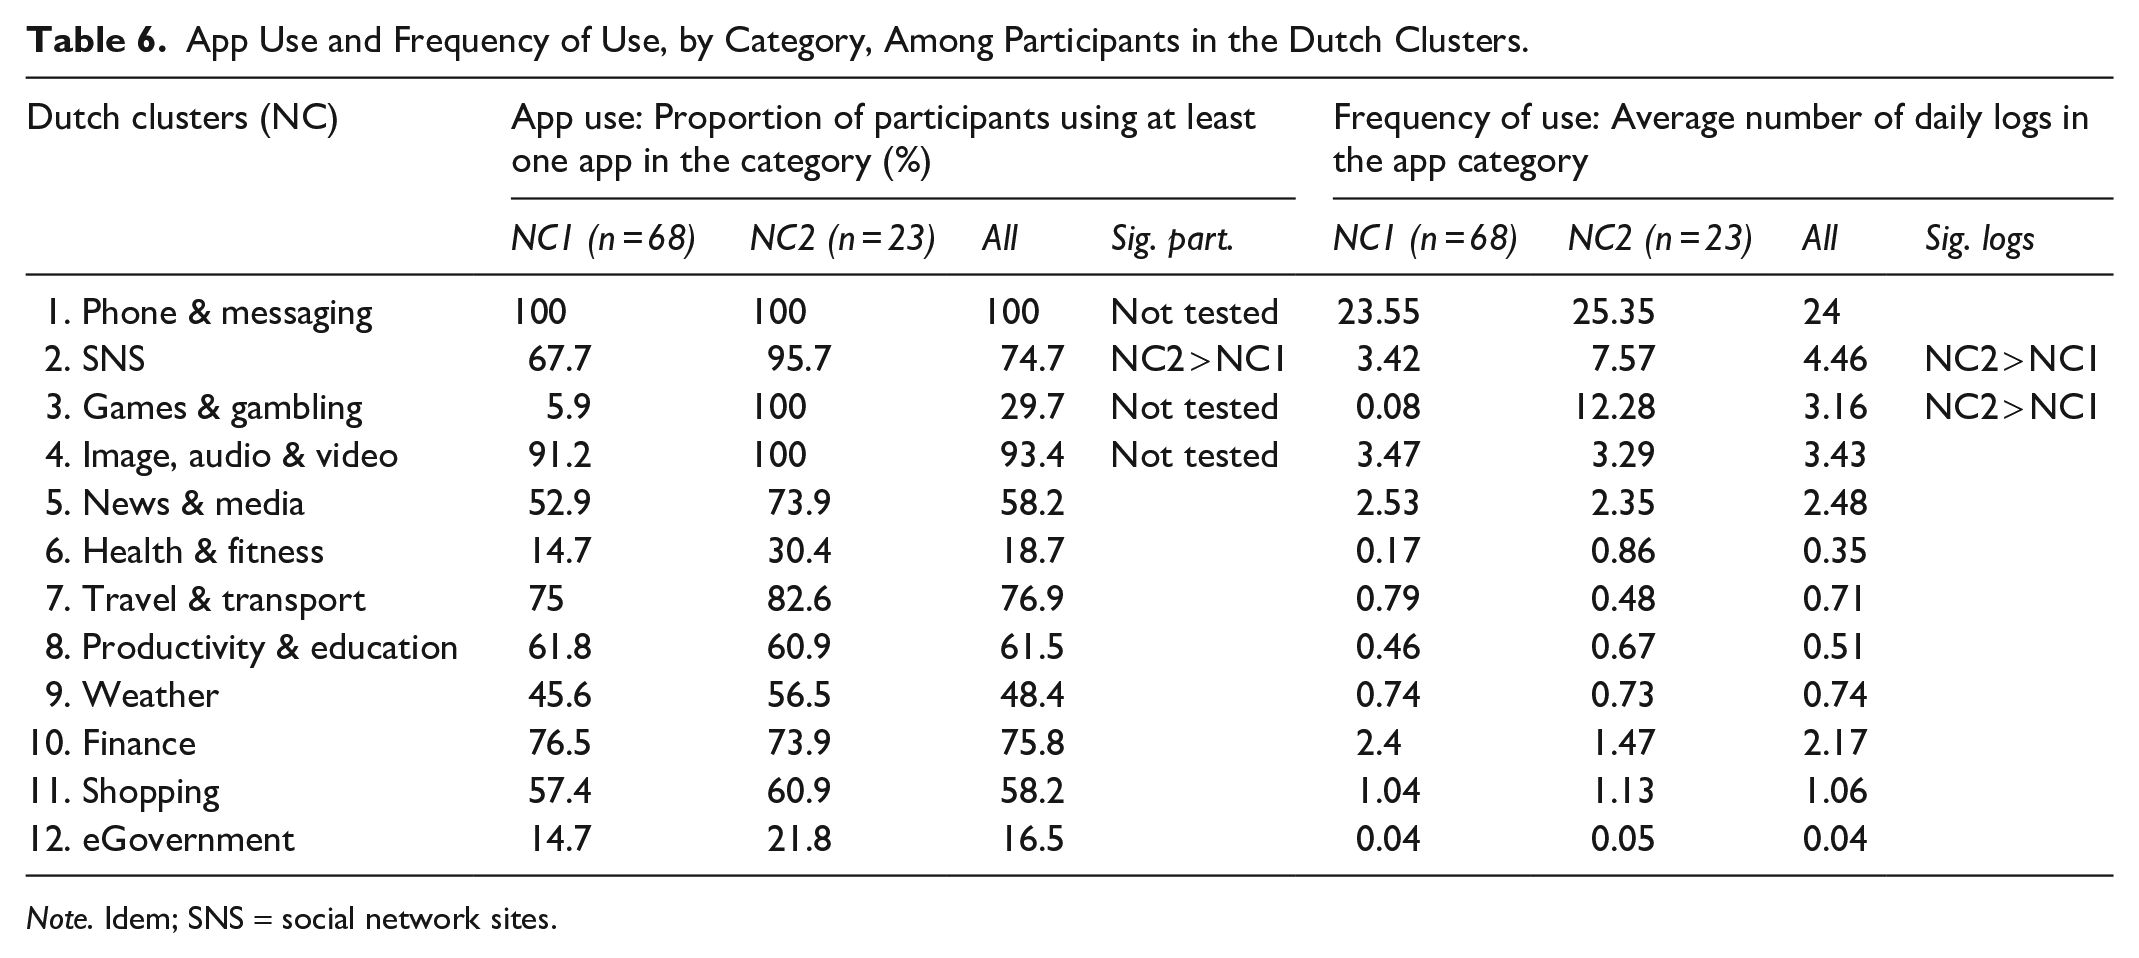
Note. Idem; SNS = social network sites.
App Use and Frequency of Use, by Category, Among Participants in the Spanish Clusters.
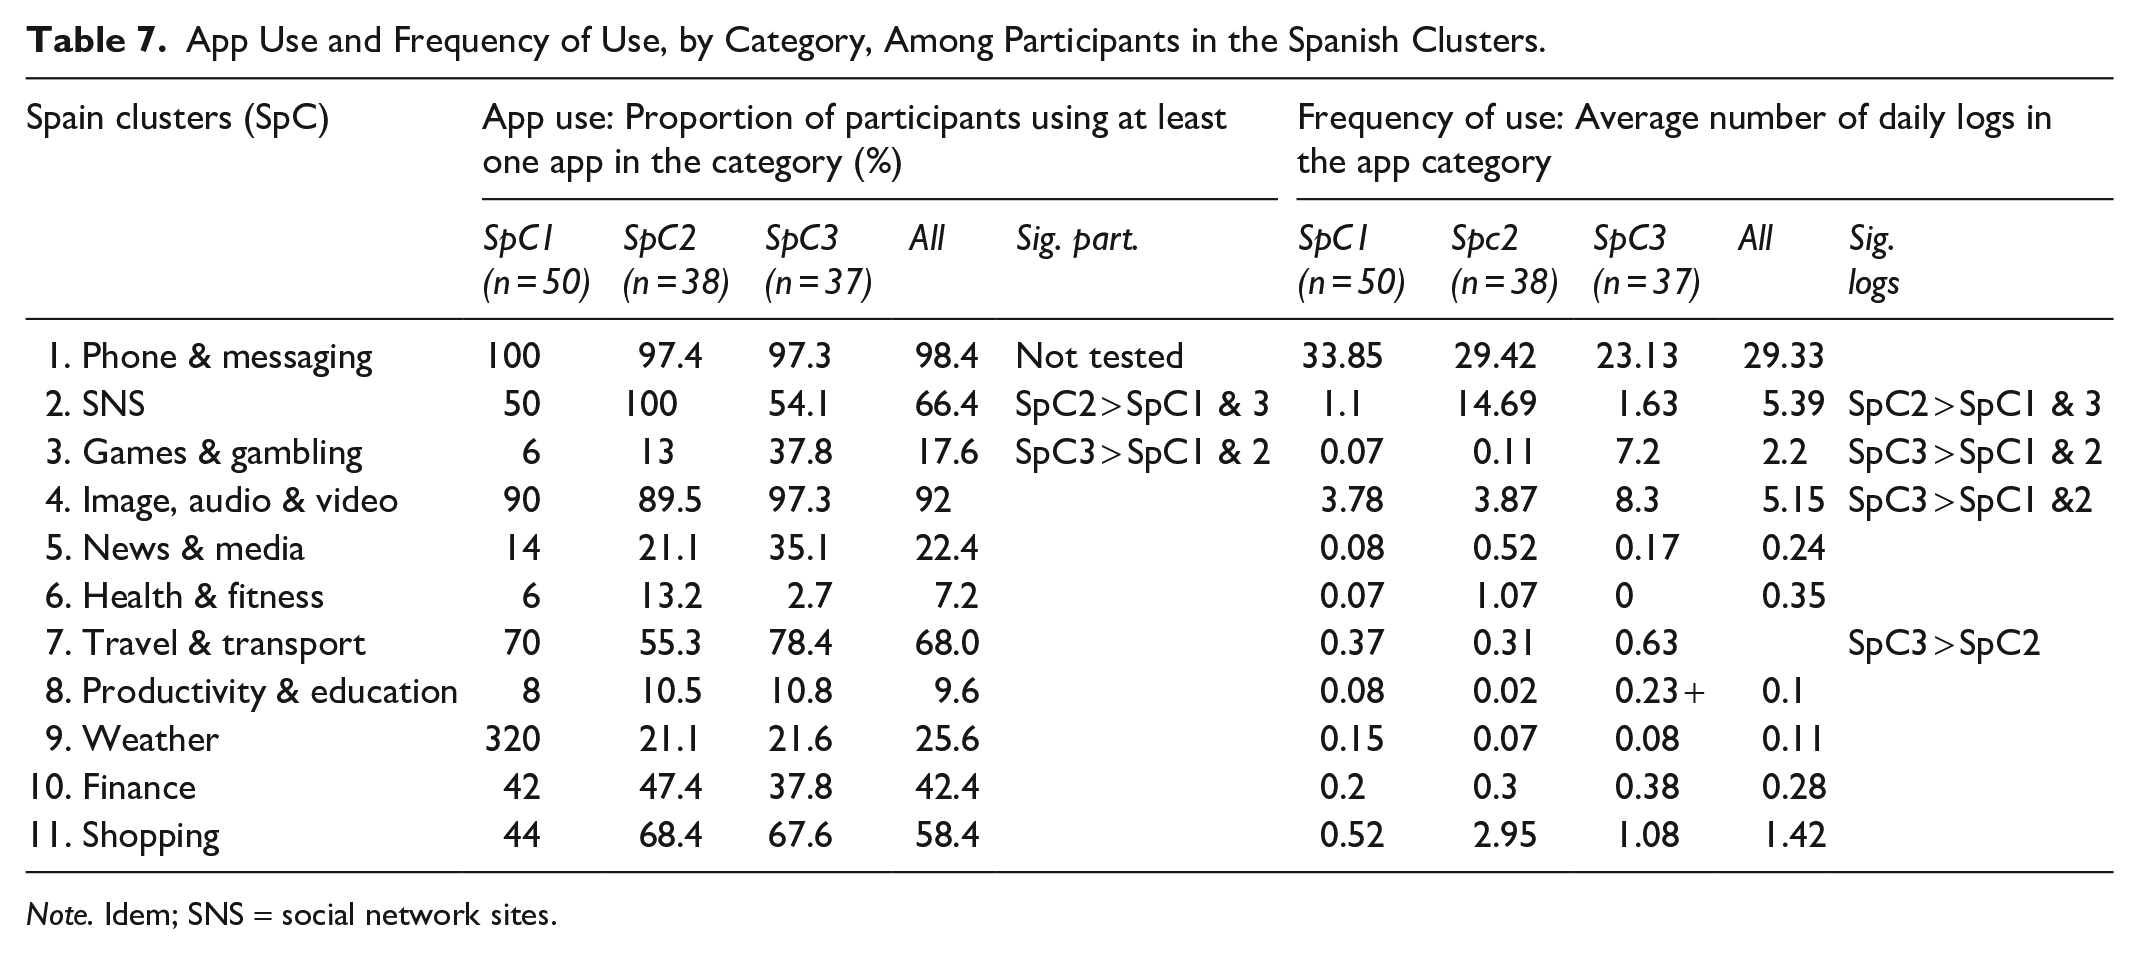
Note. Idem; SNS = social network sites.
App Use and Frequency of Use, by Category, Among Participants in the Swedish Clusters.

Note. Idem; SNS = social network sites.
In the sections that follow, we briefly describe and compare the clusters within each country. We provide details about statistically significant differences in the proportion of participants using the app categories, frequency of use and sociodemographic characteristics (p < .05). We do not address age-related differences because they were not significant in any of the countries, which is an interesting finding that we will discuss later.
Canada
We identified two clusters, CC1 (n = 71) and CC2 (n = 48). The second, CC2, gathers individuals with more diverse usages who rely more frequently on SNS and Finance apps (Table 5). The clusters’ sociodemographic characteristics show significant differences in terms of educational level (Table 4). Participants with a lower level of education (up to secondary education) display a more diverse use of apps (CC2). The opposite holds for those with a higher level of education (CC1), who use their smartphones for less diverse purposes.
The Netherlands
The two Dutch clusters we identified are well-balanced, although NC1 is much larger (n = 68) than NC2 (n = 28). All participants in NC2 use Games & gambling apps at a significantly higher frequency than those in NC1, similarly as they do with SNS (Table 6). In line with this result, NC2 also displays a more diversified use of apps than NC1 (9.6 > 7.63, see Table 4). An analysis of the clusters’ sociodemographic characteristics revealed significant differences in terms of gender. Specifically, there are more men in NC1 and more women in NC2 (Table 4).
Spain
Results suggested three clusters as the best solution. The biggest cluster is SpC1 (n = 50), followed by SpC2 (n = 38) and SpC3 (n = 37). Participants clustered in SpC2 use more frequently SNS, SpC3 use more frequently Games and Gambling, while SpC1 use less frequently both categories. There are also statistically significant differences with Image, audio, and video, Travel & transport and Shopping app categories, either in terms of app use, frequency of use, or both (Table 7). SpC3 gathers more participants who use Games & gambling, Image, audio & video and Travel & transport apps more frequently than their counterparts in the other two clusters. Meanwhile, SpC2 displays a significantly higher number of average daily logs than the other two clusters in the SNS category. Interestingly, eGovernment apps were barely used in Spain, which is why this category is not included in Table 7.
There are significant differences among the clusters in terms of gender and household size (Table 4). There are more women in SpC2 and more men in SpC1, while SpC3 contains more men and participants who live with others. Differences between clusters regarding education cannot be found.
Sweden
We identified three clusters. SwC1 (n = 52) is the largest, while SwC2 (n = 23) and SwC3 (n = 20) are similar in size. SwC3 displays significantly more frequent app use overall, as well as for SNS and Games & gambling apps in particular (see Table 8). Proportionally, SwC3 also gathers significantly more participants who use Games & gambling apps and Shopping apps. SwC1 shows significantly more frequent app use in the Image, audio & video and News & media categories. Finally, SwC2 gathers users who generated less logs overall and a user a lower average number of app categories (lower diversity). There are significant sociodemographic differences among the clusters with respect to gender and level of education (Table 4). There are more men in SwC2 and SwC3 and more women in SwC1. Regarding educational attainment, participants having attained up to secondary education have a stronger presence in SwC1, while the other two clusters contain more participants with post-secondary education.
Discussion and Conclusion
More and more, older adults are using smartphones, and questions about whether the traditional axes of inequality are related to this age group’s smartphone use remains to be fully answered. The analysis presented is a step in this direction. The results do not only reveal differences in app use among participants within each country, but they also shed light on what relationship these differences have with certain sociodemographic factors. In turn, the results are suggestive of contextual sociocultures of smartphone use, which should be considered in policy programs to tackle digital inequalities. The implications of these findings are important because policies have mainly focused on individual sociodemographic variables (Dutton & Reisdorf, 2019) that situate older adults as a disadvantaged group because of their age, while this study shows that there is much more to consider, to the point that age may become irrelevant within smartphone users.
First, we discuss and answer the question about the extent to which traditional digital inequalities (age, gender, educational attainment, household size and employment status) are related to smartphone use among older adults.
We did not observe any age-related differences in the diversity or frequency of app use (see Table 4), as age does not discriminate in the clustering process. This is a crucial finding, as it suggests that within our participants, smartphone use is not explained by age but by other sociocultural factors. We achieve such a result by focusing the research on a given chronological age period that involves individuals with 25 years of age difference (55–79 y.o.). Previous research has identified differences in digital activity across age cohorts, even within the broad “older adults” category. Such comparisons have suggested that older adults between 55 and 63 years of age use email and search for general information more frequently than those between 64 and 72 years of age (Jones & Fox, 2009). Thus, unlike previous research (Hunsaker & Hargittai, 2018), we do not believe that age shapes smartphone use among older adults.
Looking at gender, we find differences among clusters in all countries except Canada (Table 4). In the three countries where these differences do occur, the Netherlands, Spain and Sweden, there are clusters with proportionally more female participants that stand out for their use of SNS apps, Tables 6 to 8). In the Netherlands, NC2 has significantly more women and stands out for its use of Games & gambling apps. In Spain, the same goes for SpC2 with Shopping apps and in Sweden, for SwC1 with News & media apps. The difference in SNS app use in the Netherlands, Spain and Sweden is in line with previous literature, which has found that women are more interested in engaging in social interaction (van Deursen & Helsper, 2015). This rule is not set in stone, however. The Canadian clusters show no gender-related differences and Sweden’s SwC3 contains more men and, together with SwC1, is characterized by more SNS use than the third cluster.
Although participants’ educational attainment appears to be a significant determiner of smartphone use in some cases—as seen in Canada and Sweden—the results are inconclusive. In Canada, CC1 has more participants with post-graduate education, while CC2 is defined by a lower level of educational attainment (Table 4). Nevertheless, the latter cluster uses more SNS apps and displays more diverse smartphone use than the former. A plausible explanation is that people with post-graduate education fulfill their needs through other media or devices (even off-line), while individuals from lower socioeconomic backgrounds are more likely to depend on their smartphone as their only way onto the internet and contact others. This is at odds with previous theories suggesting that lower educational attainment negatively affects internet use (e.g., Hunsaker & Hargittai, 2018), although the results are relevant to understand that differences might be reduced when the analysis is conducted only among internet users. Sweden provides an even more thought-provoking example. SwC1 and SwC3 both contain participants with higher levels of education, yet SwC1 shows a more diverse and frequent use of smartphones than SwC3. Our study suggests that previous findings regarding educational attainment should be reviewed. There may be a shift challenging the idea that more digital connection is better for later life. Further research is needed to explain these observed differences.
Regarding household size, living with others is only significant in one country (SpC3). Contrary to previous research that states that not living alone improves people’s chances of using the internet for a broader array of purposes (e.g., van Deursen & Helsper, 2015).
Similarly, not being active in the labor market is only relevant in one cluster in Sweden (SwC2), whose participants are not particularly frequent or diverse app users. This is in line with previous research suggesting that retirement is associated with lags in internet adoption and use (e.g., Pautasso et al., 2011). However, stronger evidence is needed to confidently claim that retirement is associated with less diverse and less frequent use of smartphone apps.
Second, we address the question about the extent of country differences. Our analysis revealed differences in the diversity of app use across the four countries, with Sweden and the Netherlands showing more diverse use than Spain and Canada. With no previous research on country-specific differences in smartphone practices, we suggest that certain practices are tied to sociocultural contexts and country policies. The clearest evidence of this lies in the use of eGovernment apps, which is all but non-existent in Spain and Canada. We wonder if a country’s policies may have a knock-on effect on the use of other apps. In Sweden, where everyone needs to have a digital identification, the three clusters display highly diverse smartphone use. Moreover, it is home to the cluster with the highest diversity index (10.3) and the highest average daily logs (147.2). Another result clearly suggestive of the effects of sociocultural factors is the significantly low use of Weather apps in Spain.
In line with previous research, this study adds to the evidence showing that older adults’ digital activities and engagements change alongside the kinds of digital practices available and their sociocultural contexts (Bol et al., 2018; Büchi & Hargittai, 2022; Caliandro et al., 2021; Dutton & Reisdorf, 2019; Rosales & Fernández-Ardèvol, 2019a). It shows that smartphone use among older adults is diverse and differs in three ways. First, it differs across the traditional axes of inequality (mainly gender and level of educational attainment), but not as clearly as previous research suggests. Interestingly, there are no age-related differences among the clusters. Further research comparing older adults with younger cohorts is needed to enlighten this matter. Second, smartphone use differs by country and sociocultural context, suggesting that the backdrop against which digital practices take place may have a role in the observed differences and commonalities. Our research points to differences that cannot be explained solely by sociodemographic factors, but plausibly by national policies and culture as well.
Older adults engage in a range of different activities on their smartphones. This exposes the limits of any approach focusing on one particular social outcome (social connectedness, health, entertainment, civil engagement, etc.), as their smartphone use is diverse. In short, by providing a detailed picture of older adults’ smartphone use, we advance the research on digital inequalities, laying the foundations for future hypotheses about why differences arise in specific sociocultural contexts.
Further research may broaden the sample and countries, as this study is limited to the analysis of smartphone activities of 430 participants, aged 55–79 years, from four different countries, in their Android devices and recruited through an online marketing study panel. Such sample represents the market limitations to study older audiences. However, it is considered a good proxy to approach this population. Likewise, we recognize that there are forms of digital inequalities that cannot be captured by studying a single device or technology.
To conclude, knowing who uses the smartphones and how is important because these uses have potential implications for important life outcomes, as shown in previous research (van Deursen & Helsper, 2015). This study incorporates a comparative perspective for unpicking emerging inequalities related to sociocultural contexts. Conducting research into emerging forms of inequality is critical (i.e., related to smartphone use), as anything else risks reinforcing rather than mitigating existing social inequalities. This is especially important considering the ever-present risk of new inequalities and the ongoing revisiting of policies to mitigate them. This, whether existing or new, are not natural facts but rather cumulative, intersectional realities situated in particular sociocultural contexts.
Footnotes
Acknowledgements
This article and the research behind it would not have been possible without the exceptional data management and statistical support of Francisca Morey Cortes. We would like to thank Dr Adam Edwards and the referees for helpful comments and suggestions on earlier versions of this article. Any remaining errors are ours.
Declaration of Conflicting Interests
The author(s) declared no potential conflicts of interest with respect to the research, authorship, and/or publication of this article.
Funding
The author(s) disclosed receipt of the following financial support for the research, authorship, and/or publication of this article: 3rd Joint Programming Initiative “More Years, Better Lives”: Ageing and place in a digitizing world x PCIN-2017-080.