
Abstract
On a daily basis, individuals between 12 and 25 years of age engage with their mobile devices for many hours. Social Media Use (SMU) has important implications for the social life of younger individuals in particular. However, measuring SMU and its effects often poses challenges to researchers. In this exploratory study, we focus on some of these challenges, by addressing how plurality in the measurement and age-specific characteristics of SMU can influence its relationship with measures of subjective mental health (MH). We conducted a survey among a nationally representative sample of Dutch adolescents and young adults (N = 3,669). Using these data, we show that measures of SMU show little similarity with each other, and that age-group differences underlie SMU. Similar to the small associations previously shown in social media-effects research, we also find some evidence that greater SMU associates to drops and to increases in MH. Albeit nuanced, associations between SMU and MH were found to be characterized by both linear and quadratic functions. These findings bear implications for the level of association between different measures of SMU and its theorized relationship with other dependent variables of interest in media-effects research.
In the Netherlands, 94.4% of individuals between 12 and 24 years of age engage daily with a number of different social media platforms using their mobile devices (Centraal Bureau voor de Statistiek [CBS], 2019). Online behavior on such platforms is a popular topic of investigation among scholars, as such social media use (hereafter referred to as SMU) has important implications for the social life and mental health (hereafter referred to as MH) of particularly younger individuals (Beyens et al., 2020; Crone & Konijn, 2018; Ellison et al., 2007; Gerson et al., 2017; Meier & Gray, 2014; Valkenburg et al., 2006; Vannucci et al., 2017). However, measuring SMU and its effects on MH (or any other dependent variable) often poses challenges to researchers.
Despite the plethora of studies on how children, adolescents, and young adults use social media, results do not always align, triggering a debate about the existence and nature of social media effects (Chang et al., 2015; Foster & Jackson, 2019; Orben et al., 2019; Twenge & Campbell, 2018). It has been argued that part of this variance in findings can be explained by three distinct aspects: (1) how scholars operationalize SMU and dependent variables of interest (Dienlin & Johannes, 2020; Foster & Jackson, 2019; Meier & Reinecke, 2020; Sigerson & Cheng, 2018; Twenge & Farley, 2021), (2) how well different measures of SMU capture actual behavior and correlate with each other (Johannes et al., 2020; Meier & Reinecke, 2020; Scharkow, 2019), and (3) individual differences such as age and gender (Beyens et al., 2020; Twenge & Farley, 2021; Vannucci & Ohannessian, 2019). Depending on the measures used to tackle engagement with social media (e.g., screen time, number of followers or platforms), on specific platform features (followers on Instagram, or retweets on Twitter), and on developmental characteristics during early and later adolescence, a very different picture about the relation of SMU and other variables of interest can arise (Bij de Vaate et al., 2020; Dienlin & Johannes, 2020; Twenge & Farley, 2021). This may lead to assumptions researchers often adopt in studying SMU and consequently to misreporting actual effects (Foster & Jackson, 2019; Vannucci & Ohannessian, 2019).
In the current study, we draw from the literature on social media and psychological mental health and we use data from a nationally representative sample of Dutch adolescent and young adult smartphone users to investigate: (1) how the plurality of measures of SMU relate to each other, (2) how age differences reflect on the plurality of SMU, and (3) in what way measures of SMU relate to the commonly used concept of MH. We define SMU as the dynamic interaction with content and other users in online applications (i.e., platforms). In alignment with the rationale from Meier and Reinecke (2020) who propose a taxonomy of SMU and MH measurement, our study puts next to each other a diversity of SMU measurement items, including channel-centered (e.g., diversity of social media platforms, number of followers) and communication-centered (e.g., time spent on social media) measures, but also implicit user-centered measures that may lay in between the channel and the communication process (e.g., the cool ratio, and the number of friends who are common both online and offline).
Plurality in the Measurement of Social Media Use and Mental Health
Findings on the relationship between social media use and mental health are inconsistent. We propose three most important sources of this inconsistency, namely (1) the different operationalization of social media use, (2) the different operationalization of mental health, (3) differences in data collection methods, and (4) difference in the choices of statistical analyses. To date, there is little consensus on what is the most precise way to measure SMU while no single inventory has been identified as a satisfactory measure of this multifaceted construct (McCann & Barlow, 2015; Mieczkowski et al., 2020; Rozgonjuk et al., 2020; Sigerson & Cheng, 2018). In this paper, we focus on understanding plurality in the measurement of SMU, as we argue this is necessary to capture the magnitude of relationships with MH. As such, we offer a descriptive account of both channel- and communication-based measures of SMU, between adolescents and young adults.
Operationalization of Social Media Use
In the last decade, changes in mobile technologies have critically facilitated SMU. As a result, the research field has shifted its focus to the effects of social media on mental health in particular. Prior reviews or meta-analyses on either problematic SMU or more descriptive and non-pathological forms of SMU report primarily small, negative relationships between SMU and MH (Appel et al., 2020; Baker & Algorta, 2016; Best et al., 2014; Çikrıkci, 2016; Elhai et al., 2017; Glover & Fritsch, 2018; Huang, 2010, 2017; Keles et al., 2020; Liu et al., 2019; Marino et al., 2018; Orben & Przybylski, 2019; Richards et al., 2015; Rozgonjuk et al., 2020; Sarmiento et al., 2020; Seabrook et al., 2016; Yoon et al., 2019). Most of those meta-analyses yield small, negative correlation coefficients, but these vary depending on specific concepts and inclusion criteria, ranging from −.33 (Yoon et al., 2019, for SMU upward social comparison and Ivie et al., 2020, for depression) to .14 (Liu et al., 2019, for SMU interaction and mental health). However, in our view, this prior body of work has serious limitations. The measures of problematic SMU often lack construct validity and may produce inflated effect sizes. For example, scales of problematic SMU often entail “negative outcomes” as a diagnostic criterion and may prime respondents to reporting negative effects (e.g., Mieczkowski et al., 2020; Shaw et al., 2020). Purely descriptive measures of SMU, on the other hand, can be equally problematic because depending on the scope of the researcher, the same variable (e.g., the objective number of followers) can be used as a proxy for popularity or anxiety (cf. Barry et al., 2017). More recently, meta-analytic and systematic reviews that make distinctions between problematic forms of SMU (e.g., pathological use, or use driven by specific motivations) and broader measures of SMU (e.g., screen time) find that the broader measures of SMU show relationships with MH that are small to non-existent (Appel et al., 2020; Keles et al., 2020; Meier & Reinecke, 2020; Orben, 2020; Orben & Przybylski, 2019; Parry et al., 2020). Despite these minimal overall effect sizes, clinical work consistently emphasizes the importance of both positive and negative effects of SMU, especially for users with lower life satisfaction or higher stress levels, as these individuals exhibit frequent SMU and seem to be more influenced by it (Heffer et al., 2019; Marino et al., 2018; Naslund et al., 2016; Nesi & Prinstein, 2018).
The Channel-Centered Approach
Different operationalizations of SMU can result in extreme differences regarding the association between SMU and MH (e.g., Bij de Vaate et al., 2020; Dienlin & Johannes, 2020; Orben & Przybylski, 2019; Twenge & Farley, 2021). In operationalizing SMU, we can differentiate two approaches: the channel-centered and the communication-centered approach. Thus far, scholars examining the link between SMU and MH primarily rely on the construct of “screen time” spent (daily) on social media (cf. Appel et al., 2020; Huang, 2017; Valkenburg et al., 2006; Vannucci et al., 2017; Vannucci & Ohannessian, 2019). This so-called channel-approach primarily focuses on the use of that channel, without further specifying the communication behaviors and activities within that channel (Carr & Hayes, 2015; Ledbetter, 2014; Meier et al., 2016; cf. Meier & Reinecke, 2020). While these measures of screen time are already more precise than studying, for example, use of devices such as smartphones, another practice lies within specifying the use of several branded applications (cf. Meier & Reinecke, 2020). As a next step to measuring general SMU time, researchers further distinguish between the various applications, such as Facebook or Instagram (Kaye et al., 2020; Meier & Gray, 2014; Orben & Przybylski, 2019; Weinstein, 2018).
The most detailed level of the channel-centered approach would consist of unique features that individuals engage with on different platforms such as Facebook and Instagram. This is because SMU is characterized by a range of behaviors such as liking, posting, sharing, following, reacting, commenting, and consuming media-related content via a networking service (Bayer et al., 2020; Jenkins-Guarnieri et al., 2013). Most of these measures are related to the technological aspects of a specific platform that enable social media users to interact with content from other users (Bucher & Helmond, 2018; Elhai et al., 2017; Moreno & D’Angelo, 2019; Moreno & Uhls, 2019; Waterloo et al., 2018). Depending on the platform’s specific affordances, different indicators of SMU may be available or not.
Communication-Centered Approach
Other studies emphasize the possible communication and the message exchange processes (i.e., the communication-centered approach). SMU studies taking a communication-centered approach often distinguish between active or passive forms of SMU. Active SMU refers to behaviors and activities that foster exchanges with others, and passive refers to completely non-interactive activities (cf. Escobar-Viera et al., 2018; Gerson et al., 2017; Thorisdottir et al., 2019; Verduyn et al., 2017). In this sense, more refined measures of time spent over dynamic engagement with specific social media activities can be additionally informative for the relation of SMU and MH.
Besides time, also other available social cues visible on social media platforms could potentially impact MH, such as the number of followers and followees (Ellison et al., 2007). The number of followers is a feature of Facebook or Instagram but not of Snapchat. Instagram further distinguishes between the number of followers from followees, providing additional information about the user’s online popularity. Taken further, the combination of technologically available social cues, can elicit additional cognitive processes with an impact on MH. Examples include the “cool ratio” (defined as a follower to following ratio) which indicates one’s popularity on social media (Crone & Konijn, 2018; Longobardi et al., 2020), or the number of online friends that are also shared in real life that indicates a measure of popularity shared between online and offline networks of friends. These socio-technological affordances may enable or impede individuals’ sociality and mental health in many ways, for example by fostering group belongingness (Lundby, 2011; Moreno & D’Angelo, 2019), by amplifying feelings of social recognition, and by generally enabling engagement with and management of meaningful social interactions (Bucher & Helmond, 2018; Elhai et al., 2017; Postigo, 2016; Wellman et al., 2003). In all, this approach takes a more user-centered perspective, where interactions with social media are central in explaining the relationship between SMU and MH.
Data Collection Methods: Objective Data Versus Self-Reports
Prior studies also show heterogeneity in their data collection methods. SMU can be tracked automatically through login data or it can be based on self-reports. Log data have been used to provide an “objective” and descriptive measure of SMU, arguably being less prone to recall bias. Indeed, prior reports have documented that on average, people tend to overestimate their smartphone use and especially SMU, by approximately 23 min (Deng et al., 2019). However, despite the well-documented inherent problems with user-centered operationalizations of SMU (Araujo et al., 2017; Parry et al., 2020), self-reported SMU still has the advantage of capturing the psychological-perceptual dimension of a user’s interaction with social media content, that is often not captured by more technology-centered measures (Meier & Reinecke, 2020). For example, researchers may choose self-reports to. capture specific types of interaction with social media, such as passive and active forms of SMU (Beyens et al., 2020; Gerson et al., 2017).
Operationalization of Mental Health
Mental health is a multifaceted concept often employed in studies of SMU, yet investigations differ in operationalizing this concept. Building on the rationale of a two-continua model of mental health (cf. Antaramian et al., 2010; Meier & Reinecke, 2020), we view MH as a state that is characterized both by the absence of factors contributing to ill-being (i.e., related to psychopathology or to other risk factors), and by the presence of factors that promote mental health (i.e., related to well-being and resilience mechanisms). Due to the concept’s long history in research, it is reasonable that there exist validated scales for measuring specific the psychopathology side of the two-continua model of MH and many researchers advocate the use of such scales (cf. Meier & Reinecke, 2020; Parry et al., 2020). Other researchers prefer more overarching measures, for example, focusing on beneficial or on problematic smartphone use (Camfield & Skevington, 2008; Diamantopoulos et al., 2012; Henry & Crawford, 2005; Rozgonjuk et al., 2020; Verduyn et al., 2017), even if these include single-item measures, as happiness, confidence, life-satisfaction, stress, anxiety, or sleep quality (Abdel-Khalek, 2006; Bevan et al., 2014; Beyens et al., 2020; Chou & Edge, 2012; Diener et al., 1985; Gross & John, 2003; Pallesen et al., 2008; Robins et al., 2001; Smith et al., 1999). As a consequence of different methodological choices there exists another source of variance in the findings regarding SMU and its relationship with MH, depending on whether one is looking at validated scales, broader constructs, or single items.
The Plurality of Analytical Choices
Research on SMU and MH often presumes linear associations between the two, meaning that changes in SMU and in MH occur simultaneously, leaving room for reciprocal relations. However, this assumption of linearity restrains analytical choices and may also account for the mixed findings reported in the literature. As can be concluded from various reviews and meta-analyses (e.g., see Heffer et al., 2019; Keles et al., 2020; Meier & Reinecke, 2020; Orben, 2020; Yoon et al., 2019), the relationship between SMU and MH is often (at least implicitly) assumed to be negative and linear. However, assumptions of unidirectional or non-linear relationships in social media effects research may have important implications for understanding between-subject variation of SMU (e.g., more passive versus active usage) and for interpreting its relation with MH (e.g., do different measures of SMU relate to MH in similar ways?). By contrast, a smaller number of investigations have scrutinized monotonic relationships between SMU and MH and have considered quadratic relations as well (Elhai, Tiamiyu, et al., 2018; Kim & Lee, 2011; Pittman & Reich, 2016; Przybylski & Weinstein, 2017; Weinstein, 2018). As these studies show, the impact of SMU on MH is not always negative, as demonstrated by drops in loneliness and increases in life-satisfaction (Baker & Algorta, 2016; Seabrook et al., 2016) and also not linear, as evident by negative curvilinear associations between the number of Facebook friends and perceived social support (Kim & Lee, 2011). Therefore, the phenomenological associations between SMU and MH may sometimes be better understood based on a quadratic function, indicating, for example, an inverse U-shaped relationship between the two (Kim & Lee, 2011; Pittman & Reich, 2016; Przybylski & Weinstein, 2017).
Age Differences in SMU
Adolescents and young adults can be particularly sensitive to information from meaningful social interactions (Beyens et al., 2020; Cole et al., 1994; Elhai, Hall, & Erwin, 2018; Hormes et al., 2014; Sherman et al., 2018; van der Meulen et al., 2017; Vannucci et al., 2017), and tend to use social media more often compared to older age groups (Allen et al., 2014). Contemporary work documents within- and between-person variation in SMU and MH between adolescents of 14 and 15 years or age (Beyens et al., 2020; Coyne et al., 2019; Vannucci & Ohannessian, 2019), as well as in young adult population samples (Escobar-Viera et al., 2018; Hardy & Castonguay, 2018; Kross et al., 2013). Critically, there exist significantly fewer investigations that have focused on the transition from adolescence to adulthood (see Heffer et al., 2019; Marino et al., 2018). Hence, to more accurately address this transition from the stage of adolescence to the stage of emerging adulthood, the present study focused on the relationships between SMU and MH in these particular two age groups.
A developmental perspective on age further underpins this choice for investigating social media use and mental health between adolescents (12–17 years) and young adults (aged 18–25 years). During the years of adolescence, youngsters undergo rapid emotional and psychophysiological shifts before transiting into the stage of (emerging) adulthood (Crone & Konijn, 2018; Gerwin et al., 2018; Valkenburg et al., 2006). Hormonal and anatomical alterations in the adolescent human brain can explain how young individuals value meaningful social relationships. For example, variability in the size of online and offline friendship networks is reflected in the gray matter within neocortical brain regions and processes by the amygdala (Kanai et al., 2012; Lewis et al., 2011). Moreover, during adolescence and young adulthood brain connections between frontal cortical areas and the mesolimbic system start to mature (Crone & Konijn, 2018). This is critical for how especially young adults adapt to, process and regulate new social rewards associated with the numerous changes in their social life (Elhai, Hall, & Erwin, 2018; Sherman et al., 2018; van der Meulen et al., 2017). This process continues during young adulthood and is known as emotion regulation (Cole et al., 1994; Ochsner & Gross, 2008). Also, during this period humans learn to inhibit or initiate socially (in)appropriate behaviors, a process known as response inhibition (Chambers et al., 2009; Mostofsky & Simmonds, 2008). According to some scholars, problematic SMU during early adolescence may impede emotional regulation and inhibition processes, which form the basis of mental disorder in adulthood (Barlett & Helmstetter, 2018; Hormes et al., 2014; Lowry et al., 2016; Murphy et al., 2017; Rozgonjuk & Elhai, 2021; Vannucci et al., 2017). According to others, however, SMU can contribute to the development of inhibitory control and emotion regulation, resulting in mental resilience, with positive effects on MH (Elhai, Hall, & Erwin, 2018; Hoffner & Lee, 2015; McKenna et al., 2002; Shapiro & Margolin, 2014; Taylor et al., 2012; Valkenburg et al., 2006).
Next to biological explanations, sociopsychological accounts explain differences in SMU between the developmental stages of adolescence and young adulthood. There exists some evidence that the range of social media contacts increases during adolescence (Brandtzaeg et al., 2010), while based on socio-emotional selectivity theory (Carstensen, 1992) it has been found that during adulthood social network size decreases with age (Chang et al., 2015). However, it is currently unknown if age differences in SMU already exist during adolescence and the transition to adulthood. Given that moving to adulthood is marked by important changes in one’s social life and leisure time, we logically expect variability in SMU to appear at the transition point from adolescence to young adulthood. Despite the vigorous research, we still know little about how the transition from adolescence to adulthood relates to measurements of SMU and MH. Combining a range of SMU and MH measures in a single study would make a valuable contribution to the existing literature of SMU and the mental health of adolescents and young adults. In all, reasoning from biological as well as sociopsychological explanations, the present study expects to identify similarities and differences in how adolescents and young adults use social media and in how they perceive their MH.
Current Study
Despite its relevance, differences in SMU measurement during adolescence and young adulthood have been little covered in the literature so far (Beyens et al., 2020; Heffer et al., 2019; Marino et al., 2018; Vannucci & Ohannessian, 2019). The present study was designed to add to this growing body of studies, by addressing measurement plurality and differences between stages of age in SMU. To provide an exploratory investigation of the important question related to the plurality of SMU measures and concepts of MH, our study defines SMU as the dynamic interaction with content and other users in online applications that enable this interaction. Moreover, we view MH as a state characteristic, described both by the absence of factors contributing to ill-being and by the presence of factors that promote MH. We rely on a user-centered operationalization of SMU via self-reports. This strategy allows us to observe how subjective beliefs about SMU relate to MH.
In this study, we were first interested in variation across different measures of SMU and how these measures relate to each other. Based on the literature introduced, we expected correlations between the different measures of SMU we have employed in our study to be low (i.e., r < .25), reflecting different facets of SMU. Given the biological and sociopsychological changes that adolescents go through during transition to adolescence, we were also interested in SMU differences between adolescence and young adulthood. Increasing time spent on social media over adolescence has been previously demonstrated (Coyne et al., 2019; Orben & Przybylski, 2019), and because of this we had expected increasing SMU time across adolescence and young adulthood. Moreover, in line with earlier reports about the increasing size of social media network during adolescence (Brandtzaeg et al., 2010), we expected the size of social media network to increase over adolescence and young adulthood. In line with the idea introduced above that the transition to adulthood is marked by important biological and sociopsychological changes, we also expected differences in SMU between adolescents and young adults, with adolescents reporting higher levels of SMU.
Last, we were interested in testing a variety of SMU and MH measures in conjunction, to facilitate a critical comparison between different measures of SMU and MH as a two-sided model that captures both well-being and ill-being factors. To date, the majority of the literature suggests small (and mainly negative) effects of screen time on MH (correlation coefficients between ±.02 and ±.26). As such, we also expected small and negative effects between SMU and MH, at least for the measurement of SMU time. However, we did not expect negative associations for predictors with a social component, namely the number of followers, followees, and the cool ratio. Last, our study takes the position that at least some of the relations between SMU and MH can be best described by a quadratic function.
Method
Participants and Study Design
We draw data from a three-wave weekly panel survey, followed a month later by a fourth wave, between January and March 2018 (data collection was conducted via the research company Motivaction (https://www.motivaction.nl/en). To offer a descriptive insight on SMU among Dutch adolescents and young-adults, and to avoid attrition bias and increase power, this study focused on responses from wave 1 (n = 3,669); our future papers are set to test dynamics of SMU and a number of other dependent variables over time. Table S1 (appended supplementary material) provides an overview of sample size and demographic differences across time due to attrition (waves 1–4), per age category of adolescents and young adults.
The study sample was representative of Dutch adolescents (n = 1,974, Mage = 14.9, SDage = 1.6, minage = 12, maxage = 17, 32.2% females) and young adults (n = 1,695, Mage = 21.8, SDage = 2.4, minage = 18, maxage = 25, 67.8% females). The education level of the respondents ranged between lower (according to the Dutch secondary school system MAVO = 9.6%, MBO = 17.7%), middle (MAVO = 9.6%, MBO = 17.7%), and high (HAVO/VWO = 29.6%, HBO = 18%, WO = 12.2%).
All measurement items (see below) were presented in randomly ordered blocks, and within each block all corresponding items were randomized as well. The study complied with the ethical standards described in the 1964 Declaration of Helsinki and was approved by the Institutional Ethical Review Board. Active consent was received from adolescents’ parents and the adult respondents for all data collected. Note that all procedures and broader study scope, including preregistered main research questions, all variables used, datafiles, code, criteria for data exclusion, preprocessing and replacement, tables with descriptive results, as well as documentation for understanding all these files are publicly available via Open Science Framework (link here).
Measures
As the main purpose was to illustrate how the different measures of SMU may affect an important outcome variable often mentioned in the literature, SMU was measured on the basis of a selection of self-reported items often reported in the literature (See Table 1; for more detail see supplement in EOSC). As most of the existing research on SMU relies on single-items measures, the current study-choices reflect standard methodological practices in the field.
Measures of SMU Included in the Current Study.
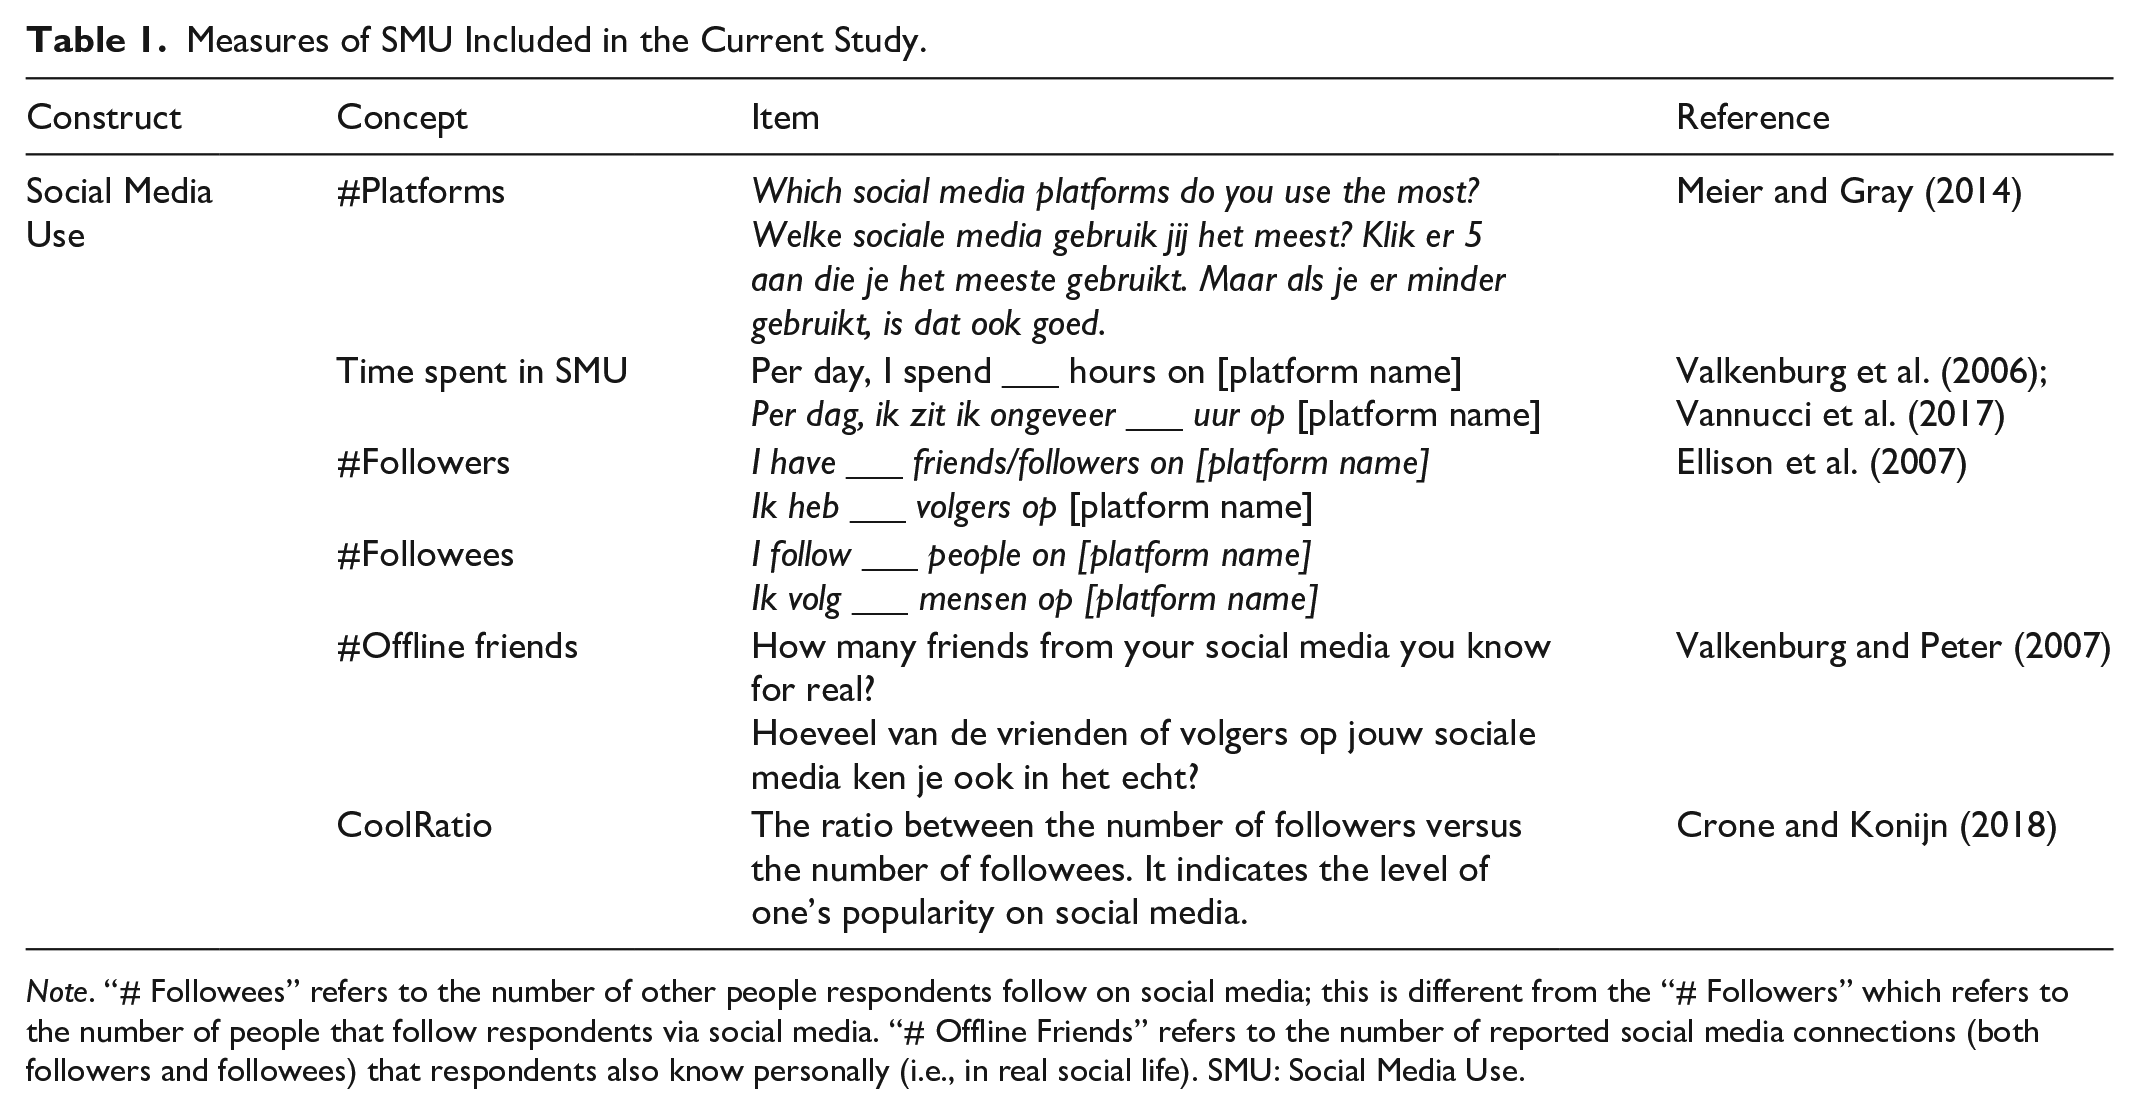
Note. “# Followees” refers to the number of other people respondents follow on social media; this is different from the “# Followers” which refers to the number of people that follow respondents via social media. “# Offline Friends” refers to the number of reported social media connections (both followers and followees) that respondents also know personally (i.e., in real social life). SMU: Social Media Use.
In this paper, we drew on one overarching measure for MH, seen as a two-side model characterized by both the absence of ill-being and the presence of well-being factors (Antaramian et al., 2010; Meier & Reinecke, 2020); see Table 2 (for more detail see supplement in OSF). Following this two-continua typology, we operationalize MH as a set of two latent constructs (or factors), namely well-being and ill-being. Because of our MH definition as a state characteristic, we specifically refrained from including single-items related to psychopathology as these relate to underlying processes that operate over longer periods (Keles et al., 2020). In our study, we used six items to measure MH as we theoretically expected that happiness, confidence, and life-satisfaction capture well factors related to resilience and well-being, while stress, panic and sleep-quality reflect risk factors related to ill-being (and the possible development of psychopathology thereafter). As no former study has used this broad set of items before in the context of SMU, we first ran an exploratory factor analysis to identify the latent relational structure of the items used to capture MH. Using the parallel function from the R package “Psych,” we identified a two-factor model, based on eigenvalues and the point of inflation criterion. All factor loadings of the model were greater than 0.6 and achieved simple structure, indicating that a two-factor model for conceptualizing overall MH was indeed appropriate. The root mean square of residuals (RMSR = 0.01), the root mean square error of approximation index (RMSEA = 0.032), and the Tuckler-Lewis Index (TLI = 0.991) suggest a fairly good model fit.
Mental Health (MH) Scale Characteristics.

Note. ritc = item-total correlation. N = 3,369. SD: standard deviation.
p < .001.
We then ran an analysis for assessing convergent and discriminant validity of our MH scale. The scale was then evaluated for and showed good reliability, with a Cronbach’s α value of .788. The item-to-total correlations all significant at the .001 level, ranging from .642 to .721. In general, participants scored higher on items related to well-being (M = 3.52, SD = 0.84, Med = 3.67, SE = 0.01), relative to ill-being (M = 2.48, SD = 0.84, Med = 2.5, SE = 0.01). We report descriptive and reliability statistics, as well as characteristics of the MH scale in Table 2. Correlational information between single-items can be found in Figure 1.
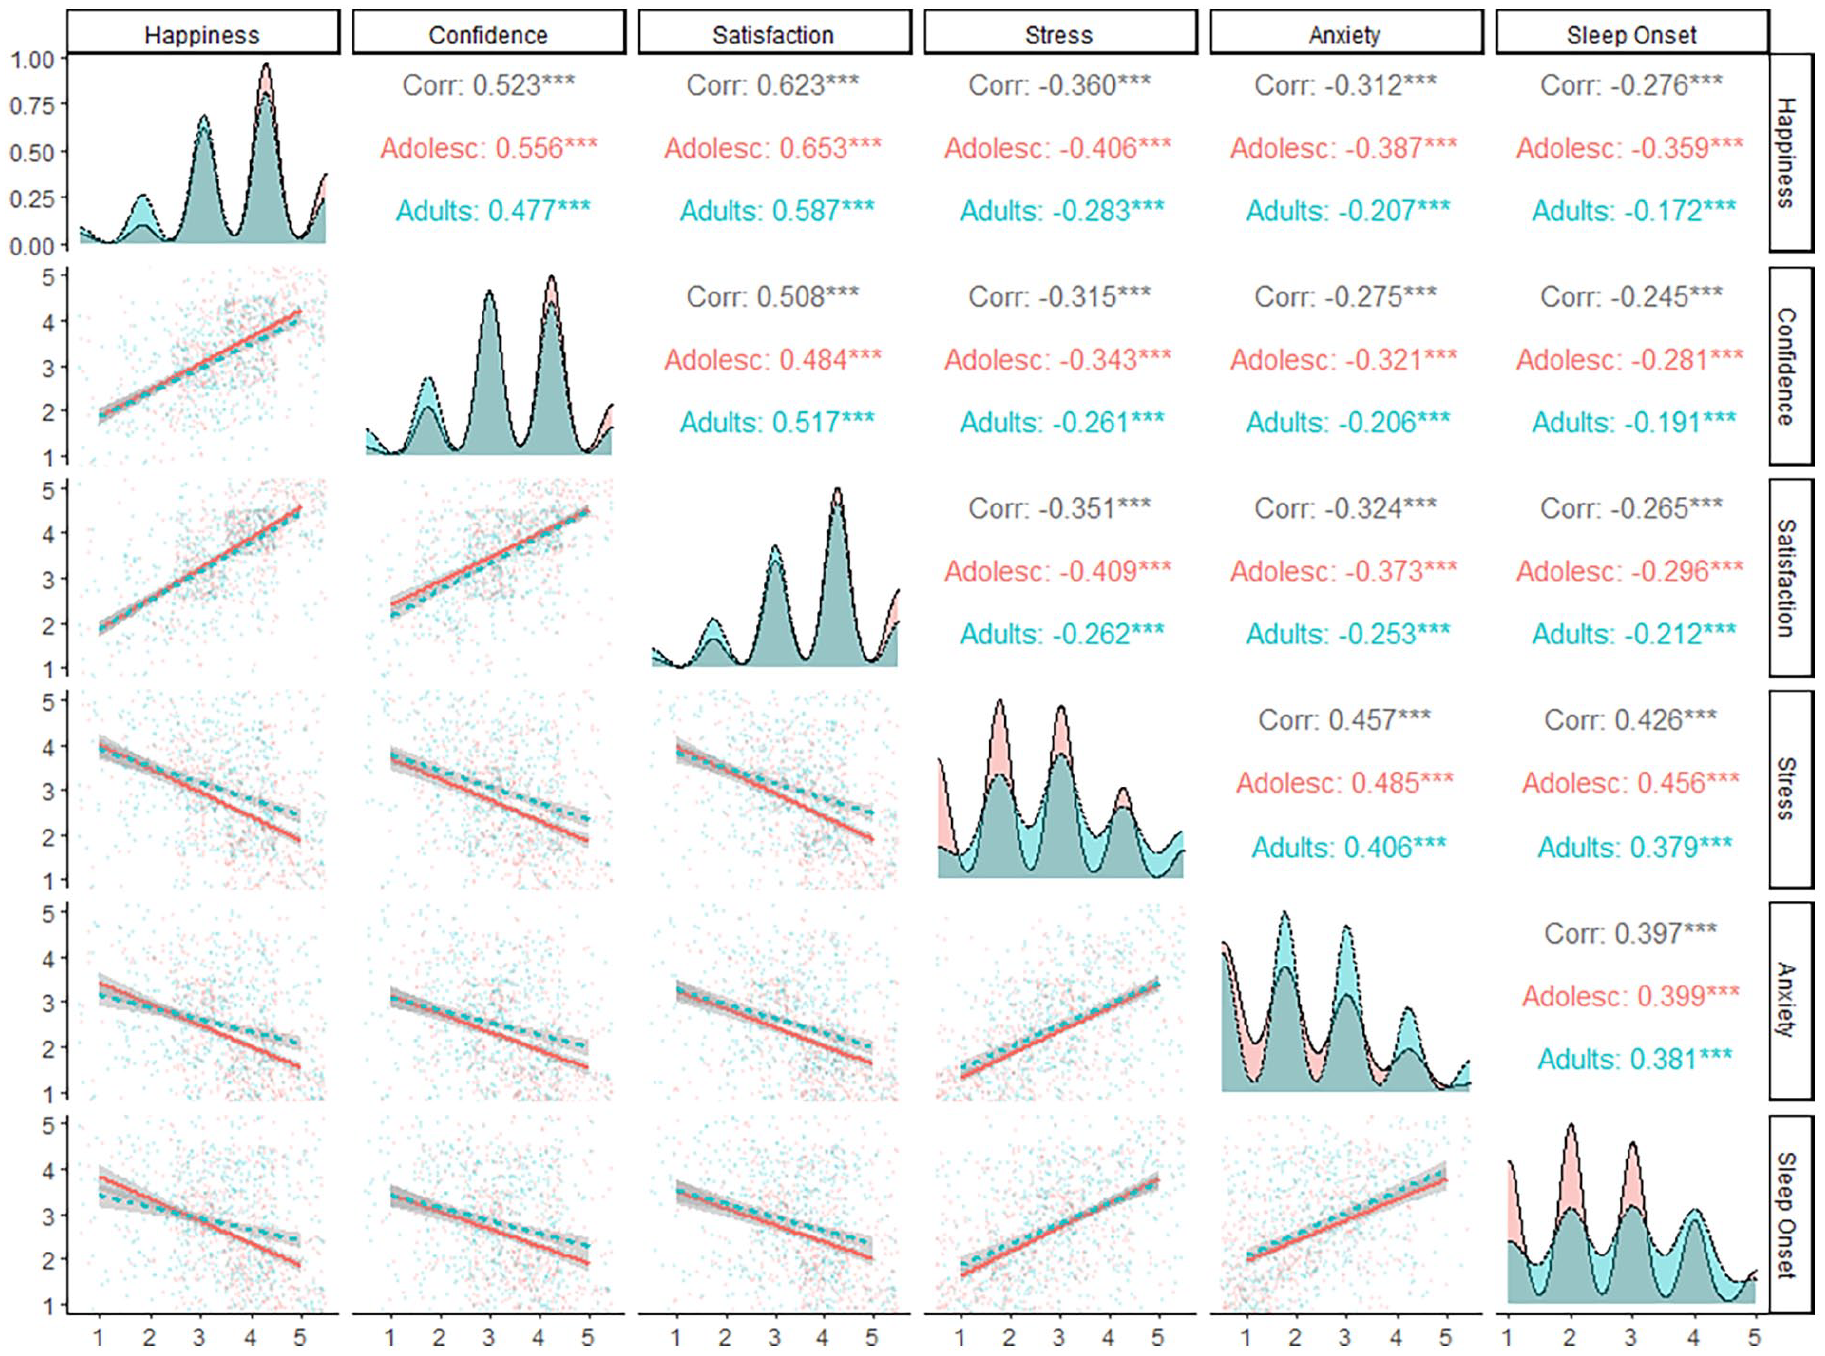
Relation between measures of psychological mental health, for adolescents (1: red) and for young adults (2: dashed and blue), as shown by correlation slopes (lower triangle), density plots (diagonally), and r coefficient values (upper triangle). All p values were significant at the .001 (***) level. All measures were at a 5-point scale. N = 3,669.
Analysis Strategy
All statistical analyses were conducted in R version 3.3.0 (R Core Team, 2013). We report descriptive statistics (n = 3,669) on SMU and MH, per age category.
For Time spent on social media, we recoded the self-reports from hh: mm to min, up to and including the value of 24 (or 1440 min), as we have assumed that there exist individuals who are continuously logged on their social media accounts and are “available” at a 24/7 basis. For Number of followers, followees and on/offline friends, some extreme values appeared as statistical outliers and were detected on the basis of visual assessment of boxplots and the Median Absolute Deviation (MAD) criterion as described in Leys et al., (2013). Concerning these, we applied a cutoff point at 5,000 on the basis of descriptive statistics reported elsewhere (see Lenhart et al., 2015). Note that recoding of these observations did not change the statistical significance outcome of the tests reported.
Subsequently, we ran a zero-order correlational analysis between measures of SMU, and per age group. For simple correlations, we consider effects sizes|r| in the range of 0.10 – 0.24 as small yet not trivial (see Abelson, 1985; Bosco et al., 2015; Funder & Ozer, 2019; Weber & Popova, 2012) and we interpret as “significant” differences at the .001 level, given the large sample size and the attitudinal nature of variables used in the survey. For age group comparisons, we used (non-parametric) Wilcoxon-Mann Whitney t-tests to account for data skewness and uneven number of cells in each case. At all cases, (p) values are reported when < .05; and we use asterisks to denote significant levels at .05 (*), .01 (**) and .001 (***) levels in all tables and figures.
Linear regression was used to model the relationship between MH (response variable) and measures of SMU (explanatory variables) across the two age groups. Modeled measures of SMU were not correlated (all VIF values < 10, see Mansfield & Helms, 1982). To account for non-linear relationships, we also added a quadratic term for each of the modeled SMU attributes. Stepwise model simplification using the “mass” package (Venables & Ripley, 2013) was performed, to identify the best model-fit and quantify the relative importance (i.e., the proportion of model variation explained by each coefficient) of each measure of SMU that turned out significant. Thus, we report the results of a best-fitting multiple linear regression model, showing how the different measures of SMU relate to our overarching measure of MH, per age group.
Results
Descriptive Statistics
On average, participants (n = 3,669) used 3.5 different platforms (SE = .02, Med = 4, min = 1, max = 5), with Facebook, Instagram, Snapchat, and YouTube scoring the highest in popularity (see Figure 2). In total, respondents spent on average 92.9 min per day on social media (Med = 88, SE = .67, min = 16, max = 247). Table 3 provides descriptive statistics for time spent on popular social media platforms per age category; these numbers suggest there exist differences in time spent between platforms, with respondents reporting more time on SnapChat, YouTube, Facebook, and Instagram (in that order).

(a) Linear (straight-line) and quadratic (dotted-line) relations between age (ranging from 12 to 25 years on the x-axis) and measures of SMU (y-axis). Notes. Gray dots represent individual data points. Beta values denote standardized coefficients for the linear trend and asterisks denote alpha-level of significance. Shadowing represents 95% CI. (b) Age-group-related differences in measures of SMU. Notes.
Time Spent Daily on Most Popular Social Media Platforms per Age Group.

Note. All values represent time in minutes. The category Other refers to the mean time spent online across the eight least popular platforms that were included in the survey. SE: standard error.
p-value at .001 level.
In response to the question “how many followers do you have,” 25 cases (0.7%) appeared as extreme (> 3 SD units from mean) and were removed from the data; the reported differences did not change as a result of data exclusion. Participants (n = 3,644) reported having on average 173.31 followers across all platforms (SE = 4.79, Med = 109.5, min = 0, max = 4,456.2). Table S2 (appendix) provides descriptive statistics on the number of followers that respondents reported having on the most popular social media platforms and per age category. It is noteworthy that younger users report more followers for Instagram, SnapChat, Facebook, and YouTube (in that order). By contrast, young adults report more followers for Facebook first, then for Instagram, SnapChat, and YouTube.
We also asked participants how many of their online friends/connections they also knew from their real social life. Two cases (0.054%) appeared as extreme (i.e., > 5,000 friends) and were removed from the data. Removing these observations did not affect the analysis outcomes. Respondents (n = 3,667) reported having on average 94.3 friends in real life (SE = 2.19, Med = 62.4, min = 0, max = 4,737) who they also connect with online.
Next, we looked at the number of followees across all platforms. Removing 169 cases (4.8%) that appeared as extreme (i.e., > 5,000 followees) did not influence the analysis outcomes. Participants (n = 3,500) reported on average 122.47 people (SE = 3.26, Med = 73.33, min = 0, max = 3,777) they follow on social media. Although adolescents report more followees for SnapChat or YouTube as compared to Facebook, young adults report more followees for Instagram (see Table 3, appended).
Last, we looked at the “Cool Ratio” across the three most popular platforms that offer information both on the number of followers a user has and on the number of other people a user follows (i.e., Instagram, Snapchat, and YouTube). For this item, we removed 235 observations (6.4%) on the basis of 3 SD units from the mean, yet this did not influence the analysis outcomes. Participants (n = 3,434) had an average CoolRatio score of 1.03 (SE = .03, Med = .71, min = 0, max = 20), meaning that for every 100 followers they followed, 98 other people followed them back.
Relationship Between Different SMU Measures
In line with our first study goal, we explored variation across different measures of SMU and how these measures relate to each other. Therefore, we ran a correlation analysis between (1) the number of platforms users use, (2) the time they spent on average at each platform, (3) the number of followers, (4) the number of followees, (5) the Cool Ratio, and (6) the number of online friends/connections respondents also know offline. Based on Cohen’s (1992) guidelines, the mean correlation between different SMU measures was r = .306 (highest and lowest values at .624 and .002 respectively). Significant correlations at the .001 level were found between time spent on SMU and the number of reported platforms (r = .624), Cool Ratio and the number of reported platforms (r = .137), as well as between time spent on SMY and the Cool Ratio (r = .0.78). As expected, not all measures of SMU showed strong correlations with each other, suggesting little overlap between them (See Table S4 in the appendix).
Age Differences
The second study goal was to investigate differences in SMU between adolescents and young adults. In line with this goal, we first examined changes in SMU as a result of changes in the age of social media users (as a continuous variable). In all, we found significant increases in the number of platforms, time spent on screen, number of followers, and shared online/offline friends as a function of age, suggesting that individuals use more social media as they transit from adolescence to young adulthood. CoolRatio appeared to slightly decrease over years of age, however, indicating that younger individuals may be more popular in their social media. Moreover, some quadratic relationships with an inflection point at approximately 17–18 years of life were noted, suggesting that increases in SMU during adolescence are typically followed by a decrease in usage as individuals grow into adulthood (see Figure 2a).
Following, we checked how adolescents and young adults use social media using parametric (or non-parametric where appropriate) t-tests to investigate differences between the two age groups. In both age groups, there appears a strong and significant positive correlation between time spent on SMU and the number of platforms used. This suggests that engaging with more than one platform requires more time. A moderate, negative correlation between Cool Ratio and the number of platforms used was also found, suggesting that more popular users use somewhat fewer social media platforms. Interestingly, the relation between time spent on social media and the number of shared online and offline friends is positive for adolescents, while for young adults this appears as a negative relation; albeit small, this difference may suggest age differences in the motives for using social media. In all, correlation coefficients between the two groups suggest that measures of SMU relate little to each other. All age-related differences are discussed below and are visually presented in Figure 2b. Table 4 presents correlation coefficients for the relationship between the different measures of SMU, split by age group.
Correlations Between Different Measures of SMU per Age Group.

Note. SMU: Social Media Use. *denote alpha level of statistical significance at the .05 (*), .005 (**) and .001 (***) level.
Number of Platforms Used
Adolescents used on average more social media platforms (M = 3.27, Med = 3, SE = 0.03, min = 1, max = 5) than young adults (M = 3.87, Med = 4, SE = 0.03, min = 1, max = 5), a statistically significant difference as revealed using a Wilcoxon t-test, Z = 14.26, p < .001, r = .235.
Minutes Per Day Spent on Social Media
Next, we looked at age differences in time users spent on their social media. In all, younger adolescents spent less time on their social media (M = 87.4 min, SE = 0.81, Med = 83, min = 16, max = 231) compared to young adults (M = 99.3 h, SE = 1.07, Med = 94, min = 16, max = 247), a statistically significant difference of 12 min, Z = 7.81, p < .001, r = .129.
Number of Followers and Followees
We also investigated age differences in the number of social media Followers and Followees. Adolescent respondents have less Followers (M = 133 followers, SE = 4.40, Med = 73.5, min = 0, max = 2,633) compared to young adults (M = 220 followers, SE = 8.90, Med = 146, min = 0, max = 4,656), a statistically significant difference based on a Wilcoxon t-test, Z = 17.56, p < .001, r = .291. In addition, adolescent respondents have less Followees (M = 123 connections, SE = 4.72, Med = 60, min = 0, max = 3,777) compared to young adults (M = 124 connections, SE = 4.41, Med = 84, min = 0, max = 3,500), a statistically significant difference based on a Wilcoxon t-test, Z = 4.75, p < .001, r = .080.
Shared On/Offline Friends
Adolescents reported having fewer shared friends (M = 68.10, SE = 3.27, Med = 35, min = 0, max = 4,737) compared to young adults (M = 125, SE = 2.65, Med = 100, min = 0, max = 2,000). Using a non-parametric t-test, we found this was a statistically significant difference, Z = 23.78, p < .001, r = .392.
CoolRatio
Adolescents had a mean CoolRatio of 1.93 (SE = 0.18, Mdn = 0.92, min = < .001, max = 148), which suggests that for every 100 people they followed on social media, 193 additional people followed them back. By contrast, young adults appeared having a CoolRatio of 0.91 (SE = 0.09, Mdn = 0.54, min = < .001, max = 100), suggesting that only 91 of the people they followed on their social media also followed them back. This difference in the CoolRatio was found to be significant using a Wilcoxon t-test (Z = 17.51, p < .001, r = .298), indicating that adolescents were more popular/influential compared to young adults.
Mental Health
Looking at differences in MH (i.e., both ill-being and well-being) we see that young adults scored less (M = 3.62, SE = 0.02, Med = 3.71, min = 1, max = 5) compared to adolescents (M = 3.40, SE = 0.02, Med = 3.43, min = 1, max = 5). The difference in MH was statistically significant as shown by Wilcoxon t-test (Z = 8.85, p < .001, r = .146). Therefore, our data indicate existing differences in MH between adolescents and young adults.
Social Media Use and Mental Health
Finally, in this paper, we investigated how different measures of SMU relate to MH. Given the differences we predicted and found in the measurement of SMU between adolescents and young adults, we sought a best-fitting linear regression model with multiple measures of SMU and age as explanatory variables and MH as the outcome variable. We initially modeled MH, as linearly predicted by all measures of SMU as well as by their interaction with age. To account for non-linear relationships, we added quadratic terms in the model accounting for every interaction term between measures of SMU and age. Using backward stepwise selection, we found evidence for a best-fitting model that included as predictors Age, the linear and quadratic terms for the number of Platforms, total time spent on social media (i.e., ScreenTime), the number of Followees and RealFriends (i.e., number of shared online and offline friends), as well as interaction terms between Followees, Followers, Platforms and Age. The selected model included some quadratic terms and performed better in predicting MH (Akaike Information Criterion = –2313.92, residual SE = .712), compared to a simple linear model (Akaike Information Criterion = –2295.95, residual SE = .714). There was no homoscedasticity detected (Breush-Pagan test showed a p > .05) and the data were fairly normally distributed based on visual inspection of regression diagnostics.
Results of this best-fitting polynomial multiple regression model indicated an overall significant association on MH, F(15, 3418) = 13.82, SE = .712, p < .001, R2(adj) = .053. This suggests a model that includes Age, Followees, RealFriends, Platforms, and ScreenTime as main predictors that can explain 5.3% of the variance associated with MH (response variable). These predictors in the selected model were further examined and revealed the presence of both linear and quadratic associations, as well as interactions with Age (Table 5). Specifically, the transition to adulthood was found to significantly reduce MH by .43 units on the 1–5 Likert-type scale (t = 7.03, p < .001) accounting for all other variables in the model, meaning that young adults scored half a point less in MH compared to adolescents. 1 We found small relationships with MH explained by the number of Platforms used (t = 2.69, p < .01, β = .289), the amount of time spent on social media (i.e., ScreenTime, t = –4.33, p < .001, β = –.359), the number of shared online/offline friends (i.e., Real Friends, t = 4.62, p < .001, β = .202), Followers (t = –2.13, p < .05, β = –.205), and Followees (t = –2.27, p < .05, β = –.102).
Measures of SMU Related to MH.

Note. R2 = .057, R2adj. = .053, F (15, 3418) = 13.82, p < .001. SE: standard error. *denote alpha level of statistical significance at the .05 (*), .005 (**) and .001 (***) level.
This pattern of results suggests that changes in SMU can predict small fluctuations in MH, in both directions. More specifically, the number of Platforms and RealFriends seem to relate with small increases, while ScreenTime and the number of Followers and Followees associate with decreases in MH.
In addition, we found evidence that the relationship between SMU measures and MH is not necessarily linear. Specifically, increases in the number of common online/offline friends were found to associate with increases in MH for large numbers only (i.e., RealFriends > 450). Finally, we found quadratic interactions between age-group and the number of Platforms (t = 2.70, p < .01, β = .125) and Followers (t = –2.63, p < .01, β = –.230), indicated by a concave function, whereby too few or too many Platforms or Followers can explain fluctuations in MH, and more so among adolescents compared to young adults. See Figure 3 for an overall visualization of these findings.

Linear (solid line) and quadratic (dotted line) slopes of the relation between SMU and MH. Note. N = 3,434. Asterisks on the plots’ titles denote alpha level of significance for individual predictors (main effect or interaction with age); asterisks inside plots indicate the alpha level for a quadratic trend. Shadowing represents 95% CI.
Discussion
The purpose of this paper has been threefold. The first goal was to demonstrate how diverse measures of SMU are and relate to each other, in order to show that different measures may reflect different aspects of online behavior. Second, our study intended to investigate whether there exists great variation in self-reported measures of both SMU and MH between adolescents and young adults. Third, the present study aimed at describing types of relations between SMU and MH, as some relations are best described by quadratic functions, as previously shown (Przybylski & Weinstein, 2017). These three goals add to our understanding of SMU among adolescence and emerging adulthood, by addressing the idea that diverse measures of SMU can draw a different picture of possible associations with MH.
Pertaining to our first study goal, we found small to moderate zero-order correlations between different measures of SMU. The number of Platforms was positively associated with time spent on screen, indicating that increasing engagement with social media content requires successively more time. Smaller negative correlations were noted, for instance that between the number of Platforms and CoolRatio. These are hard to interpret as the sample size of the current study was rather large and, as such, may reflect type II error. Future research may pursue these correlational findings further in order to describe how indices of popularity in social media (i.e., CoolRatio) relate to the number of different platforms individuals use. With regard to the aims of the present paper, the correlational findings provide support to our theoretical proposition that measures of SMU can differ greatly, and as such they capture different aspects of online behavior. The fact that we only detect weak correlations between SMU-measures fits within the picture of mixed results that we see in the literature (Appel et al., 2020; Baker & Algorta, 2016; Best et al., 2014; Çikrıkci, 2016; Elhai et al., 2017; Glover & Fritsch, 2018; Huang, 2010, 2017; Keles et al., 2020; Liu et al., 2019; Marino et al., 2018; Orben & Przybylski, 2019; Richards et al., 2015; Rozgonjuk et al., 2020; Sarmiento et al., 2020; Seabrook et al., 2016; Yoon et al., 2019).
Anaphoric to our second study goal, we showed that age can be an important determinant of SMU measurement, as we consistently found significant differences in all measures of SMU included in our survey. To summarize these findings, as individuals grow from adolescence to young adulthood, they use on average more social media platforms and spend more time per day on their social media. In addition, the network of shared online and offline friends increases. We also found differences between adolescents and young adults for all measures of SMU employed in our study. Notably, adolescents’ popularity (as indicated by the CoolRatio measure) drops by half as they transit to young adulthood, showing that for every one person they follow on their social media adolescents get two followers back, while young adults get on average one follower back. We also identified age differences in MH suggesting that adolescents score higher in overall MH compared to young adults. However, a priori differences in MH can be easily misattributed to SMU. For example, one could misinterpret the difference in MH to the observed decrease in popularity as adolescents shift to adulthood. Although age was found to be the most important predictor of MH in our model, here we did not test the causal relation and directionality of this relation.
The third study goal aimed at exploring the type of relations that exist between SMU and MH. Our study explored quadratic relationships between SMU and MH, in line with a few earlier reports in the literature (Kim & Lee, 2011; Pittman & Reich, 2016; Przybylski & Weinstein, 2017). Small yet significant associations between SMU and MH were noted, explained both by linear and by quadratic functions. Notably, time spent on social media was found to negatively predict MH, while a concave trend suggested this decrease becomes less steep after approximately 120 min of usage (inflection point at 119). This could indicate specific users at a more “professional” level (e.g., social media influencers). In addition, having a large number of shared online and offline friends positively contributed to a small increase in MH (inflection point at 625 friends). Smaller interactions between the quadratic term for the number of platforms or followers and the age category were also noted: although for adolescents a larger number of followers increased MH, in the young adult’s group MH was decreased.
A first take-home message is that different operationalizations of SMU relate loosely with each other. This may reflect differences in the level of analysis, as channel-based operationalizations of SMU depend on technological features, while communication-based measures of SMU tackle social aspects as well (Meier & Reinecke, 2020). Given that there is no best practice and that the field is saturated from single-item measures of SMU, at least a range of different measures should be included in studies of SMU in order to capture different facets of online behavior. Future investigations can make use of principal component analytical methods to identify how the plurality of SMU measures maps on the different levels of analysis described in this paper and elsewhere. Second, the current study findings strengthen the proposition that age should be considered an important moderating factor in media psychological research. Especially during adolescence and its transition to adulthood, critical processes for socializing with others and for regulating habitual media use begin to mature. As such, appropriate measurement of SMU depends on behavioral idiosyncrasies that vary with age, and grouping respondents on the basis of their transition from adolescence to adulthood seems justified from our data and from a developmental perspective. Although the age range of 12–23 years as a continuum is not unusual in research (Vannucci & Ohannessian, 2019), creating age categories can help with understanding differential relationships of SMU and MH between younger and older participants. Taken together, our study findings fit the idea of both problematic and beneficial effects of and accentuate the need to closely examine monotonic, unidirectional, linear, and quadratic associations in SMU research (Elhai, Tiamiyu, et al., 2018; Kim & Lee, 2011; Pittman & Reich, 2016; Przybylski & Weinstein, 2017; Weinstein, 2018).
Limitations and Future Directions
Like many studies in this field, the current study depended on self-reports. This has its shortcomings which are well documented in the literature (Araujo et al., 2017; Keles et al., 2020; Meier & Reinecke, 2020; Parry et al., 2020). A consequence of using self-reports is that respondents do not always have mental access to how they act, and as such, they are unable to verbally indicate how they actually use their social media. Implications for our study findings may relate to the degree of precision of SMU measures and, therefore, a study interested in response precision should avoid employing self-reports and should depend on analytics and user data from the device to measure SMU. However, this was not the core goal of this paper. Here, we intended to show that there exists variation in what respondents think they do (rather than what they actually do) and that this variation can be used to explain variation in the response variable (in our case MH). The low median and minimum (as well as the high maximal) values reported from our data indicate that some individuals use social media much more or far less from the average person included in our sample, in support of our idea that there exists considerable variation in SMU (Beyens et al., 2020). As such, we are confident that our findings speak to this story and that regardless of any imprecision in measuring SMU, responses can greatly vary during early and late adolescence.
Following a two-continua typology (cf. Antaramian et al., 2010; Meier & Reinecke, 2020), in this investigation, we operationalized MH as a construct that combines two sides (well-being and ill-being) and that consists of various single-items instead of full scales from existing literature. This choice was made in order to include as many variables as possible in the questionnaire and at the same time minimize the dropout rate. Because of our MH definition as a state characteristic, we specifically refrained from including items related to psychopathologies such as depression, and we used six items that capture resilience factors related to well-being (happiness, confidence, life-satisfaction) and risk factors related to ill-being (stress, anxiety, sleep-quality reflect). Although validating the scale we used here to tackle MH was beyond the scope of the current paper, the reliability of our scale instrument was considerably high (Cronbach’s α = .823) and, thus, we trust that our results capture well the central concept of MH as a function of two opposing poles. Age differences were found significant for both dimensions of MH, which further underlines the adequacy of using multiple items to tackle complex psychological constructs. In our view, the scale we used worked well with the group of adolescents and young adults we recruited, showing normal attrition rate and evidence for good internal consistency. In light of this, we support future steps toward the validation of this scale as a brief instrument tool for measuring MH.
In the current study, we focused on age-group differences between adolescents and young adults in MH, instead of a linear effect of age. Our choice was motivated by the theoretical proposition that the transition to (emerging) adulthood marks the development of important psychophysiological processes in a profound way, as young adults experience changes in various life domains. Common methodological recommendations, however, advice against the practice of dichotomizing data in multiple regression, as this may lead to increased Type II error rate (Stone-Romero et al., 1994). Although the choice of grouping age can be seen as statistically more conservative (standardized coefficients were more moderate for some of the relationships identified), our analysis results did not differ when juxtaposed to those with age treated as a continuous variable. Future researchers interested in the moderating role of age across adolescent development should consider these analytical choices accordingly.
Finally, a point should be made regarding the small correlations between SMU and MH found in our study, in relation to the small coefficients usually captured and reported in the literature. In principle, media effects are small (Bosco et al., 2015) and thus “weak” coefficients should not be regarded as unimportant (Weber & Popova, 2012). The statistical effects of cumulative variance of independent predictors in studies that focus on the process by which variables operate in the real world, like with SMU, may understate the variance contribution in the long run (Abelson, 1985). The fact that our data indicate high values, quadratic trends, and great variance in SMU across participants, suggests at least some (sub)categories of users may exist, whose SMU behavior is significantly different from that of their age-peers. As our data suggest, some individuals reported using social media for up to 20 hr a day and having a few thousand followers. To date, a growing body of studies argues in favor of person-specific approaches in the study of media-effects (Beyens et al., 2020). In line with this line of work, we believe that individual differences in susceptibility to SMU will be at the focus of future media psychological research.
Conclusion
The present study focused on the need for plurality in the measurement of SMU regarding psychological investigations of media-effects. It also pointed attention to age differences in the measurement of SMU and MH, across adolescence and young adulthood. Using a nationally representative sample we found that SMU can be measured in different ways, which together can draw a multifaceted picture. Albeit nuanced, associations between SMU and MH were found to be characterized by both linear and quadratic functions. In trying to see the bigger picture, our data suggest the presence of both problematic and beneficial effects of SMU. Consistent with the literature, time spent on social media appeared as the most robust predictor of MH decrease. At the same time, a large number of shared online and real-life friends appears to increase MH. The current findings bear implications for the degree, direction, and type of association between different measures of SMU, underline the need for diversity in the measurement of SMU and MH and highlight the importance of age in investigating SMU.
Supplemental Material
sj-docx-1-sms-10.1177_20563051211035353 – Supplemental material for Plurality in the Measurement of Social Media Use and Mental Health: An Exploratory Study Among Adolescents and Young Adults
Supplemental material, sj-docx-1-sms-10.1177_20563051211035353 for Plurality in the Measurement of Social Media Use and Mental Health: An Exploratory Study Among Adolescents and Young Adults by Diamantis Petropoulos Petalas, Elly A. Konijn, Benjamin K. Johnson, Jolanda Veldhuis, Nadia A. J. D. Bij de Vaate, Christian Burgers, Ellen Droog, Ewa Międzobrodzka, Katalin E. Balint and Rens van de Schoot in Social Media + Society
Footnotes
Authors’ Note
This work is part of a larger project of the media psychology research at the Communication Science department of the Vrije Universiteit van Amsterdam, led by Prof. dr. Elly Konijn.
Declaration of Conflicting Interests
The author(s) declared no potential conflicts of interest with respect to the research, authorship, and/or publication of this article.
Funding
The author(s) received no financial support for the research, authorship, and/or publication of this article.
Supplemental Material
Supplemental material for this article is available online.
Notes
Author Biographies
References
Supplementary Material
Please find the following supplemental material available below.
For Open Access articles published under a Creative Commons License, all supplemental material carries the same license as the article it is associated with.
For non-Open Access articles published, all supplemental material carries a non-exclusive license, and permission requests for re-use of supplemental material or any part of supplemental material shall be sent directly to the copyright owner as specified in the copyright notice associated with the article.