
Abstract
In this study, we aimed to adapt the Information and communication technology (ICT) Overload and social networking service (SNS) Fatigue Scale to measure the overload and SNSs fatigue experienced by individuals while using ICTs in the Turkish language and analyze the adapted scale based on various variables. The scale adaptation procedure was conducted by surveying 225 undergraduate-level university students. In addition to discriminant and convergent reliability, the general fitness index parameters were compared with confirmatory factor analysis (CFA), and the model results were found in accordance with the acceptable fitness index criteria, with clarification as a complete model in all sub-dimensions. The relationships between fear of missing out (FoMO), problematic smartphone use (PSU), and SNSs Fatigue levels of the participants were also investigated. The adapted scale was then applied to 469 participants. The findings demonstrated that there was a significant difference between PSU and SNS Fatigue levels of participants based on gender, favoring females. It was also revealed that the variables of interest FoMO and SNS Fatigue together predicted the PSU.
Introduction
Information and communication technologies (ICTs) and social networks have led to significant changes in the socialization and communications among individuals (Apaolaza et al., 2013; Desjarlais & Willoughby, 2010; Lee & Ma, 2012; Salehan & Negahban, 2013; Zhong et al., 2011). Widespread usage of social networks has enabled individuals to communicate with more people and learn more about these people when compared to individuals they meet in real life. Although the introduction of the Internet has provided significant advantages, the availability of excessive information on the Internet has reportedly led to several different problems. One of the most significant factors for the introduction and prevalence of these problems is the frequent use or overuse/overdose of social networks.
Social networks can be defined as Internet-based applications that enable individuals to freely express and share their emotions and ideas, and to facilitate interpersonal communication (Mahajan, 2009). SNSs/sites are Internet-based services where individuals can share information of their choosing as users, and communicate with each other by allowing others to send images, videos, or messages (Boyd & Ellison, 2007; Pempek et al., 2009). With the introduction of Web 2.0 technologies, social networks have enabled users to communicate online within various social communities. In providing these facilities, social network operators made it possible for individuals to utilize several social networks frequently only by creating a simple user profile. One of the most important reasons for the preference of the Internet and social networks is the fact that individuals can communicate with people from different cultures, different education levels, and different ages through social networks. They can even create special interest-groups and share information with group members based on their common interests (Boyd & Ellison, 2007). Thus, facilitated usage of Internet-based social networks increases communications and ensures a continuous flow of information. Continuous information sharing on social networks can prevent access to the desired information in the complex and continuously updated information stream. It also makes the analysis, tracking, and assessment of the available information more difficult. Thus, extensive usage of social networking sites increases the significance of ICT overload and social networking services (SNSs) fatigue.
The overload could be associated with different concepts depending on the study content. In a study on the ICT paradox by Karr-Wisniewski and Lu (2010), technological overload was explained in the framework of a three-dimensional concept as information, communication, and system features. It was observed in previous studies that the use of ICT had a negative impact on overload (Ahuja et al., 2007; Moore, 2000). Three types of information overload were defined after SNSs and the Internet became popular. These were rapid changes in the technological characteristics of social networks, involuntary social network extensions, and excessive information availability in social networks. When individuals are exposed to a volume of information which is higher than their processing capacity, they experience information overload (Eppler & Mengis, 2004; Farhoomand & Drury, 2002). In the research model developed by Lee et al. (2016), the three factors that result in ICT overload were determined as Information Overload, Communications Overload, and System Feature Overload. In Figure 1, the research model and results of the structural model testing by Lee et al. (2016) presented. Correspondingly, theoretical framework, stressors, and variables of interest are discussed in the next-section, briefly.

The research model and results of the structural model testing by Lee et al. (2016).
Theoretical Framework
Currently, the excitement of SNSs is waning following a period of flourishing development, and passive actions, including intentionally ignoring some messages or preventing some friends by technological means, is increasingly common because of lack of time, resources, expertise, and personal interests (Guo et al., 2020). As a consequence, many common SNSs, like Facebook and Twitter, have practiced a dramatically decline within the number of active users. Studies have seen established experiences from the problematic usage of SNS in recent years and mentioned the “SNS Fatigue” phenomenon (Ravindran et al., 2014).
Because the experience of fatigue has circulated quickly among SNS users, in recent years, scholars have begun to investigate the antecedents which will cause the phenomenon. In general, we reviewed the literature and determined that during the last years, studies have drawn scholars’ attention and that the researchers have to this point presented an initial insight into the SNS fatigue phenomenon. This phenomenon recently stimulated researchers from all around the world to carry out empirical researches to investigate the context, motives, and reasons of SNS fatigue (Luqman et al., 2017; Sasaki et al., 2016). However, SNS fatigue is characterized as a condition within which users of social media encounter mental exhaustion after witnessing numerous technical, informational, and communicative overloads through their involvement and engagement within the varied social media online platforms (Bright et al., 2015; Lee et al., 2016; Ravindran et al., 2014). Since fatigue experience is rapidly growing among SNS users, researchers recently began to explore the factors that might contribute to SNS fatigue. Although many studies demonstrate the role of fatigue in social media and provide significant perspectives into its antecedents, the aspects of SNS which might cause fatigue have not been established.
The main focus of several analyses on the impact of activity in social media (e.g., overuse) on SNS fatigue was on the person-environment fit model and cognitive behavior theory (Lee et al., 2016; Zheng & Lee, 2016). The implications and etiology of the SNS fatigue among young adults are investigated in this study, and the situation in which pervasive SNS usage exposes individuals to a vast amount, cognitive resources, and capacity demand beyond their cognitive capacities (reviewed in Lee et al., 2016). As a basis for understanding SNS’s users’ information avoidance behavior, the stressor-strain-outcome (SSO) model was used as a theoretical framework to handle the gap in the literature. The SSO framework is widely used to research stress-related circumstances and outcomes in the context of technology use (Ayyagari et al., 2011; Dhir et al., 2018; Ragu-Nathan et al., 2008), which exactly suits the main aim of this study, namely, to research how stress-related factors lead users’ behavior.
Stressors (Information Overload, Communication Overload, and System Feature Overload)
The SSO framework is composed of three main components, namely strain, stressor, and result. Stressors are stress-inducing causes. In this study, we consider namely, information overload, communication overload, and system feature overload as stressors for users. The concept of overload is associated with the difficulty experienced by an individual in understanding the information or making a decision in the presence of excessive information (Gomez-Rodriguez et al., 2014). When social networks solicit users with too much information and exceed the user’s capacity to process that information, users may experience an excessive bombardment of information (Cherubini et al., 2010; Edmunds & Morris, 2000; Pennington & Tuttle, 2007). If the user is frequently exposed to unrelated information, the individual could experience incompatibility either between personal goals and environmental material or between environmental demands and personal skills. The user is not supposed to deal with unrelated content. When this is experienced, information overload occurs. However, the user is unlikely to experience information overload when the provided information is deemed relevant (Ayyagari et al., 2011). Bontcheva et al. (2013) noted that microblog users extensively complained about information overload.
Communication overload takes place when individuals are exposed to excessive information that they cannot cope with, either from different communication sources or from a single source (Chen & Lee, 2013). Communication overload occurs when communications that exceed the capacity of an individual arrive from ICT tools such as social networks (Cho et al., 2011). A similar concept to communication overload, connection overload, occurs when individuals read and respond to wanted or unwanted messages on online social media and their ability to maintain their relations on social media exceeds their cognitive capacity (LaRose et al., 2014). It is known that connection overload adversely affects the productivity of individuals by over-disrupting their attention (Karr-Wisniewski & Lu, 2010).
System feature overload occurs when the usage is complex and new features are added to technical resources or the given technology is too complex to perform a specific task within a social network. The fact that it is necessary to use ICTs in the digital world leads to the continuous use of these technologies by individuals. The software, which is altered and updated almost daily, require the end-users to learn every innovation. The condition that occurs due to system feature overload is considered to be one of the triggers of technostress. The concept of technostress describes the inadequacy of individuals to use ICTs effectively (Ayyagari, 2012; Çoklar & Şahin, 2011). When the energy required to cope with this condition is high, overload could lead to fatigue (Ravindran et al., 2014). Thus, social network usage overload could lead to negative consequences such as SNS fatigue.
SNS Fatigue, Fear of Missing Out, and Problematic Smartphone Use
The number of active social network users in all countries has increased exponentially, since the proliferation of smartphones, new mobile devices, and apps over the past years. Some individuals consider social networks as a novel form of occupation, allowing social networks to wholly penetrate their lives. The ability and styles of ICT to present their various functions and complex features to users change rapidly over time. These features and changes could lead to an incompatibility between ICT and users, and thus, cause stress in individuals (Ragu-Nathan et al., 2008). Furthermore, information overload in social networks compels users to utilize social networks faster than their abilities can cope with (Moore, 2000). There may be a difference between the abilities of social network users and the demands of social network media.
Social networking is a worldwide influential communication network and educational appliance. Despite the various positive effects that benefit people in all aspects of life, adverse outcomes are often likely due to excessive usage of social media. SNS fatigue is a significant factor that adversely affects the behavioral and mental characteristics of users. Therefore, information overload, overuse of social networks, and inability to meet the demands of social networks could lead to stress in individuals. Ayyagari et al. (2011) stated that the gap between ICT features and the capabilities of individuals is an important factor in the formation of stress among individuals. SNS fatigue, at the user’s level, leads to the degradation of both mental and physiological capacities, which can lead to unsafe behavior for users (reviewed in Dhir et al., 2018). Thus, social network use could lead to feelings of exhaustion, restlessness, or dissatisfaction among individuals. Over recent years, some scholars have discovered fatigue over conjunction with the problematic use of SNSs and proposed the idea of “SNS fatigue” (Ravindran et al., 2014). SNS fatigue has been caused by the increased dedication to social media platforms, as well as a spike in different content kinds on these websites. The latest researches indicate that SNS fatigue has a detrimental effect on the psychosocial well-being of social media users (Dhir et al., 2018). SNS fatigue was commonly seen as an outcome of overload, and several scholars discussed the relation between fatigue and overload (Ravindran et al., 2014; Zhang et al., 2016).
There are several reasons for SNS fatigue such as social dynamics, content, and social network platform-based factors (Ravindran et al., 2014). It is also known that SNS fatigue is associated with mental burnout and physical symptoms (Çoklar & Şahin, 2011). Friends constantly sending requests, game requests, or sharing photos and messages through social networks can lead to fatigue. Furthermore, individuals may experience compatibility issues when using social networks and may need to spend more time to reach the desired content due to system updates on social networks. Similarly, in social networks such as Twitter, frequent updates make it harder to follow these networks and could, therefore, be seen as disturbing (Gross, 2011). Furthermore, sudden and frequent advertisements related to price discounts or product promotions on social media could lead to frustration, fatigue, and exhaustion among social media users (Bright et al., 2015; Shashank, 2011).
Users who experience difficulties in using and managing social networks and feel stress, as a result, may go on to feel fatigued that could adversely affect their social network usage, or even cause them to abandon the use of certain social networks (Ravindran et al., 2014; Walker, 1986). Thus, it is important to determine the effect of SNS fatigue and information overload on social networks on individuals. The use of social networking has led to Fear of Missing Out (FoMO), due to the incessant need for increased popularity among young people and the need to improve relations. As a result, the perceived amount of stress caused by social networking is increasing (Beyens et al., 2016). This stress can also be caused by communication with friends, but also by the use of social networking. FoMO in social networks, socialization, and the need to increase popularity can cause social networking dependency of users (Müller et al., 2016). Several empirical experiments reveal that in social and psychological demands people who experiencing FoMO are vulnerable to being closely linked to other individuals (Beyens et al., 2016). In addition, individuals with low levels of emotional satisfaction or life satisfaction are likely to be exposed by FoMO (Przybylski et al., 2013). FoMO has been identified as an essential risk factor in the growth of PSU and represents a desire to remain continuously online and connected through SNSs. Concurrently, social networks can cause negative psychological influences such as jealousy and shame (Lim & Yang, 2015). Certain previous FoMO studies specifically show the psychological and physiological adverse consequences of elevated FoMO rates. Nevertheless, it is not yet clear whether FoMO is substantially related to SNS fatigue, although the use of social networking by people with high FoMO rates has been reported to indicate greater engagement and social media usage (Wolniewicz et al., 2018). Excessive and compulsive engagement in social networking is potentially leading to SNS fatigue (Karapanos et al., 2016; Zheng & Lee, 2016). Therefore, high rates of FoMO may induce SNS fatigue.
Another variable mentioned with SNS fatigue is Problematic Smartphone Use (PSU). PSU is a critical problem, especially among young adults (Smetaniuk, 2014). Several scholars have investigated the constructs of PSU with respect to theories of psychopathology. Anxiety, stress, depression, and low self-esteem symptoms are the most commonly examined psychopathology constructs throughout tandem with PSU in the literature (reviewed in Elhai et al., 2017). PSU might not have formal diagnosis criteria; however, it has similar characteristic features of other addiction habits such as functional impairment, overuse, and withdrawal cessation of use (Ezoe et al., 2009). In today’s culture, a number of leisure and social practices may be accessed through the new generation of smartphones. PSU is a remarkable phenomenon, because a mobile device is lightweight, highly compact, and available in individuals’ pockets or bags generally continuously. Accessibility and portability promote mobile device usage or overuse and are also likely to develop the habit of related to it (Oulasvirta et al., 2012). It may also be argued that smartphones easily replace personal computers and become personal assistants for individuals (Elgan, 2017). Despite the benefits of constant connectivity to a multi-functional mobile device, excessive usage of smartphones is a growing potential public health issue (Billieux et al., 2015). Nevertheless, according to Elhai et al. (2017), PSU can be evaluated with various situations such as Internet addiction (reviewed in Kuss et al., 2014) and Internet gaming addiction (reviewed in Kuss & Griffiths, 2012), but there are structural differences between these concepts. Although the common signs of these structures are similar; PSU is evaluated in a different context for reasons such as smartphone platforms and the interface of a smartphone.
In the literature, there are several empirical studies (i.e., Błachnio & Przepiórka, 2018; Blackwell et al., 2017; Dhir et al., 2018; Elhai et al., 2016; Fuster et al., 2017; James et al., 2017; Oberst et al., 2017; Wolniewicz et al., 2018) that reveal a moderate and large relationship between FoMO and PSU variables and problematic SNS usage (reviewed in Elhai et al., 2018a). Thus, it is clear that there is a relationship between FoMO, PSU, and SNS fatigue. The antecedents of PSU and term, however, are fairly recent, and, as such, concepts tend to be defined as well. Analyzing PSU predictors is therefore essential to further prevention and intervention. Characteristics of personality and adult attachment under the PSU usage model (Billieux et al., 2015) are key psychological factors that can be useful for understanding the problem and addiction of individuals to cell phones. It was decided to examine these variables together in this study. Consequently, it is thought that the results of the current research will contribute to the literature in the context of using social networks and SNS fatigue.
Method
The research consists of two sections. In the first section, it was aimed to adapt the ICT Overload and SNS fatigue scale developed by Lee et al. (2016) to the Turkish language context with 225 participants. In the second section, in addition to using the current adapted scale, FoMO scale developed by Przybylski et al. (2013) and adapted into the Turkish language by Gokler et al. (2016) was used to collect data about FoMO. Concurrently, NMP-Q scale developed by Yildirim and Correia (2015) and adapted into the Turkish language by Adnan and Gezgin (2016) was also used to collect data related to PSU. It was aimed to analyze the scale based on certain variables to measure the overload and SNS fatigue experienced by individuals while using ICTs with 469 participants. The study was conducted as paper-based research. The research questions that guided the study are as follows:
RQ1. How should the ICT Overload and SNS fatigue scale be adapted to the Turkish language context?
RQ2. What are the PSU, FoMO, and SNS fatigue levels of participants?
RQ3. Do the PSU, FoMO, and SNS fatigue levels of participants differ based on the variables of gender, social network usage duration, smartphone usage duration, frequency of checking the media, frequency of checking email, and frequency of checking for calls?
RQ4. Is there a correlation between SNS fatigue level and PSU and/or FoMO levels?
RQ5. Do SNS fatigue levels and FoMO explain PSU?
Scale Adaptation Procedure and Statistical Results
There is a limited number of studies that have investigated SNS fatigue in Turkish. In current studies, social networks were discussed in terms of social (social dynamics, power struggles, etc.) and technological (platform features, technological environment, etc.) perspectives. Unlike these studies, Lee et al. (2016) focused on internal psychological processes that lead to fatigue and developed the ICT Overload and SNS fatigue scale in a study conducted with data obtained from 201 online and offline participants.
The exploratory factor analysis (EFA) conducted on the ICT Overload and SNS fatigue scale resulted in an eight-factor scale. The eight factors identified in the EFA were “Information Relevance,” “Information Equivocality,” “System Pace of Change,” “System Complexity,” “Information Overload,” “Communication Overload,” “System Feature Overload,” and “SNS Fatigue.” Based on the findings of the confirmatory factor analysis (CFA), items with a factor weight of .60 and above were included in the scale. The scale includes 32-items and the Cronbach alpha (α) internal consistency reliability coefficients for all the eight factors are greater than (.70) level.
In this study, overload was accepted as the main determinant of SNS fatigue based on the literature (Cherubini et al., 2010; Lee et al., 2016; Ravindran et al., 2014). Overload was discussed under “Information Overload,” “Communication Overload,” and “System Feature Overload” sub-dimensions. Furthermore, social networking characteristics were included as the precursor of overload on the scale. The scale is configured as a seven-point, Likert-type that included the option of “I completely disagree” (1), “I disagree” (2), “I somehow disagree” (3), “Neither agree nor disagree” (4), “I somehow agree” (5), “I agree” (6), and “I completely agree” (7).
The statistical analysis was conducted using IBM SPSS 23 software. CFA was conducted using LISREL 9.1 software to test the measurement models that describe the correlations between the factors and the indicators. A number of different compliance criteria are used to determine the fitness of the tested model in CFA. Kline (2011) suggested that the fitness indices have weaker and stronger aspects when compared, thus proposed the use of more than one fitness criterion. The fitness indices presented in the Table 1 were tested to examine the factor structure in the scale.
Model Fit Indices for Measurement Model Results.
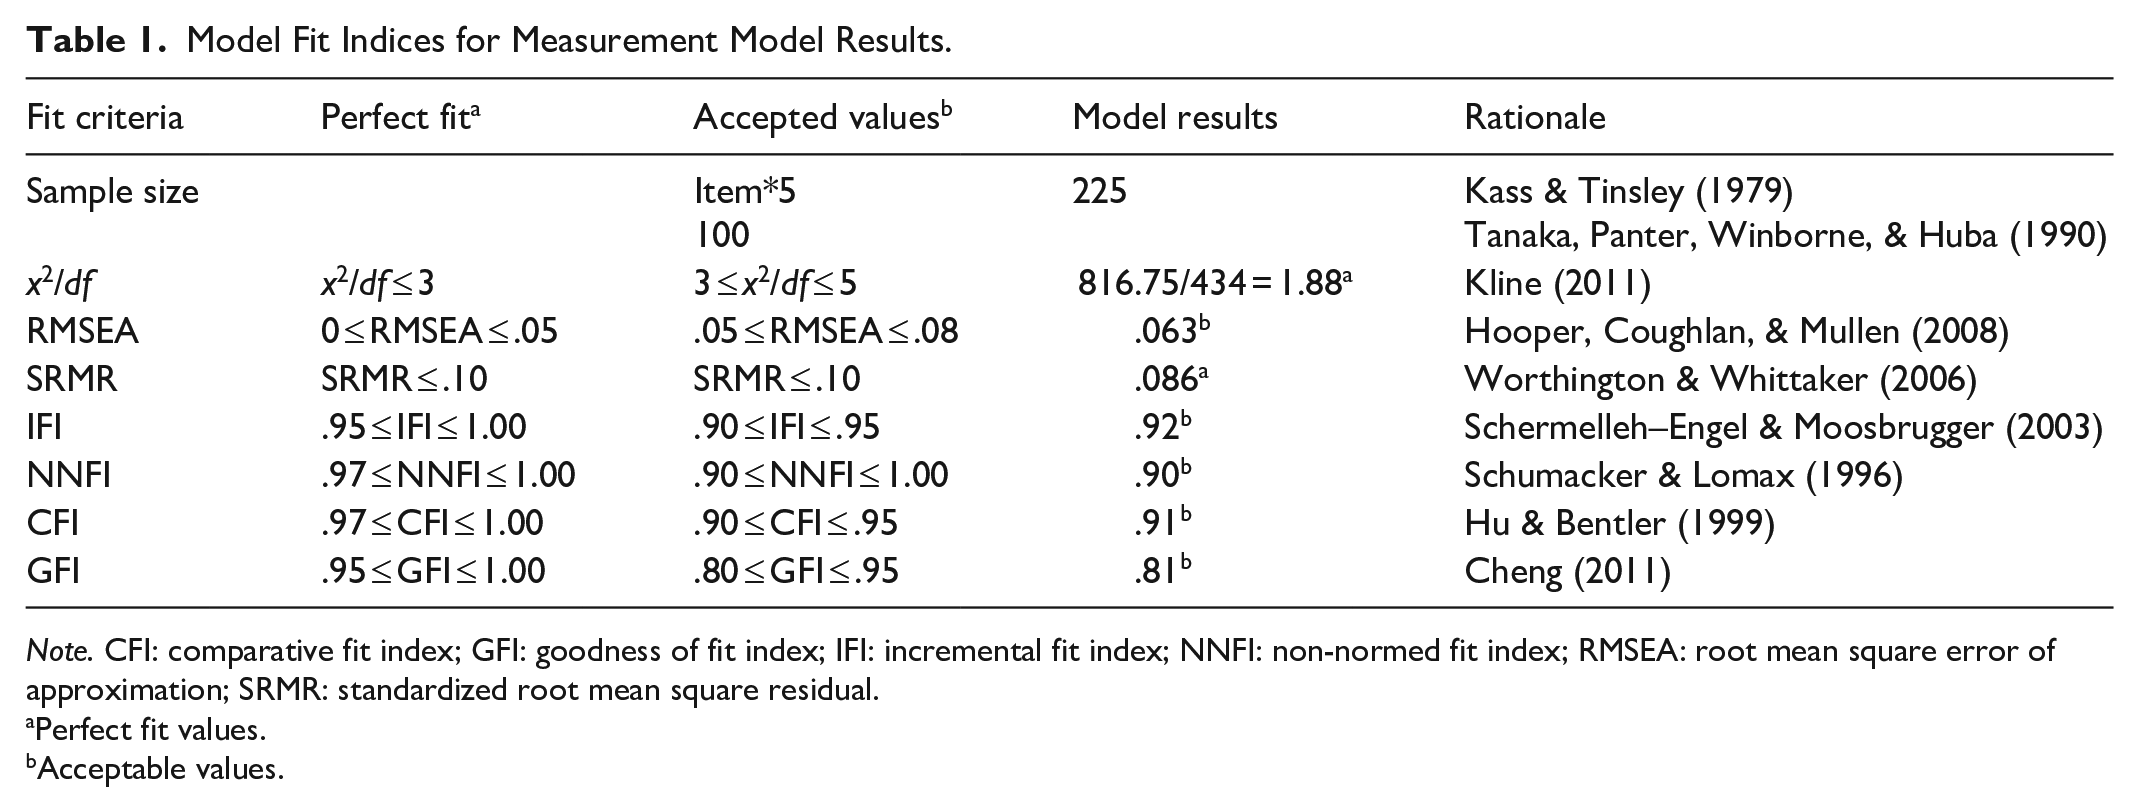
Note. CFI: comparative fit index; GFI: goodness of fit index; IFI: incremental fit index; NNFI: non-normed fit index; RMSEA: root mean square error of approximation; SRMR: standardized root mean square residual.
Perfect fit values.
Acceptable values.
When the fit indices of the model tested with CFA were examined, it was found that the chi-square value (x2 = 816.75, df = 434, p < .001) was significant. It was found that the calculated model x2/df = 1.88 ratio indicated a perfect fit. It was observed that other model fitness values (RMSEA = .063, SRMR = .086, CFI = .91, GFI = .81, NNFI = .90, IFI = .92) were all within an acceptable fitness interval. It was determined that the factor loads for all tested scale items were also statistically significant in the model. When the general fitness index criteria were compared, it was observed that the values for the model were within the acceptable fitness index interval, and that the model and all model sub-dimensions were verified. In addition to the structural validity results, it is important to examine the discriminant and convergent validity. To test convergent validity, all construct reliability/composite reliability (CR) values for the scale are expected to be greater than the average variance extracted (AVE) value, and the AVE value is expected to be greater than a value of 0.5. The CR value could be calculated using the formula of Fornell and Larcker (1981). This value is expected to be greater than 0.7. To test discriminant validity (DV), maximum squared variance (MSV) < AVE and average shared square variance (ASV) < MSV requirements must be met. In addition, it is necessary to ensure that the square root of the AVE is greater than the correlation between the scale’s factors. Also, the DV value was calculated. The AVE, CR, and DV values were calculated as .82, .97, and .90, respectively. Thus, it is understood that the scale also verifies discriminant and convergent validity, so it is possible to answer RQ1.
Scale Translation Procedure
The original scale’s authors’ permission was obtained on the condition that the scale would be used for the purposes of academic study. A professional translator converted the originals to Turkish with revisions suggested by experts and English language teachers at the host institution. Then, the data collection tool procedure was initiated.
Study Group
According to the literature, SNS fatigue and FoMO are mostly seen within younger groups of adolescents and undergraduate-level university students (Alt, 2015; Blackwell et al., 2017; Elhai et al., 2016; Krishnamurthy & Chetlapalli, 2015; Oberst et al., 2017). SNSs have also achieved considerable popularity in recent years, in Turkey as in the entire world. According to the We Are Social (2020) report, 92% of the population in Turkey own a smartphone (about 77 million) while 64% of the population are active users of social media (about 54 million). The most popular SNSs are YouTube (90%), Instagram (83%), WhatsApp (81%), Facebook (76%), and Twitter (61%), respectively, as proportioned to the population. There was a 3.4% rise in smartphone usage compared to 2019 and a 4.2% growth in the number of social media users. In comparison, according to Internet usage statistics, smartphone usage has risen over the last 3 years (about +31%), contrary laptop (about −55%) and personal computer (PC; about −40%) use rates have dropped dramatically. Another conspicuous case is that male social media user rates are higher for any age range than females. There is growing concern about how individual differences in general, and particularly gender, predispose other individuals to participate (Sween et al., 2017; Toda et al., 2016). Gender is therefore a critical factor in this research and social networking dynamics are becoming increasingly important for individuals in particular Turkey, one of the top five countries with higher rates of SNS usage than the United States and Europe. Therefore, in this study, undergraduate-level university students whose social network usage is considered their focus were examined as a study group for SNS fatigue within the framework of different variables. In the first, the adaption of the scale was conducted with 225 undergraduate-level university students (n = 225; 137 females [60.9%]). The sample was a convenience sample of undergraduate-level university students. The students voluntarily and anonymously participated in the study.
Results
The scale was applied to 469 undergraduate-level university students attending Anadolu University Faculty of Education (n = 469, 274 females [58.4%]; grade levels: second grade n = 267 [56.9%]; third grade n = 159 [33.9%]; fourth grade n = 43 [9.2%]). In terms of the participants’ department of study, 24.5% (n = 115) were attending English Language Education, 19.0% (n = 89) were attending Computer and Instructional Technologies Education (CEIT), 13.9% (n = 65) were attending Special Education, 13.6% (n = 64) were attending Primary Education, 8.1% (n = 38) were attending German Language Education, 7.5% (n = 35) were attending Guidance and Psychological Counseling Education, 7.0% (n = 33) were attending Art Education, and 6.2% (n = 29) were attending French Language Education departments. In addition, 0.002% of the participants (n = 1) selected “other” as their department of study. Demographics for the participants are presented in Table 2.
Demographics.

Note. CEIT: Computer and Instructional Technologies Education; PC: personal computer.
It was determined that 95.5% of the participants (n = 448) had continuous Internet access, demonstrating that a very high percentage of participants had Internet access. In order to eliminate such potential confounding factors, participants who specified that had no any continuous Internet access (n = 21; 9 females [42.9%]) were excluded from all the ongoing analysis. When the time the participants spent with a smartphone was examined, it was found that the rate of those who spent between 1 and 5 hr on their smartphones was 66.7% (n = 299). Those who spent less than 1 hr on their smartphones amounted to only 6.5% (n = 29). It was determined that 26.8% (n = 120) spent more than 5 hr on their smartphones. The fact that about one-quarter of the participants spent more than 5 hr on their smartphones was a striking finding. When the time they spent on social networks was examined, it was found that the rate of those who spent between 1 and 5 hr was about 69.8% (n = 313). The rate of those who spent less than 1 hr on social networks was 12.1% (n = 54), while the rate of those who spent 5 hr or more on social networks was 18.1% (n = 81).
Analysis of the frequency of checking social media accounts demonstrated that 55.4% (n = 248) of the participants checked their social media accounts every day and that 33.5% (n = 150) checked their social media accounts every hour. The rate of those who checked their social media accounts every other day was as low as 11.2% (n = 50). Analysis of the frequency of checking email accounts demonstrated that 50.2% (n = 225) of the participants checked their email every other day, while 45.8% (n = 205) checked their email every day. The rate of those who checked their email every hour was as low as 4.0% (n = 18). It was found that 48.2% (n = 216) of the participants checked their smartphones for calls every day, 41.3% (n = 185) checked every hour, and 10.5% (n = 47) checked their smartphones for calls every other day. Participants most frequently used social networks such as WhatsApp, Facebook, Instagram, Snapchat, and Twitter, respectively. It was determined that the least preferred social network was Flickr. Considering that participants used more than one device to connect to social networks, it was determined that 96.65% (n = 433) preferred smartphones, 49.78% (n = 223) preferred personal computers, and 5.58% (n = 25) preferred using tablet computers. While the most frequently preferred device type was the smartphone, the preference for tablet computers was the lowest.
The standard deviations of the arithmetic mean and standard deviation of the scale scores were calculated in order to answer the RQ2 and the results are as follows (n = 448, MSNS Fatigue = 3.823, SDSNS Fatigue = 0.73; MPSU = 4.067, SDPSU = 1.26; MFoMO = 2.659, SDFoMO = 0.75). According to this results, the mean PSU score was the highest and the mean FoMO score was the lowest among participants.
The MANOVA and Multilinear Regression prerequisites for research questions were examined. Mahalanobis distance was calculated for multivariate normality. Since the high Mahalanobis value for all three variables was below 16.27, multivariate normality was confirmed. The Box-M Test was conducted for the equality of the variance–covariance matrix and was confirmed (p > .05). For multilinear correlation, the correlation between the scales was examined and a linear relationship was found among the variables. It was also evident that the dependent variable fulfilled the multilinear correlation requirement since the dependent variable variance inflation factor (VIF) value was less than 10 and the tolerance values were greater than 0.1. Since there was no high correlation among the variables, it was determined that the singularity requirement was achieved (r < .90). Since the multiple regression analysis is sensitive to outliers, the outliers were examined with a scatter graph, and it was determined that there were no outliers since they were within the range of ±3.3 (Tabachnick & Fidell, 1996). Furthermore, since Cook’s distance value was lower than 1 and centered leverage was below .02, it was concluded that there was no outlier problem. Finally, the Durbin–Watson value was examined in order to determine that the residual terms were not correlated. Since this value was within the range of 1–3 (Field, 2005), it was determined that the residual terms were not correlated. After the confirmation of all the prerequisites, MANOVA, followed by regression analysis was conducted to research the sub-objectives of the study.
MANOVA was conducted in order to obtain findings for the sub-research question (RQ3). The analysis findings are presented in Table 3.
Analysis of Differences Between FoMO, PSU, and SNS Fatigue Levels Based on Gender.
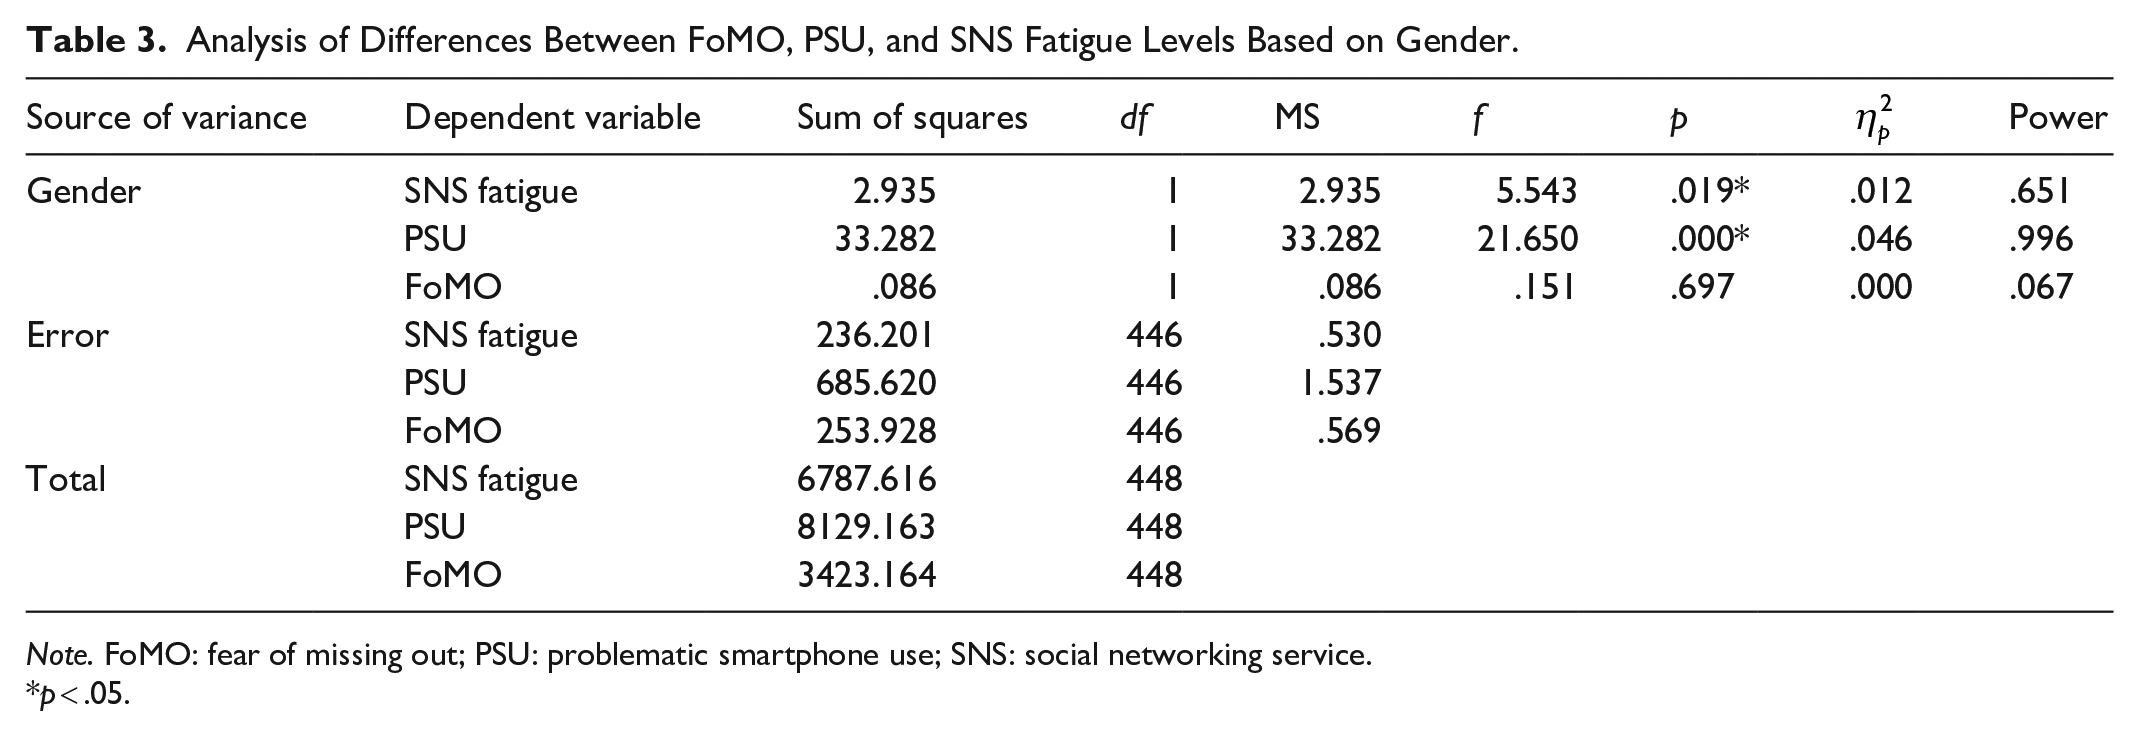
Note. FoMO: fear of missing out; PSU: problematic smartphone use; SNS: social networking service.
p < .05.
MANOVA findings demonstrated that Wilks’ Lambda value for gender was significant (p < .05). Also, Levene-Test result demonstrated variance equality (p > .05). Analysis results demonstrated that there were significant differences between SNS fatigue levels, λ = .019; F(1, 446) = 5.543, p < .05,
MANOVA was conducted to obtain findings on the sub-research question (RQ3). The findings are presented in Table 4.
Analysis of Differences Between FoMO, PSU, and SNS Fatigue Levels Based on Time Spent on Social Networks.

Note. FoMO: fear of missing out; SNS: social networking service; PSU: problematic smartphone use.
p < .05.
MANOVA results demonstrated that Wilks’ Lambda Test value for time spent on social networks was significant (p < .05). Also, Levene-Test result demonstrated variance equality (p > .05). Analysis results demonstrated that there were significant differences between PSU levels, λ = .000; F(3, 444) = 8.098, p < .05,
MANOVA was conducted to obtain findings on the sub-research question (RQ3). Analysis findings are presented in Table 5.
Analysis of Differences Between FoMO, PSU, and SNS Fatigue Levels Based on Time Spent on Smartphones.
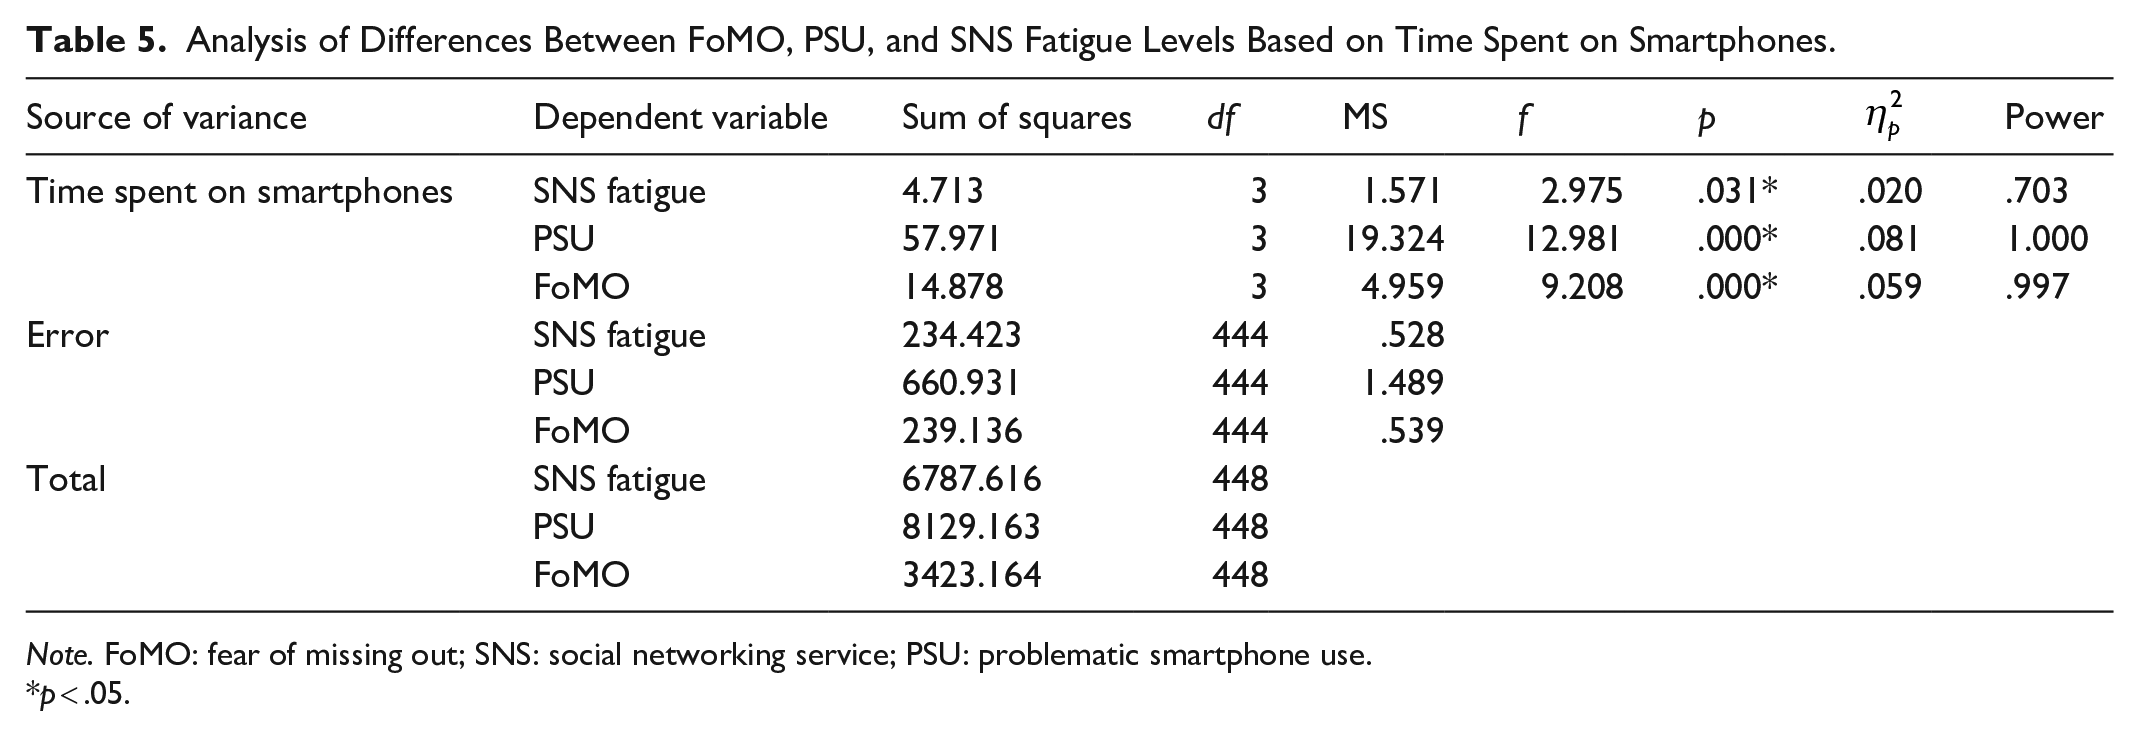
Note. FoMO: fear of missing out; SNS: social networking service; PSU: problematic smartphone use.
p < .05.
MANOVA results demonstrated that Wilks’ Lambda for smartphone usage duration was significant (p < .05). Also, Levene-Test result demonstrated variance equality (p > .05). Analysis results demonstrated that there were significant differences between SNS fatigue levels, λ = .031; F(3, 444) = 2.975, p < .05,
MANOVA was conducted on the mean scale scores to obtain findings on the sub-research question (RQ3), and the findings are presented in Table 6.
Analysis of Differences Between FoMO, PSU, and SNS Fatigue Levels Based on Checking the Media.

Note. FoMO: fear of missing out; SNS: social networking service; PSU: problematic smartphone use.
p < .05.
MANOVA results demonstrated that Wilks’ Lambda Test for the frequency of checking the media was significant (p < .05). Also, Levene-Test result demonstrated variance equality (p > .05). Analysis results demonstrated that there were significant differences between PSU levels, λ = .000; F(2, 445) = 12.961, p < .05,
MANOVA was conducted on the mean scale scores to obtain findings on the sub-research question (RQ3). The findings are presented in Table 7.
Analysis of Differences Between FoMO, PSU, and SNS Fatigue Levels Based on Checking Their Email.
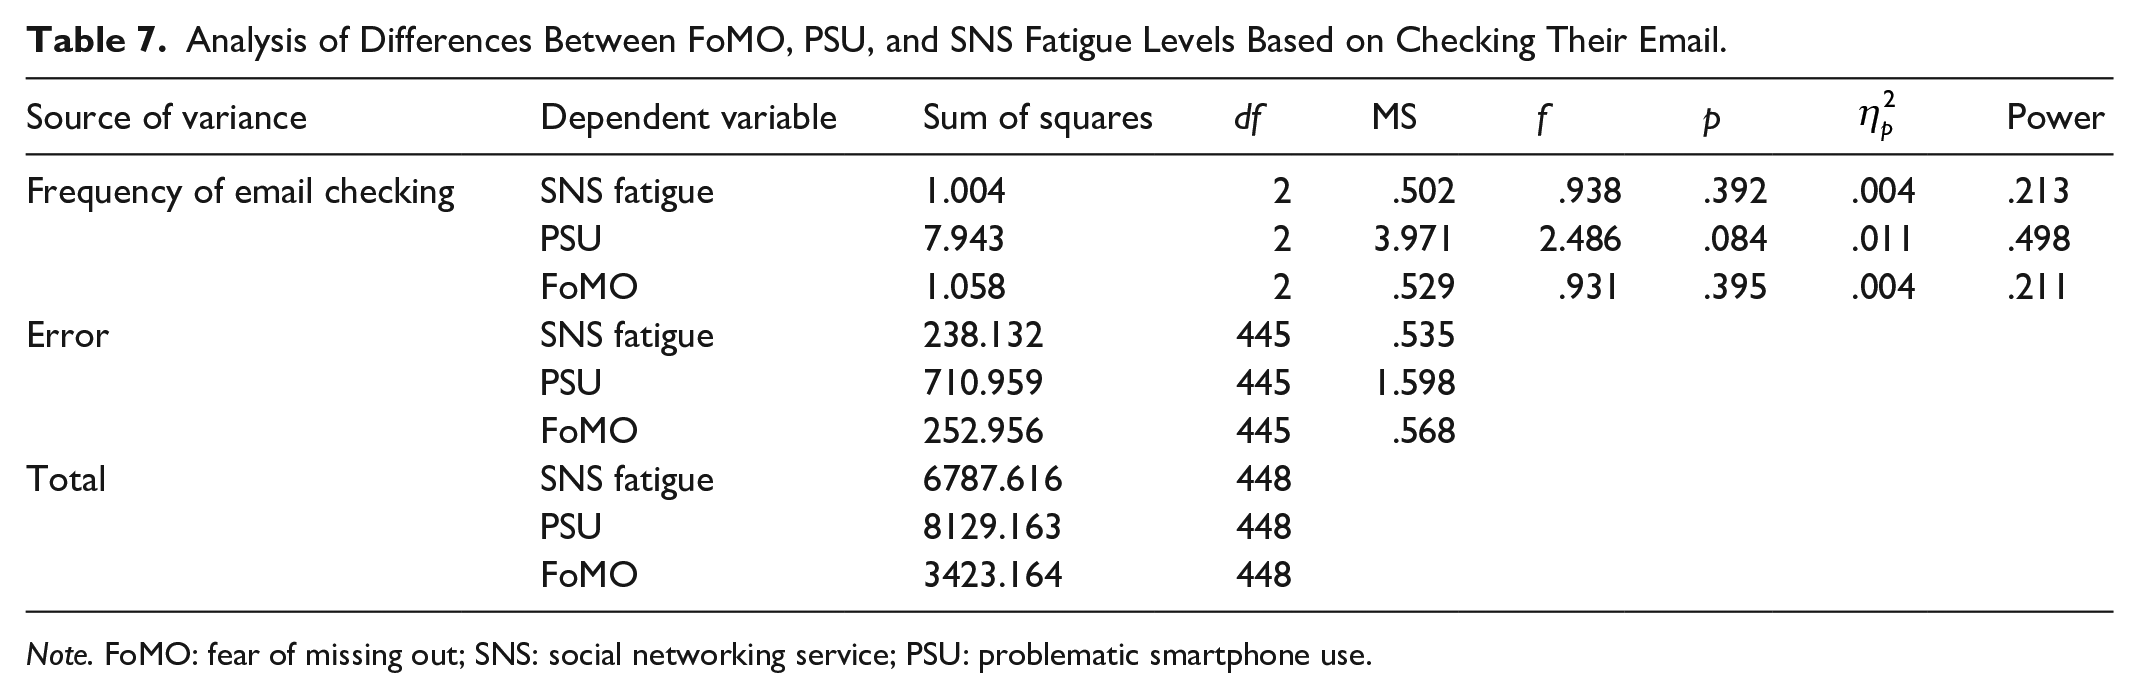
Note. FoMO: fear of missing out; SNS: social networking service; PSU: problematic smartphone use.
MANOVA results demonstrated that Wilks’ Lambda Test for the frequency of checking their email was significant (p < .05). Also, Levene-Test result demonstrated variance equality (p > .05). However, results demonstrated that there were no significant differences between participants’ SNS fatigue, PSU levels, and FoMO, based on the frequency of checking their emails.
MANOVA was conducted on the mean scale scores in order to obtain findings on the sub-research question (RQ3). The findings are presented in Table 8.
Analysis of Differences Between FoMO, PSU, and SNS Fatigue Levels Based on Checking the Calls.

Note. FoMO: fear of missing out; SNS: social networking service; PSU: problematic smartphone use.
p < .05.
MANOVA results demonstrated that Wilks’ Lambda Test for the frequency of checking for calls was not significant (p > .05). Also, Levene-Test result demonstrated variance equality (p > .05). Analysis results demonstrated that there were significant differences between PSU levels, λ = .002; F(2, 445) = 6.335, p < .05,
Significant differences between the dimensions were not determined in the post hoc test conducted to identify which levels of frequency of checking for calls led to a difference between the SNS fatigue levels of the students since the Scheffe is a rigid test. Thus, the least significant difference (LSD) method was conducted as the post hoc test, and to determine between which dimensions there were significant differences. As a result, it was determined that there were differences found between the SNS fatigue levels of those who checked for calls hourly when compared to those who checked for calls every day and every other day (p < .05).
Correlation analysis was conducted on the mean scale scores in order to obtain findings on the RQ4. The relationships across the variables of interest are as follows: The findings revealed that positive and significant relationships between SNS fatigue and PSU (r = .362, p < .05), SNS fatigue and FoMO (r = .227, p < .05) and, PSU and FoMO (r = .520, p < .05). The correlations between all the variables of interest are summarized in the Table 9. Analysis of the correlation coefficients among the variables demonstrated that the correlation coefficient between PSU and FoMO was high, since it was between .50 and 1.00, according to Cohen (1988) and Huck (2008). The correlation coefficient between SNS fatigue and PSU was between .30 and .49, according to Cohen (1988) and Huck (2008), and the correlation was moderate. There was also a low-level correlation found between SNS fatigue and FoMO, which was between .10 and .29, according to Cohen (1988) and Huck (2008).
Relationships Between Variables of Interest.
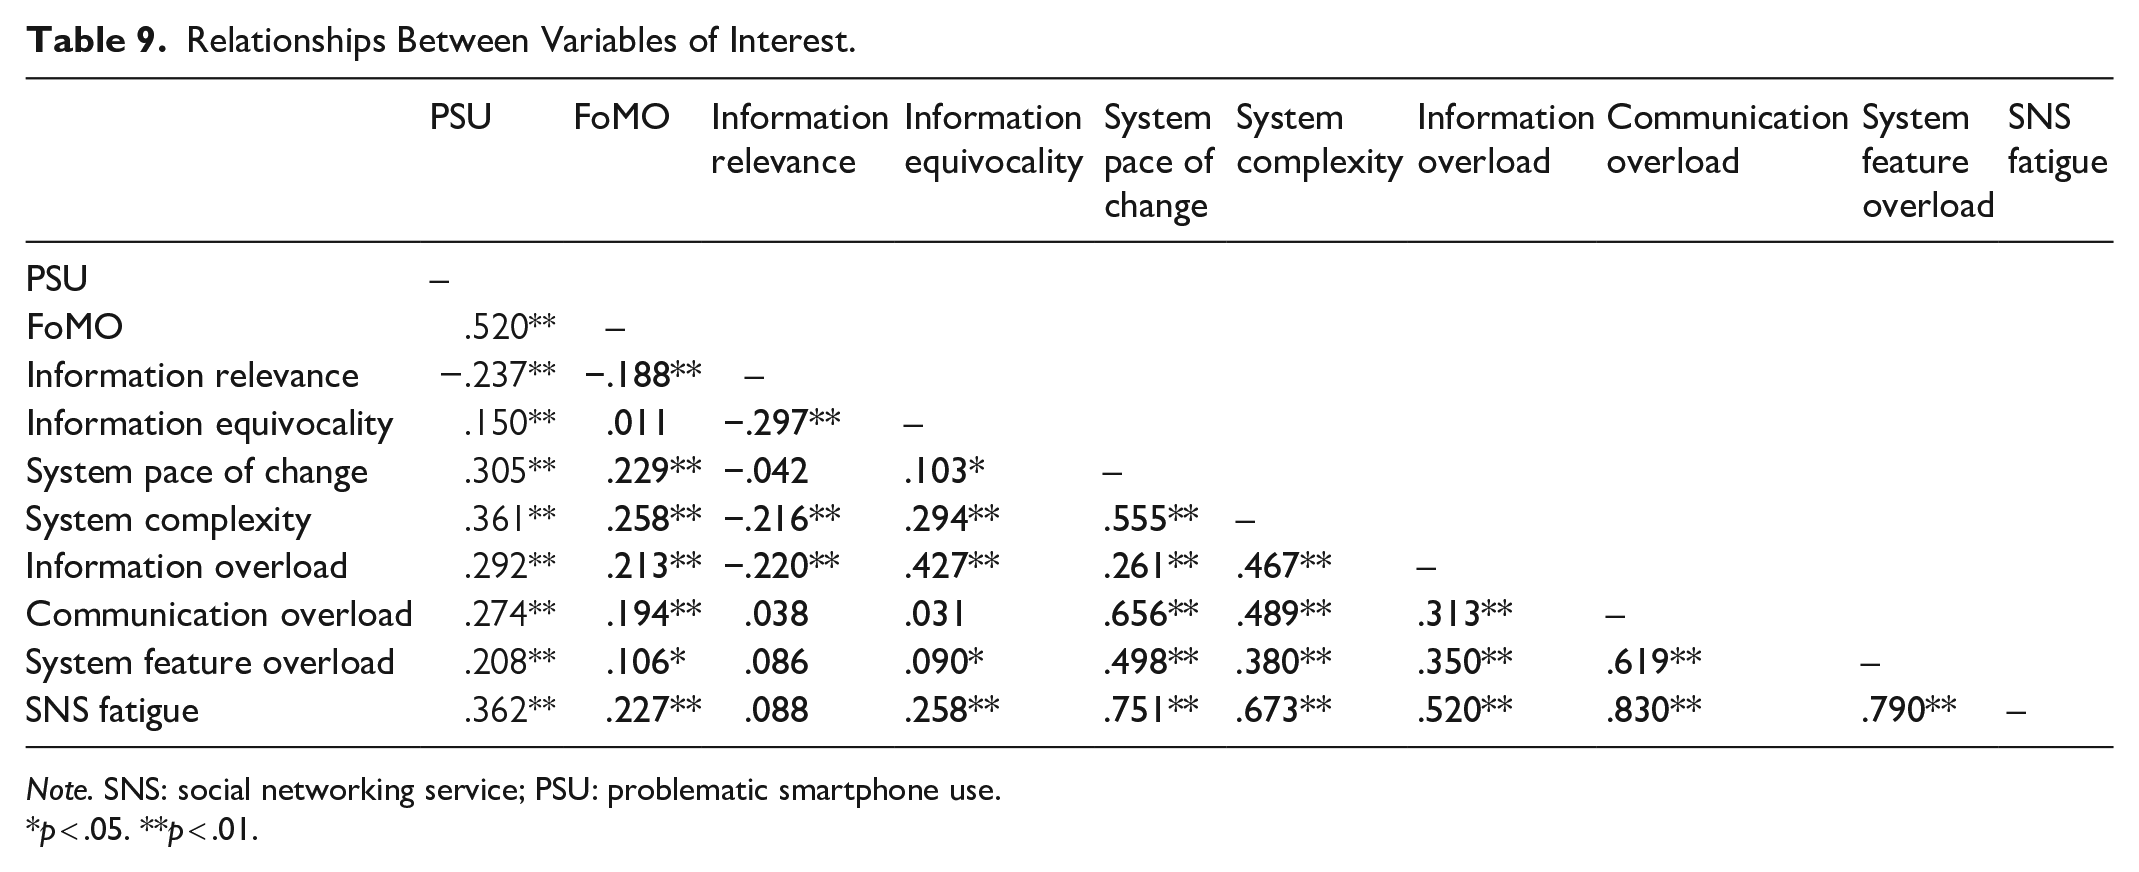
Note. SNS: social networking service; PSU: problematic smartphone use.
p < .05. **p < .01.
Multiple regression analysis was conducted on the mean scale scores to obtain findings on the Q5. The regression analysis results on the prediction of PSU by the variables of FoMO and SNS Fatigue are presented in Table 10.
The Level that FoMO and SNS Fatigue Explained the PSU.
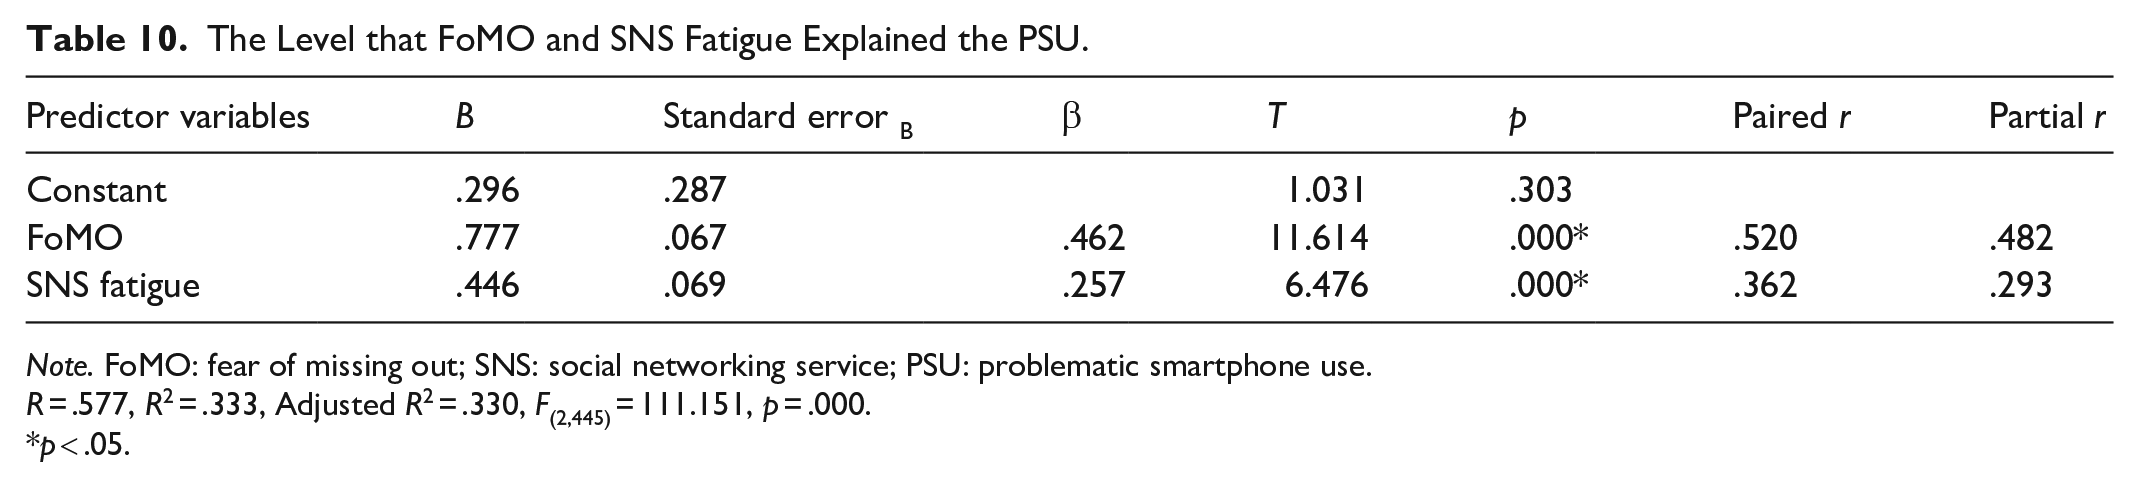
Note. FoMO: fear of missing out; SNS: social networking service; PSU: problematic smartphone use.
R = .577, R2 = .333, Adjusted R2 = .330, F(2,445) = 111.151, p = .000.
p < .05.
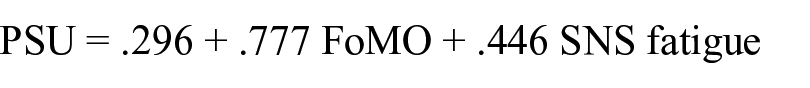
There was a significant correlation found between FoMO and SNS fatigue variables and the PSU variable (R = .577, R2 = .333, p < .05). The two variables explained approximately 33% of the total variance in PSU. Based on the standardized regression coefficient (β), the relative significance of the predicting variables on the PSU can be ranked as FoMO followed by SNS fatigue. When the t-test results conducted to determine the significance of the regression coefficients were examined, it was observed that both variables were significant predictors. The regression equation mathematical model for the prediction of PSU based on the regression analysis results was determined as follows
Discussion and Recommendations
The study findings determined that the significant difference between SNS fatigue and PSU levels of students favored female students. Other studies in the literature also reported that females had a higher tendency toward PSU (Jenaro et al., 2007; Takao et al., 2009). However, other studies reported that SNS fatigue increased the risk of depression among females significantly higher compared to males (Oberst et al., 2017). However, in a study by Lee et al. (2016), it was reported that no significant difference was found between SNS fatigue levels based on gender. It was considered that this was due to differences in the sample, economic, social, and cultural environment of the corresponding studies. The rapid development and diffusion of technology have contributed to technology becoming an industry and a global characteristic. Access to information and communication through technology has reached a global level, and nowadays, Internet users anywhere in the world have little difference in their access to information (Callan, 2000), except in Iran, China, Democratic People’s Republic of Korea (DPNK), and so on. Therefore, there are similarities in the global culture in terms of access to resources such as technology and the Internet in SNS fatigue and PSU. However, differences can be seen in the context of economics, perception, and attitudes. Consequently, the individual possibilities and perspectives of the users can create diversity in the context of using technology (Yılmaz & Horzum, 2005).
Accordingly, it would be beneficial to investigate the differentiation of SNS fatigue based on gender in different sample groups. It is also determined that future studies could be conducted to raise awareness among female participants about PSU. However, the FoMO levels among participants did not significantly differ by gender. Similarly, it was determined that there was no significant difference between FoMO levels based on gender in a study conducted by Hoşgör et al. (2017). In other respects, it was observed that the PSU and FoMO levels of undergraduate-level university students significantly differed based on social network usage duration. Based on the findings, PSU and FoMO levels of participants who spend between 1 and 3 hr, between 3 and 5 hr, and more than 5 hr on social networks differed significantly when compared to those who spend less than 1 hr per day on social networks. The SNS fatigue levels of participants did not differ based on social network usage duration. This was similar to the finding determined in a study conducted by Elhai and Contractor (2018), in that the PSU levels of undergraduates who spent more time on social networks were significantly higher.
The SNS fatigue, PSU, and FoMO levels of participants differed significantly based on smartphone usage duration. Based on the findings, as the amount of time spent using social networks increased, SNS fatigue, and PSU also increased. Also, there was a significant difference found between the FoMO levels of those who spent between 3 and 5 hr, and more than 5 hr on smartphones when compared to those who spent less than 1 hr on smartphones; and of those who spent more than 5 hr on smartphones when compared to those who spent less than 1 hr per day on smartphones. Thus, it can be argued that SNS fatigue, PSU, and FoMO levels led to significant differences for those who spent more than 3 hr on smartphones over a short period of time, causing negative consequences. This was consistent with the findings of Wang et al. (2015), in that PSU may lead to negative consequences such as an increase in the perceived stress level. Thus, it was observed that as students spend more time on social networks, the level of PSU and FoMO increases. The awareness of undergraduate-level university students on the filtering features of social networking application could be raised to enable them to be safe from negative consequences. It was observed that the levels of SNS fatigue, PSU, and FoMO increased as the time spent on smartphones increased.
Furthermore, it was also observed that PSU and FoMO levels of undergraduate-level university students differed significantly based on the frequency of checking the media. Based on the findings, PSU and FoMO levels of those who checked their social media accounts every hour differed significantly when compared to those who checked their social media accounts every day or every other day. Furthermore, PSU levels of those who checked their social media accounts every hour differed significantly when compared to those who checked every other day. It was also found that the PSU level and FoMO levels of participants significantly differed based on the frequency of checking for calls. The PSU levels of those who checked for calls every hour differed significantly when compared to those who checked for calls every day or every other day. Furthermore, the FoMO levels of those who checked for calls every hour differed significantly when compared to those who checked for calls every other day. These results were consistent with the findings reported by Przybylski et al. (2013), when the impacts of the frequency of checking on PSU, FoMO, and SNS fatigue are examined. In other words, this finding was consistent with the finding reported by Przybylski et al. (2013) that FoMO was one of the key factors that determine social media overuse.
There was a significant and high positive correlation between SNS fatigue and PSU, and when the other variable was controlled, it was found that the correlation between the two variables had a moderate positive correlation. However, a previous study by Dhir et al. (2018) suggests that the use of social media is a mediating variable between FoMO and SNS fatigue. This means that FoMO contributes to SNS fatigue indirectly by the excessive use of social media. While there was a moderate positive correlation between FoMO and PSU in this study, when the other variable was controlled, it was observed that there was a low positive correlation between the two variables. When the multiple regression between the three variables was examined, it was observed that FoMO and SNS fatigue together predicted the PSU variable. The FoMO variable had the most significant impact on the SNS fatigue variable, followed by PSU.
These findings provide a significant contribution to the literature and support the finding that there was a significant positive correlation between problematic Internet use and FoMO reported in a study conducted by Stead and Bibby (2017) on bilateral relations. Since FoMO leads to spending more time on social networks, this can also lead to SNS fatigue in individuals, which then triggers PSU. According to Elhai et al. (2018b), excessive PSU has potential adverse outcomes in society. In this study, we examined possible predictors of PSU. The main research contribution is to determine significant predictors of PSU. However, we are aware that some limitations are possessed, nevertheless, the psychometrics of the Turkish version of the SNS fatigue scale on the basis of the findings in this study are satisfactory to measure the Turkish context. However, PSU is a cultural and technological phenomenon that is changing over time and differentiating between social groups and countries. Further studies may also aim to duplicate and expand this study by exploring characteristics of personality with the PSU in various target populations. The results of this study have significant contributions to PSU research and risk factors, but these early implications should be investigated more broadly before any potential preventive approaches are established. In addressing the issue of PSU, it is important to investigate the etiological causes and adverse effects on the lives of people. This research provides a further appreciation of gender gaps in the characteristics of young adults and PSU, in Turkey. In addition, this study is thought to have the potential to contribute in the context of Turkish culture to SNS fatigue and other variables of interest. The present findings are advantageous not only for relevant literature, theory, or practitioners, but also for precautions and confounding harmful aspects about SNS fatigue. Thus, it would also pave the door for potential work to investigate the SNS fatigue, in further studies.
Limitations
These results are limited to participants using social networks, as well as an adapted scale, the data collection tools used, and hypotheses created within the scope of the research. Moreover, the fact that the distribution of the study group by gender is not equal and the participants’ level of education is not equal may create a limitation on the results of the study in terms of generalizability. SNS fatigue, PSU, and FoMO should be investigated within different sample groups and based on different variables, and further studies are recommended on the impact and more beneficial usage of Internet technologies. The subject of this study is only Turkish university students, and the findings may not be generalized for the whole Turkish population (or others), and the current analysis should be repeated using representative samples (both Turkey and others). Our previous literature review found that the emphasis was on young adults from either the Western or East Asian countries, who attend universities. In comparison, young social media users by developing countries like Turkey, are uncommonly investigated. Correlatively, several of the preceding analyses are cross-sectional, wherein data are gathered concurrently. Repeated cross-sectional experiments should be carried out to overcome these limitations, with the same interventions being tested over time with specific focus groups in further studies. A literature review demonstrated that FoMO and PSU contributed negatively to the overall well-being levels of individuals (Stead & Bibby, 2017). This study’s findings suggested that individuals generally experience FoMO and that their Internet usage is at problematic levels in the current environment where the Internet and technology usage have become increasingly popular. In consequence, further studies focusing on the determining of underlying factors for PSU and applications that would reduce PSU among students should be conducted.
Footnotes
Declaration of Conflicting Interests
The author(s) declared no potential conflicts of interest with respect to the research, authorship, and/or publication of this article.
Funding
The author(s) received no financial support for the research, authorship, and/or publication of this article.