
Abstract
To understand behavior on social media, researchers have created and validated dozens of scales. Many can be sorted into two main categories: those that focus on the intensity of social media use and those that focus on addictive aspects. These scales tend to result in different conclusions regarding people’s well-being: studies asking about addiction find that social media use is often associated with higher reported depression scores, whereas studies focusing on intensity typically find an association with improved well-being. While these different outcomes may be explained by real underlying differences in well-being, the difference may also be due to the priming effects that addiction and intensity scales have on subsequent well-being measures. In this article, we report on two studies that examine priming effects on reported depression for these two types of social media use scales. We examine the possibility that different associations between social media and depression may be caused by the survey design itself, not by underlying differences in depression. In light of our findings, we propose that researchers investigating the relationship between social media and well-being adopt the methodology of asking questions about well-being before questions about social media use to mitigate effects of priming.
Despite intense scrutiny over the past decade, interdisciplinary scholars have made seemingly disparate claims about the association between social media use and well-being. The ongoing debate may partially be explained by the increased integration of social media into our daily lives and the challenges it poses for measuring social media use behavior. The near ubiquity of internet access and exponential increase of smartphone use over the past two decades means that social media affords substantially different user engagement compared with older media.
Researchers have employed a variety of different methods to understand the effect of using social media, defined as platforms that afford personalized profiles for self-presentation, private and public messaging capabilities, articulation of a person’s network or social ties, and a stream of frequently updated content (Verduyn et al., 2017). The most prominent methodology for studying social media use is self-report surveys. Researchers have created and validated dozens of scales emphasizing various aspects of behavior on social media that generally fall into two main categories of measurement: intensity and addiction. Intensity scales, such as the Facebook Intensity Scale (Ellison et al., 2007) and modified versions, ask participants about general aspects of social media use, such as how much time an individual spends on social media or feelings of connectedness to the platform. Other scales that focus on these constructs include the Multidimensional Facebook Intensity Scale (Orosz et al., 2016) and the Social Media Use Integration Scale (Jenkins-Guarnieri et al., 2013). Addiction scales, such as the Bergen Social Media Addiction Scale (Andreassen et al., 2016), include item wordings emphasizing negative aspects of social media use, and focus on behaviors or symptoms associated with addictive social media use. Scales such as the Social Media Disorder Scale (Van Den Eijnden et al., 2016) and the Young Internet Addiction Test (Young, 1998), modified to address social media, also measure these constructs.
Much of the research in the social media and well-being space is inconclusive when examined as a whole. Although a great deal of work indicates that there are associations between social media use and decreases in well-being (e.g., Andreassen et al., 2017; Song et al., 2014), other work suggests that social media use is correlated with increased well-being (e.g., Burke & Kraut, 2016; Dienlin et al., 2017). Recently, researchers have sought to clarify the ambiguity in prior results by emphasizing various motivations for use (Aladwani, 2014), behavioral differences on social media platforms (Metzger et al., 2018; Verduyn et al., 2017), and the potential bi-directional relationship between social media use and well-being (Heffer et al., 2019; Teppers et al., 2014).
The use of addiction and intensity scales, however, tend to result in starkly different conclusions regarding people’s well-being: studies that use addiction scales generally find that social media use is associated with negative indicators of psychological well-being, whereas studies that focus on intensity typically find mixed or no associations with negative indicators of well-being (see Table 1). The varying results of studies employing these two types of scales may be explained by real underlying differences in well-being. Alternatively, the difference may be due to priming effects in the questionnaire’s design, a common issue in survey methodology. Past work on priming effects suggests that responses to well-being questions are not independent of the measures that precede them (Schuman & Presser, 1981).
Articles investigating the relationship between social media use and depression using intensity or addiction scales.

SNS: social networking sites.
Well-being can be defined as a spectrum on which there is both the presence and absence of mental health (Keyes, 2002; Lucas & Diener, 2008). Furthermore, well-being can be construed in terms of various positive and negative indicators, such as life satisfaction or depression (Houben et al., 2015). In this article, we report on two studies that examine priming effects between reported depression, an important and common negative indicator measured in the social media and well-being literature, and these two types of social media use scales. Given the variability of outcomes in studies investigating social media and well-being, we examine the possibility that the different associations between social media use and reported depression scores may be caused by the survey design itself, and not by underlying differences in depression or social media use.
Addiction Scales
Over the past two decades, many addiction scales have been developed to help examine the negative relationship between social media use and well-being. One of the most commonly used scales is the Bergen Social Media Addiction Scale (herein referred to as the “addiction” scale; Andreassen et al., 2016). The addiction scale highlights six core components of addiction—salience, mood modification, tolerance, withdrawal, conflict, and relapse. Since their inception, the Bergen Social Media Addiction and Bergen Facebook Addiction scales have been cited over 1600 times.
Many studies that employ the lens of social media addiction when investigating the relationship between social media use and negative well-being outcomes find relatively large and negative effects. For example, Hong et al. (2014) found that individuals who reported more depressive symptoms were more likely to report higher levels of Facebook addiction. Similarly, Jasso-Medrano & López-Rosales (2018), among other scholars, also found an association between social media addiction and depression. As Table 1 makes clear, studies that used addiction scales to examine social media use and depression from 2006 to the present found that using social media is related to increased depression.
Intensity Scales
Another type of scale focuses on the intensity of one’s social media use, such as how frequently they access social media, how long they spend on different platforms or their subjective experiences of social media. One widely used scale that focuses on social media intensity is the Facebook Intensity Scale (herein referred to as the “intensity” scale; Ellison et al., 2007), which has been cited more than 10,000 times since its introduction and modified to investigate social media more broadly (e.g., Chu et al., 2016; Roberts & David, 2020). The intensity scale highlights how integrated social media is into one’s daily life by surveying how much time individuals spend on social media or the breadth of their social network online. Questions about time spent on social media, frequency of checking social media, social media network structures, and people’s subjective experience of social media encompass a great deal of the social media and well-being literature. Intensity scales attempt to measure more general patterns of social media use and do not specifically emphasize symptoms of social media addiction.
Studies that examine aspects of social media intensity, such as feelings of connectedness, find markedly smaller increases in negative well-being indicators, such as depression. There is evidence to suggest that social media use minimally correlates with negative well-being outcomes when an intensity scale is administered, as the studies listed in Table 1 make clear.
Furthermore, a recent large-scale study looking at the related topic of screen time argued that the effect size of screen use on well-being was substantially smaller than other daily activities (Orben & Przybylski, 2019). Screen time and social media use tend to be highly correlated (Sewall et al., 2020), but in many studies, it has been difficult for researchers to obtain objective measures of either, so researchers investigating these topics typically rely on self-report survey measures.
Priming Effects
Why might the findings with these two types of scales be so starkly different? We argue that the differences result from the heavy reliance on idiosyncratic survey measures with regard to scales and question wording, among other issues (Jenkins-Guarnieri et al., 2013). Although self-report methods are used in numerous areas of research and can provide accurate and reliable measurements of attitudes and behaviors (Stone et al., 1999), and are generally liked by participants (Rogelberg et al., 2001), they are subject to a variety of problematic methodological artifacts and biases especially in regard to media use (Araujo et al., 2017; Boase & Ling, 2013; Scharkow, 2019).
For example, intensity scales may not give participants an adequate opportunity to report behavior that could be considered addictive. Studies that examine how integrated social media is into a participant’s daily life, the structure of their social network, or how much time they spend on social media rarely provide an outlet for the participants to express problems they have with social media. In these instances, a participant may have addictive behaviors associated with social media, but they go undiscovered by the researcher. Studies with an addiction scale, however, may allow participants to express a more exhaustive, and therefore potentially more accurate, range of problematic behavior.
Another possible explanation for the inconclusive results regarding the association between social media use and well-being is that the survey scales may prime respondents’ answers to later questions. Priming effects have received abundant attention from questionnaire designers conducting research about attitudes, behaviors, and even demographic information (Ayidiya & McClendon, 1990; Kury, 1994; Lorenz et al., 1995; Tourangeau & Rasinski, 1988). Survey methodologists argue that something as simple as the order in which a participant answers questions on a survey can affect the answers to those questions (Tourangeau & Rasinski, 1988).
Priming can be defined as implicit memory effects in which prior exposure to certain stimuli determines, to a given extent, the response to later stimuli (Cesario, 2014). Priming largely relies on the notion of accessibility, in that earlier stimuli are more accessible in memory when later, related stimuli are present. In surveys, priming occurs when earlier questions alter responses to later items (Tourangeau et al., 2000). Survey respondents often engage in satisficing behavior (Krosnick, 2000), meaning that they often do not fully search their memory or integrate different pieces of information while providing a response to a survey question. Thus, they may draw on more easily accessible information, such as what they have been primed with, when they choose their response.
In general, respondents tend to demonstrate stronger attitudes or behaviors when primed. Priming effects have been shown in many domains of survey research, including customer service opinions and political attitudes, as well as both positive and negative well-being. Some researchers, such as Sgroi et al. (2010), argue that subjective well-being is highly stable and therefore cannot be noticeably altered as a result of priming effects. However, Fox and Kahneman (1992) found that participants who received a question about their dating life before a question about their general life satisfaction reported significant changes in life satisfaction than when the question order was reversed and the well-being question was posed first. A study by Diener (1994) regarding current mood and subjective well-being found that priming respondents to think about their mood altered the way in which they conceptualized their well-being more generally, an effect consistent with earlier work (Pavot & Diener, 1993; Schwarz & Clore, 2003; Yardley & Rice, 1991).
Priming, Mindsets, and Social Media Use’s Effect on Well-Being
Priming effects are more likely to occur when individuals “hold a subjective theory that specifies the implications of the first judgment for the second one” (Schwarz & Strack, 1991, p. 43). In psychological work, this kind of “subjective theory” is often referred to as a mindset. A particular type of belief with strong motivational value, mindsets are core assumptions about the nature and operation of things in the world that can help explain differences in people’s thoughts, feelings and behaviors (Crum et al., 2013, 2017; Dweck, 2008). Previous work has found that the mindsets about concepts such as the effects of illness and the malleability of personality can influence positive and negative indicators of well-being, including depression (Miu & Yeager, 2015; Schleider & Weisz, 2018; Yeager et al., 2013; Zion et al., 2019).
Exploring the mindsets that people have about social media may help clarify the complicated relationship between social media usage and well-being. Initial research suggests that people who have more positive mindsets of social media use report better well-being, including lesser experiences of depressive symptoms, than people who have more negative mindsets of social media (Lee et al., 2019). These kinds of beliefs affect people’s expectations, attributions, and goals, which is why mindsets about social media could be related to related to well-being. The more individuals have negative beliefs about social media—such as the belief that it is problematic—the more they may expect negative outcomes and attribute harms to their social media usage. However, having more positive beliefs about social media—such as the belief that they can use it effectively to achieve goals—may be associated with positive outcomes. These individuals may be more inclined to expect positive outcomes and attribute benefits to their social media usage.
Although these mindsets can be maintained over time, they can also be “triggered” by cues in the environment (Turnwald et al., 2019; Yeager et al, 2019). Numerous interventions have leveraged this malleability to enhance participants’ well-being by changing their mindset (Schleider & Weisz, 2017; Walton & Wilson, 2018; Yeager et al., 2016, 2019). Often using guided questions or writing activities, these interventions work in part by making a particular mindset more salient and accessible to the participant—some of the same processes that facilitate priming effects in survey methodology. Cues embedded in addiction and intensity social media surveys may influence the mindsets that shape how people think about their own social media use and well-being.
Study 1
In this study, we examined whether addiction and intensity scales have priming effects that influence self-reported well-being. We asked participants to complete either an intensity scale, an addiction scale, or no scale (control) before completing a well-being scale. The intensity scale we used was a modified version of the Facebook Intensity Scale (Ellison et al., 2007) and the addiction scale we used was a modified version (Andreassen et al., 2016) of the Bergen Facebook Addiction Scale (Andreassen et al., 2012). Both of these modified instruments are commonly used in the social media literature (Hancock et al., 2019) and focus on social media more broadly as opposed to only Facebook.
For the well-being measure, we focused on depression for several reasons. First, well-being can be conceptualized on a continuum, on which there is both the presence of mental health on one end of the spectrum and the absence on the other (Keyes, 2002). More recently, Houben et al. (2015) as well as Schmitt et al. (2014) have discussed how constructs of psychological well-being on this spectrum can focus on positive indicators of psychological benefits (e.g., hedonic, eudaimonic and social well-being) and negative indicators of psychological distress (e.g., symptoms of anxiety, loneliness, or depression). Unlike other well-being indicators, such as anxiety (Spielberger, 2010) or mood (Eid & Diener, 2004), symptoms of depression are relatively stable and less susceptible to situational changes. Therefore, depression scores should be less susceptible to priming effects. Second, we selected depression as it is an important dimension of well-being commonly examined in relation to social media use (see Table 1). Third, we used the Beck Depression Inventory (herein referred to as the “depression” scale; Beck et al., 1996), a well-validated and highly reliable instrument which is frequently used in studies about social media use and well-being. Although the depression scale is used for screening for clinical depression, it is also used to identify subclinical levels of depressive symptoms as a negative indicator of well-being (Fischer & Boer, 2011; Steptoe et al., 2007; Van Hemert et al., 2002).
We expected that asking participants to respond to an addiction social media scale before completing the depression scale would increase reported depression scores relative to participants who first responded to an intensity scale. We therefore hypothesized:
H1. Participants who complete the addiction scale first will report higher depression scores than participants who answer the intensity scale first.
If the social media scale types differentially influence self-reported depression, then it is important to understand if any social media mindsets play a role in this relationship. We measured participants’ social media mindsets to examine whether the two scales encourage different mindsets about the relationship between social media use and well-being. For example, given that the addiction scale focuses on a participants’ lack of agency when using social media, this scale may be associated with a negative mindset about social media. It is less clear, however, whether an intensity scale will be associated with a positive mindset about social media. Given that this intensity scale focuses on how people use social media to connect with their friends, which is a goal that many social media users strive for, it may emphasize more agency and positive attitudes toward social media. Thus, we ask:
RQ1. How does exposure to the addiction and intensity scales influence social media mindsets?
We were also interested in the relationship between mindsets about social media and reported depressive symptoms. Preliminary work (Lee et al., 2019) suggests that negative social media mindsets are predictive of greater reported depression, whereas positive social media mindsets are associated with a decrease in reported depression. Therefore, we ask:
RQ2. How are social media mindsets associated with reported depression?
If we find that there is a direct effect of social media use scales on reported depression, then an important question is whether social media mindsets mediate the effect of scale type on depression scores. Previous work has found the mindsets people can affect self-reported depression by orienting people to more or less adaptive ways of understanding their experiences (Zion et al., 2019). If social media use scales emphasize certain mindsets about the effects of social media (e.g., addiction scales prime negative social media mindsets and intensity scales prime positive social media mindsets), then social media mindsets are likely to be the “subjective theory” or mechanism through which priming effect operates in these studies. Therefore, we predict that:
H2. A positive social media mindset will mediate the priming relationship between the intensity scale and depression scores, and a negative social media mindset will mediate the priming relationship between the addiction scale and depression scores.
Method
Participants
We recruited 279 participants within the United States who spoke English from Amazon Mechanical Turk (AMT) in September 2019 after conducting an a priori power analysis indicating a required sample of 207 (expected effect size = .25, α = .05, power = .90). Seventeen participants were excluded for incomplete survey responses, such as failing to complete questions, answering free-response questions in another language, as well as writing minimal (e.g., one to five words) or irrelevant content for free-response questions. The final sample was 262 participants (53.8% female; 69.1% White). The average age of participants was 30 years old (SD = 8.6). Although prior work has indicated that AMT samples do not necessarily represent the general US population along certain demographic dimensions (Levay et al., 2016), there is evidence to suggest AMT samples can produce high-quality data, especially when researchers are interested in classical findings in psychology or behavioral economics (e.g., priming; Horton et al., 2011).
Procedure
This study received institutional review board (IRB) approval in August 2019. Participants read a consent form about our study and if they indicated their agreement with the form, they proceeded to the rest of the questionnaire. The survey took approximately 15 minutes to complete, and workers were compensated US$1.50 for their participation. In our between-subjects design, participants were randomly assigned to one of three conditions; the primary manipulation was the social media use scale type administered before the depression scale. In all conditions, participants first answered a series of demographic questions. In the addiction + depression scales condition (n = 87), participants completed the addiction scale before completing the depression scale. In the intensity + depression scales condition (n = 89), participants completed the intensity scale before the depression scale. In the control condition (n = 86), participants only completed the depression scale. At the end of the survey, all participants answered the Social Media Mindsets Scale. In addition, all participants were asked to take a screenshot of their weekly average screen time on their phone.
Measures
The full set of survey items is available through the following link: https://bit.ly/32DZtba.
Addiction Scale
The 18-item Bergen Social Media Addiction Scale measures social media addiction (Andreassen et al., 2016). It has three items for each of the six elements of addiction: salience, modification, tolerance, withdrawal, conflict, and relapse. All items were on a 5-point Likert-type scale anchored by “Never” and “Always.” Example items include: “How often during the last year have you spent a lot of time thinking about social media or planned use of social media?” “How often during the last year have you spent more time on social media than initially intended?” “How often during the last year have you decided to use social media less frequently, but not managed to do so?” On average, participants reported low to moderate amounts of addiction (M = 2.25, SD = 0.73).
Intensity Scale
The 8-item Social Media Intensity Scale measures the intensity of one’s use by assessing the strength of their emotional attachment to their social media (Ellison et al., 2007). We used a modified scale to encompass all social media use, not just Facebook. All items were on a 5-point Likert-type scale anchored by “Strongly Disagree” and “Strongly Agree.” A sample item is “I’m proud to tell people I’m on social media.” On average, participants had moderately intense use (M = 3.80, SD = 1.04).
Well-Being Measure
Depression was assessed with the 21-item Beck Depression Inventory, which measures emotional, cognitive, and physical symptoms of depression, such as hopelessness, irritability, guilt, fatigue, and weight loss (Beck et al., 1996). All questions were rated on a 0–3 Likert-type scale and then summed within each participant. Standardized cutoffs used to assess the severity of depression are 0–13 (minimal depression), 14–19 (mild depression), 20–28 (moderate depression), and 29–63 (severe depression) (Beck et al., 1996). On average, participants reported minimal depression (M = 11.47, SD = 9.30), consistent with the level of reported symptoms in the general population (Van Hemert et al., 2002).
Social Media Mindset Scale
Participants’ social media mindsets were assessed with the 22-item Social Media Mindsets Scale, which measures the extent to which participants have positive or negative mindsets about social media (Lee et al., 2019). People with more positive social media mindsets believe that social media is a helpful, beneficial tool that helps them achieve their goals, whereas people with more negative social media mindsets believe that social media is harmful and can control and influence their behavior. For each participant, the scale produces a score for the extent to which people believe that social media is positive (M = 4.82, SD = 0.95) and that social media is negative (M = 3.58, SD = 0.95). Positive social media mindset scores are calculated by taking the average of 13 items related to the extent to which individual thinks social media is a tool that improves their relationships, communication, learning, and growth. Negative social media mindset scores are calculated by taking the average of 9 items related to how much an individual feels they struggle to manage the negative effects of social media on their relationships, communication, and productivity. Both mindset scores had good reliability (Cronbach’s α = .89 and α = .82, respectively).
Screen Time
We collected an objective measure of participants’ daily average screen time by asking them to send a screenshot of their Apple Screen Time report after personally identifying information had been removed. A total of 187 participants submitted a screenshot of their Apple Screen Time, so only these participants were included in analyses regarding screen time. The time was converted into total minutes for data analysis.
Results
Does exposure to addiction versus intensity scales influence subsequent self-reported depression? H1 predicted that completing an addiction scale compared to an intensity scale would increase reported depression scores. A one-way analysis of variance (ANOVA; addiction scale vs intensity scale vs control) revealed a main effect of scale type on depression scores. Post hoc comparisons using the Tukey honestly significant difference (HSD) test indicated that participants who completed the intensity scale (M = 9.69, SD = 8.71) reported significantly less depression (p < .05, d = .36) than those who completed the addiction scale (M = 12.99, SD = 9.66) in support of H1 (see Figure 1).

Effect of condition on mean depression score (SE) in Study 1.
One question is how the addiction and intensity scales compared with the control condition. Although neither scale was statistically different from the control, numerically the addiction scale condition had higher depression scores, while the intensity scale had lower depression scores, suggesting that both scales moved depression scores away from the no-scale control condition.
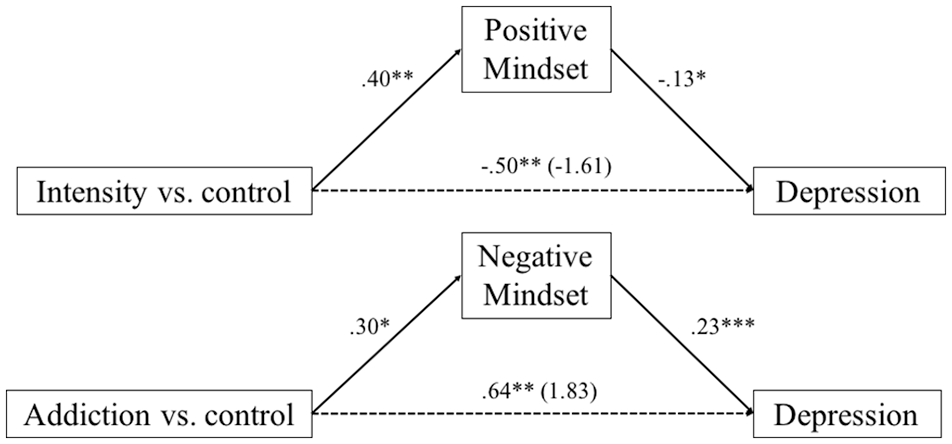
To answer further research questions and hypotheses, we used the Hayes Process Model 4 (Hayes, 2017) to run two mediation models, one for each mindset (positive and negative), where scale type was treated as the independent variable, depression score as the dependent variable, and mindset (positive or negative) as the mediator. Given that scale type influenced depression scores, we next asked if scales also affected social media mindsets (RQ1). First, we found that the scale that participants responded to significantly predicted a positive social media mindset, R = .16, adjusted R2 = .03, F(2, 259) = 3.64, p < .05. Participants assigned to the intensity + depression scales condition (M = 4.99, SD = 0.83) believed that social media was positive more than those assigned to the control condition M = 4.61, SD = 1.04, β = .40, SE = .14, t(259) = 2.69, p < .01, while participants assigned to the addiction + depression scales condition did not believe that social media was positive to a greater extent than those in the control condition, β = .23, SE = 0.14, t(259) = 1.56, p = .12.
We found that the scale that participants responded to also significantly predicted a negative social media mindset in that participants assigned to the addiction + depression scales condition had higher negative social media mindset scores than those assigned to the control condition, β = .30, SE = .15, t(259) = 2.01, p < .05, while participants assigned to the intensity + depression scales condition only had marginally higher negative social media mindset scores than those in the control condition, β = .27, SE = .15, t(259) = 1.78, p = .07.
Next, we were interested in the association between social media mindsets and depression scores (RQ2). Positive social media mindset scores were associated with decreased depression, β = –.13, SE = .60, t(259) = –2.16, p < .05, while negative social media mindsets scores were associated with increased depression, β = .23, SE = .57, t(259) = 3.68, p < .001.
Finally, we tested whether these social media mindsets mediated the effect of scale type on depression scores (H2; see Figure 2). Unstandardized coefficients and bias-corrected 95% confidence intervals based on 5000 bootstrap samples were employed to determine the significance of the effects. Our predictor variable was multi-categorical, so we dummy-coded condition into two dichotomous variables. For the positive social media mindset mediation, intensity scale versus control was treated as the primary independent variable, depression score as the dependent variable, and positive social media mindset as the mediator. For the negative social media mindset mediation, addiction scale versus control was treated as the primary independent variable, depression score as the dependent variable, and negative social media mindset as the mediator.
The relative indirect effect of condition on depression as mediated by positive social media mindset was significant between the intensity scale and control condition (b = –0.50, SE = .28, 95% CI = [–1.10, –0.03]). The direct effect of condition (intensity + depression scales vs control) on depression score was not significant (b = –1.61, SE = 1.41, p = .25, 95% CI = [–.17, 1.16]), suggesting full mediation. These findings reveal that being asked to complete an intensity scale significantly increased participants’ positive social media mindsets, which then decreased their self-reported feelings of depression.
For the negative social media mindset mediation analyses, the relative indirect effect of condition (addiction + depression scales vs control) on depression was significant (b = 0.64, SE = .37, 95% CI = [0.01, 1.42]). The direct effect on depression as mediated by mindset was insignificant (b = 1.83, SE = 1.38, 95% CI = [–0.88, 4.55]), suggesting full mediation. These results reveal that completing an addiction scale significantly increased participants’ negative social media mindsets, which then increased participants’ self-reported feelings of depression.
Finally, we analyzed the screen times provided by the participants to see if there was any difference across conditions that might explain our effects. The analysis revealed that there was no significant difference in screen time between the three conditions, F(2, 184) = 0.57, p = .57, indicating that participants’ amount of smartphone use did not meaningfully influence our results.
Study 2
The results of Study 1 suggest that the kinds of measures researchers employ to assess social media use can significantly prime participants’ self-reported depression scores. The results also reveal that this effect is due to how the scales influence the social media mindsets that participants hold. Participants who completed the intensity scale, which asks about the role of online friendships and community in their lives, had more of a positive social media mindset, which mediated the effect of the scale on depression scores. In contrast, participants who completed the addiction scale, which emphasizes symptoms of addictive social media use, had more of a negative mindset toward social media, which mediated the effect of the scale on depression scores.
It is important to note that these priming effects were observed with the Beck Depression Inventory, a reliable and validated instrument of depression (Beck et al., 1996). Furthermore, depression is conceptualized as a relatively stable well-being dimension, suggesting that this kind of effect might be greater on more situational and less stable well-being types, such as anxiety or mood (Eid & Diener, 2004; Spielberger, 2010). As such, the observed priming effects may underlie some of the differences observed in well-being outcomes between intensity and addiction scales, compromising our ability to understand the relationship between social media use and well-being.
Past work on priming effects suggests that priming can be mitigated in certain conditions. For example, Fox and Kahneman (1992) argued that asking about social comparison before a seemingly unrelated measure of global satisfaction did not necessitate that the participant consider their levels of global satisfaction while answering the social comparison measure. Thus, they found weak priming effects with this question order. In the present context, asking about depression first may not necessitate the participant considering their levels of social media use. This research suggests that responding to well-being measures first could attenuate the effects of priming from social media use scales. If this were the case, then it is important to test whether responding to the outcome measure (e.g., the depression scale) first would not influence responses to the depression scale or the subsequent social media use scale, thus provide a potential solution to the issue of priming in surveys about social media use and well-being.
It is possible, however, that participants could engage in cognitive dissonance reduction (Festinger, 1962) to rationalize their responses to the well-being measure when they respond to the social media use scale second (e.g., “I’m feeling depressed, I must have used social media a lot”). In this case, a participant might provide stronger responses to the intensity scale if they report lower depression scores, or stronger responses to the addiction scale if they report higher depression scores. Other research has shown that self-reports about media use can indeed be primed. For example, Cheng et al. (2019) found that people exposed to news reports about social network site addiction reported more symptoms of problematic internet use, suggesting that priming of self-reported media use is possible. We therefore tested whether reversing the order of the well-being and use measures could eliminate priming effects:
RQ3. Will responding to the depression scale first affect responses to the intensity or addiction scales?
Method
Participants
After conducting an a priori power analysis (expected effect size = .5, α = .05, power = .9) indicating a required sample size of 344, we recruited 419 participants within the United States who spoke English from AMT. Nineteen were excluded for incomplete survey responses, such as failing to complete questions, answering free-response questions in another language, as well as writing minimal (e.g., one to five words) or irrelevant content for free-response questions. In total, we had 400 participants in our final sample (56.8% female; 66.5% white). The average age of participants was 32 years old (SD = 9.76).
Procedure
The instructions, consent and debriefing protocol was the same as Study 1. In our between-subjects design, participants were randomly assigned to one of four conditions. All participants first answered a series of demographic questions. In the depression + addiction scales condition (n = 107), participants completed the depression scale before completing the addiction scale. In the addiction scale-control condition (n = 107), participants completed only the addition scale. In the depression + intensity scale condition (n = 95), participants completed the depression scale before completing the intensity scale. In the intensity scale-control condition (n = 91), participants completed only the intensity scale.
Measures
The same measures administered in Study 1 were administered in Study 2. In all conditions, after completing the social media use scale, participants were also asked “In the past week, on average, approximately how many minutes per day have you spent on social media?” to obtain a subjective measure of time spent on social media to complement the objective screen time measure.
Results
First, we found that there were no significant differences in screen time, F(3, 396) = 1.69, p = .17, or self-reported time spent on social media, F(3, 396) = 0.41, p = .75, suggesting that random assignment was effective across conditions. The correlation between screen time and self-reported time spent on social media was r = .05 (p = .36). There were also no significant differences in reported depression between the two conditions that received the depression scale (depression + addiction scales and depression + intensity scales conditions, t(190) = 0.12, p = .91. To answer RQ3, we first examined whether responding to the depression scale before the addiction scale affected addiction scores relative to only completing the addiction scale. We found that there was no significant difference in reported social media addiction between the depression + addiction scales (M = 2.19, SD = 0.77) and addiction scale-control conditions (M = 2.28, SD = 0.78), t(210) = –0.90, p = .37, suggesting that there was no priming effect of depression reporting on the addiction score (see Figure 3).
Social media mindset mediation.
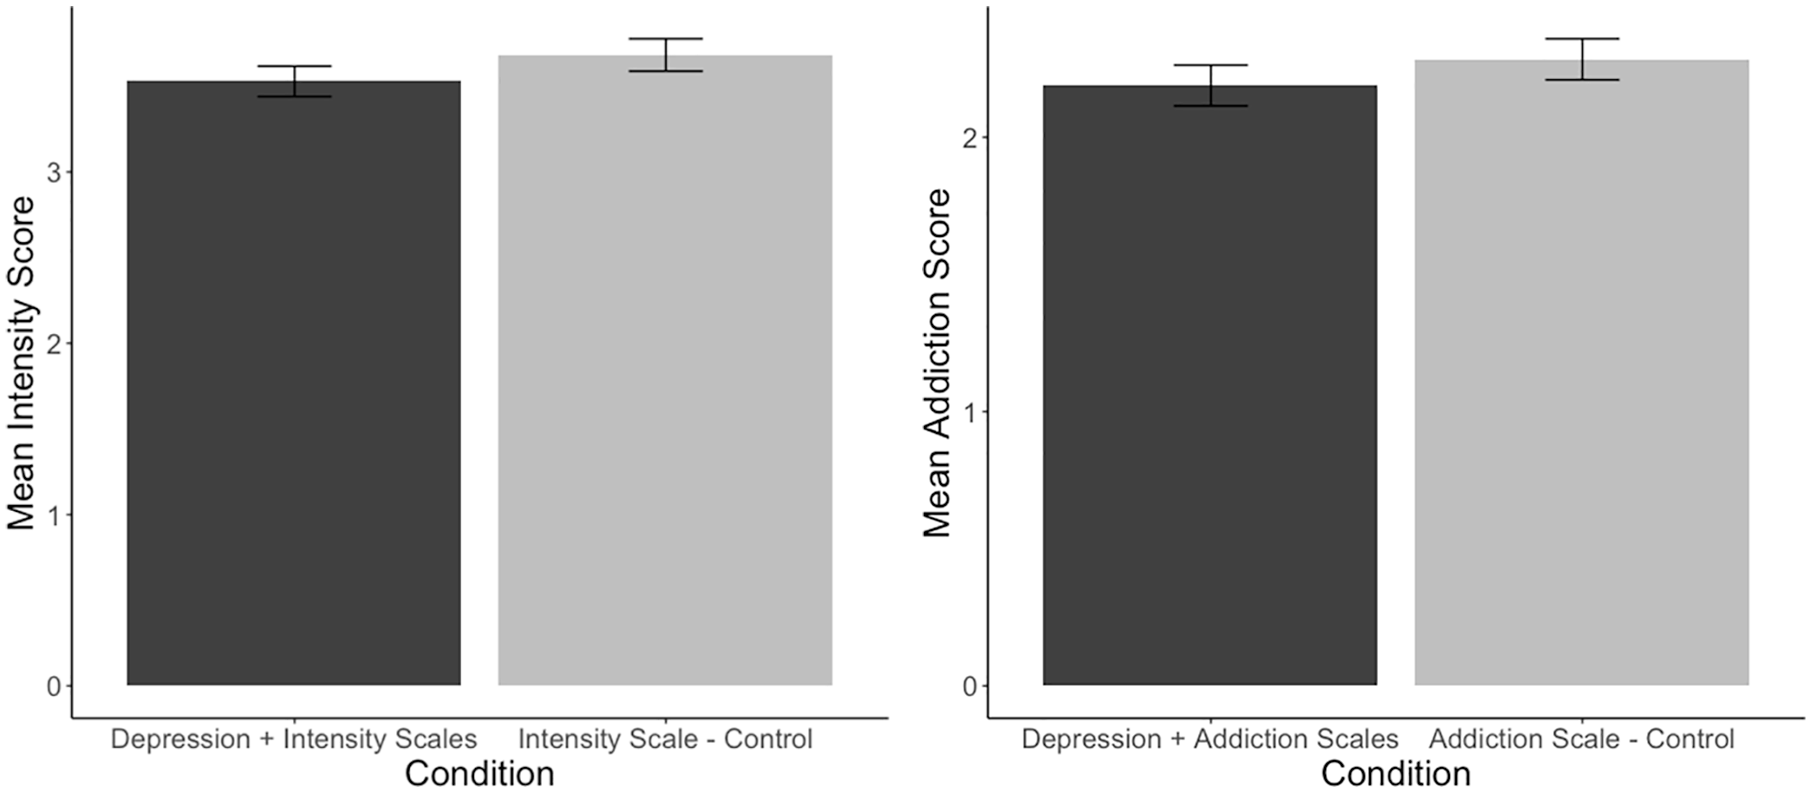
Effect of condition on mean intensity and addiction scores (SE) in Study 2.
Next, we examined the effect on the intensity scale. Similarly, we found no significant differences, t(180) = –1.19, p = .24, in reported social media intensity between the depression + intensity scales (M = 3.53, SD = 0.86) and intensity scale-control (M = 3.68, SD = 0.90) conditions. These results suggest that structuring a survey so that a depression scale precedes social media use scales reduces the impact of priming effects (see Figure 3).
General Discussion
In these studies, we found that people reported significantly higher depression when they were asked to complete an addiction scale before a depression scale than when they completed an intensity scale before a depression scale. This effect was mediated by changes in the mindsets they had about social media. When people were exposed to a scale that focused on the addictive nature of social media use, they subsequently adopted more negative mindsets about social media and reported more depressive symptoms. However, people who were exposed to an intensity scale, focusing on the ability of social media to connect them to friends and communities, adopted more positive mindsets about social media and reported fewer depressive symptoms. However, when participants were asked about their depressive symptoms first, before being exposed to an addiction or intensity scale, there were no significant differences in their reported use of social media, even with sufficient power to detect null results.
These results suggest that social media use measures can prime participants’ responses to well-being measures, and that differences in reported depression may not be due to true differences in depressive symptoms. The Bergen Social Media Addiction Scale asks participants to what extent they have “used social media to reduce feelings of guilt, anxiety, helplessness, and depression,” “felt that [they] had to use social media more and more to get the same pleasure from it,” and “used social media so much that it has had a negative impact on [their] job/studies.” Although some questions focus on intensity—like whether or not the participant has “thought a lot about what has happened on social media recently”—the scale asks participants to quantify how addicted they are without creating space for participants to say whether or not they feel addicted, a process that may encourage a negative social media mindset.
However, social media use measures with a focus on intensity, such as the Social Media Intensity Scale, asks respondents to report the time they spend on social media (“In the past week, on average, approximately how many minutes per day have you spent on social media?”) and their network size (“About how many total friends do you have on social media?”) in addition to their subjective experience (“Social media is part of my everyday activity”). The statements in the intensity scale about the participants’ subjective experience emphasize positive aspects of social media use, like the potential for connectedness. These studies suggest that this positive emphasis primes participants to report fewer depressive symptoms, a process that may encourage a positive social media mindset.
These social media mindsets appear to be meaningfully related to participants’ experience of depressive symptoms, which is consistent with mindset research in other domains that finds effects on how people experience and report their well-being. If a participant is primed to think about intensity versus addictive aspects of social media use by survey items, they may endorse more positive or negative social media mindsets—beliefs which may persist beyond the course of the study. Further research in this area would benefit from psychometrically validated measurements of social media mindsets.
Although these studies only focused on the impact of social media use measures on one negative well-being indicator (depression), it is likely that these effects can generalize to other negative indicators of well-being as well. We provide evidence that the Beck Depression Inventory, which is a reliable, stable, commonly used and well-validated instrument to measure depression (Beck et al., 1996), is susceptible to priming effects. Other instruments that measure indicators that are more vulnerable to short-term situational changes could be subject to stronger priming effects. Past research has also suggested that priming can occur when measuring positive indicators of well-being (Diener, 1994).
Hundreds of researchers studying social media and well-being have employed survey methodology in their studies, and a great deal of this work relies on either addiction or intensity scales. The Bergen Social Media Addiction Scale and Social Media Intensity Scale, as well as modifications of these scales, are two of the most common measures of social media use; combined, they have been cited nearly 15,000 times since their introduction. Other scales are highly similar to these two, emphasizing subjective experiences of social media use, as well as other measures like time spent on social media, frequency of logins and network metrics (Hancock et al., 2019).
In light of the current results, it is clear that researchers measuring social media use with self-report scales need to consider the effects of priming. Although the average depression scores in the intensity + depression scales and addiction + depression scales conditions in Study 1 only differed by 3.3 points, an increase in depression score may mean qualitatively different life experiences: “worry[ing] about physical problems” as opposed to being “no more worried about [their] health than usual” or “not enjoy[ing] things the way [they] used to” as opposed to “get[ting] as much satisfaction out of things as they used to.” To mitigate priming effects, researchers should administer a well-being scale, or any dependent variable that is assumed to be related to social media, before any social media use scale is completed. Our work demonstrates that there were no significant differences in responses to the depression, addiction or intensity scales when the depression scale was provided first in the survey.
Unfortunately, the majority of studies do not report the order in which participants answer survey questions. For example, none of the studies conducted since 2006 that used the Bergen Facebook Addiction Scale, or a modification, to examine the relationship between addictive social media use and depression reported the order in which they administered the instruments (Hancock et al., 2019). Thus, we also argue that it is important for researchers to report their survey question order in their methods, in addition to providing the full survey in their appendix or supplementary materials. This advice is in line with other suggestions that promote open science best practices (Nosek et al., 2015).
Limitations
This study used two prominent scales to measure social media use: the Social Media Addiction and Social Media Intensity scales. Many researchers have used these scales, or similar ones, to make claims about the associations between social media and well-being. However, it is not clear if priming effects on depression scores would have been as strong if the participants did not answer any questions about their subjective experience of social media. It is possible that questions about time, frequency, and network metrics do not have as strong of a priming effect on later questions. In addition, even though the above scales are well-validated, scholars of social media and well-being should critically consider when they are appropriate for their research questions of interest, and what their strengths and weaknesses are as measurements.
Relatedly, researchers with access to data that do not rely on self-report estimates of time spent on one’s smartphone or social media platforms (e.g., Ernala et al., 2020; Reeves et al., 2019) may be able to more accurately capture the relationship between social media use and well-being because objective measures of media use are not subject to the myriad of biases affecting self-reported media use (Boase & Ling, 2013; Ellis, 2019; Junco, 2013). Although screen time and social media use are positively related (Sewall et al., 2020), we could not access both objective and subjective measures of each and were only able to obtain objective screen time measures from Apple users. However, the results of Studies 1 and 2 indicate that there were no significant differences in the objective measure of screen time and/or subjective measure of time spent on social media across conditions. This finding suggests that “time spent” is unrelated to intensity, addiction or depression scores in our studies. Future work could further investigate the relationship between objective and subjective screen time and social media use measures, as well as examining the potential differences between users of different operating systems.
Another limitation is that depression is only one of many well-being indicators of interest to social media researchers. Gaining additional clarity about the relationship between social media and the entire spectrum of well-being, including both positive and negative indicators, as well as the influence of priming effects in this research area, is a crucial next step for the development of the field. More broadly, future research should also look at how priming effects may be related to other outcome domains, such as social capital.
Conclusion
Our studies suggest that the type of social media use scale that a participant responds to can prime their responses to a depression scale and a social media mindset scale later in the study. However, we did not find evidence that the reverse is true: responses to the depression scale did not prime answers to social media use scales later in the survey. In light of these results, we propose that researchers investigating the relationship between social media and well-being using survey methodology ask questions about well-being before questions about social media use. Aligned with advice regarding open science best practices, we also encourage researchers to provide access to their full questionnaires and report the order in which participants responded to various items.
Footnotes
Declaration of conflicting interests
The author(s) declared no potential conflicts of interest with respect to the research, authorship, and/or publication of this article.
Funding
The author(s) received no financial support for the research, authorship, and/or publication of this article.