
Abstract
Transitivity, defined as the tendency for node A to be connected to node B given that A is connected to node X and X is connected to B, has been found to be a strong predictor of tie formation in various types of social networks. As transitive ties can influence information sharing, diffusion, and attitudes toward messages, understanding the motivations and mechanisms behind transitive tie formation in online social networks (OSNs) is important. Using a large longitudinal dataset from a popular OSN, Twitter, we examine the factors affecting transitivity. Results show that the strength of ties, activity like the number of tweets, and most importantly, the number of common connections are key factors affecting transitive tie formation. Theoretical implications regarding the evolution of network structure and polarization of views as well as practical suggestions for organizations aiming to accumulate followers for information sharing are discussed.
Online social networks (OSNs) allow users to communicate and form relations with other users. These relations provide users with both instrumental and expressive benefits, such as information access and community formation. At the aggregate level, these relations give rise to structures in social networks. A social network is defined as a set of social entities, such as people or organizations, connected by a set of social relations, such as friendship, co-work, or information exchange (Wasserman & Faust, 1994). The structure of social networks at various levels including reciprocity (the extent to which ties among two people are mutual), transitivity (the extent to which ties among three people form a triangle structure), and small-world structure (the extent to which most people in a network can be reached in a small number of steps) influences the way in which information, support, and resources are transmitted (Monge & Contractor, 2003).
Transitivity is an important property in social networks. Transitivity has been long known as an important driver of interpersonal tie creation, often becoming the building block of larger structures such as groups and communities (Faust, 2010; Golder & Yardi, 2010; Lönnqvist et al., 2014). A study of four OSNs including LinkedIn™, Delicious™, Flickr™, and Yahoo! Answers™ found that 30%–60% of the new edges are transitive ties and closed triangles, underscoring the importance of transitivity (Leskovec et al., 2008). Likewise, other studies have found the principle of transitivity applies in 70%–80% of all cases in a variety of small group situations (Davis, 1970; Robinson & Balkwell, 1995). Transitivity is also found to be prominent in friendship networks, supply networks, and community rebuilding (Choi & Wu, 2009; Gulati & Gargiulo, 1999; Nakazato & Lim, 2017).
Much theorizing has been done about the generating mechanisms of transitivity, including the psychological and social motivations behind a triad to become closed (Brodt & Neville, 2013; Lee & Monge, 2011; Tse et al., 2013). Yet, relatively little is known about the extent to which the different theoretical mechanisms apply to online social networking platforms like Twitter™. The current study examines both the structural characteristics of ties and the attributes of users in the triad as potential determinants of transitivity in Twitter. Twitter is predominantly an asymmetric network and encourages users to establish a one-way relationship known as follow (Java et al., 2007; Joinson, 2008; Kwak et al., 2011). This “follow” mechanism is essential for receiving and monitoring information that could possibly be of a user’s interest.
On Twitter, transitivity refers to the tendency for a user A to follow user B given that A follows user X and X follows B (see Figure 1; this notation of A, X, and B in a given triad will be used throughout the article). Transitive ties have significant implications on Twitter given its role as an information network, since the ways ties are structured impact how information flows on the platform, which can in turn influence users’ formation of attitudes and opinion toward various social issues. For example, assuming that user B holds useful information, the information could flow quicker and more reliably if user A follows B and directly views B’s tweets in comparison with relying on X to mediate the information. As another example, assuming that B tweets a potentially persuasive message, if A views B’s tweet both directly and indirectly through X who retweets B’s tweet, A’s increased exposure to the message and trust in X could make A hold a more positive attitude toward the message. Therefore, examining the factors that lead to the formation of a shorter path between A and B in which A directly follows B rather than through a mediator, X, has important implications. Given this motivation, the current study assesses the relative contribution of various theoretical mechanisms behind transitivity on Twitter. Dataset including tens of millions of users and tweets observed at two time points was utilized in a set of regression models to test the predictors of newly formed transitive ties.

A transitive triad on Twitter.
Theoretical Background and Prior Work
Transitivity is observed in various contexts including organizational collaboration networks, alliances among nation states, and in investment decisions of venture capitalists (Atouba & Shumate, 2010; Batjargal, 2007; Hafner-Burton et al., 2009). Some of the benefits of transitive ties include cooperation, interpersonal trust, positive interpersonal sentiment, and enforcement of norms (Coleman, 1990; Heider, 1958). Existing studies developed a range of theoretical mechanisms for explaining transitivity in social networks (Faust, 2010; Grund & Densley, 2015; Monge & Contractor, 2003). One of them is social balance theory, which posits that social actors use balance criteria to form or change their social arrangements when their social choices cause cognitive dissonances or psychological tensions (Hummon & Doreian, 2003). For instance, if A holds a favorable attitude toward X and X holds a favorable attitude toward B, A would be motivated to form a favorable attitude toward B as well. Similarly, when there are disagreements between friends or if a friend’s friend is an enemy, one will try to make rearrangements to their social relationships to achieve balance (Brodt & Neville, 2013).
Tie strength has been postulated as a force behind triad formation, and in general, triads with stronger ties tend to have higher transitivity (Granovetter, 1973). Suggesting that the strength of an interpersonal tie is influenced by the amount of time, emotional intensity, intimacy, and reciprocal services between people, Granovetter (1973) demonstrated that transitivity is a function of the strength of ties, rather than a general feature of social structure. Louch (2000) also found the strength of ties as an important factor contributing to transitivity along with homophily (i.e., similarity breeds connection) and focus constraints (i.e., people having shared roles or belonging to similar arenas of social life).
In the context of undirected triads in inter-organizational alliances, the probability of an alliance is found to go up with the number of indirect alliances (Gulati & Gargiulo, 1999). When two organizations share a number of common connections, they can gather information about each other to see if they are suitable. Social control mechanisms operate as well, in the sense that they tend to behave better as inappropriate behavior can be reported to the common partners.
In the context of Twitter, Lou et al. (2013) studied factors affecting reciprocity and transitivity. However, they studied only a specific case where reciprocal relationships evolved into transitive triads. The authors found that link homophily (number of common connections), status homophily (users having similar social status), and social balance theory help predict transitivity. They also found that A being an elite (high prestige) user is positively correlated with transitivity and X being an elite user is negatively correlated with transitivity. Hutto et al. (2013), in a study which examined the factors that predict the growth of followers on Twitter, showed that network structure needs to be considered along with the volume and forms (e.g., replies, mentions) of tweets and the content of messages. In particular, the number of common neighbors between two users was found to be a significant factor behind the formation of follow ties.
Hypotheses
We examine the structure of ties as well as the attributes of nodes in triads as potential determinants of transitivity (see Figure 2 for an illustration of each hypothesis). The first structural factor is reciprocity, which means that node A and X follow each other. Reciprocity is a prevalent mechanism in both offline contexts and OSNs (Mollica et al., 2003; Surma, 2016) and has been considered a universal norm (Gouldner, 1960). Reciprocated ties indicate the possibility that the two users are friends or acquaintances, or have shared interests or tastes that motivate them to follow each other. Presumably, reciprocated ties have a higher likelihood of having been created based on homophily (McPherson et al., 2001). Reciprocity suggests an interest in similar information sources. On Twitter, Hopcroft et al. (2011) and Lou et al. (2013) discovered evidence in support of social balance theory, showing reciprocal (two-way) relationships lead to formation of social triads. The users X follows (Bs) are visible to A, if A views X retweeting B’s tweets or simply if A browses through the list of users X follows. Thus, A can easily recognize the sources of information that are potentially useful or interesting to them. Triads with strong ties (like reciprocity) are also expected to have a higher transitivity (Granovetter, 1973). Based on these mechanisms, it is proposed that:
H1: Reciprocity between users A and X will be positively correlated with transitivity.
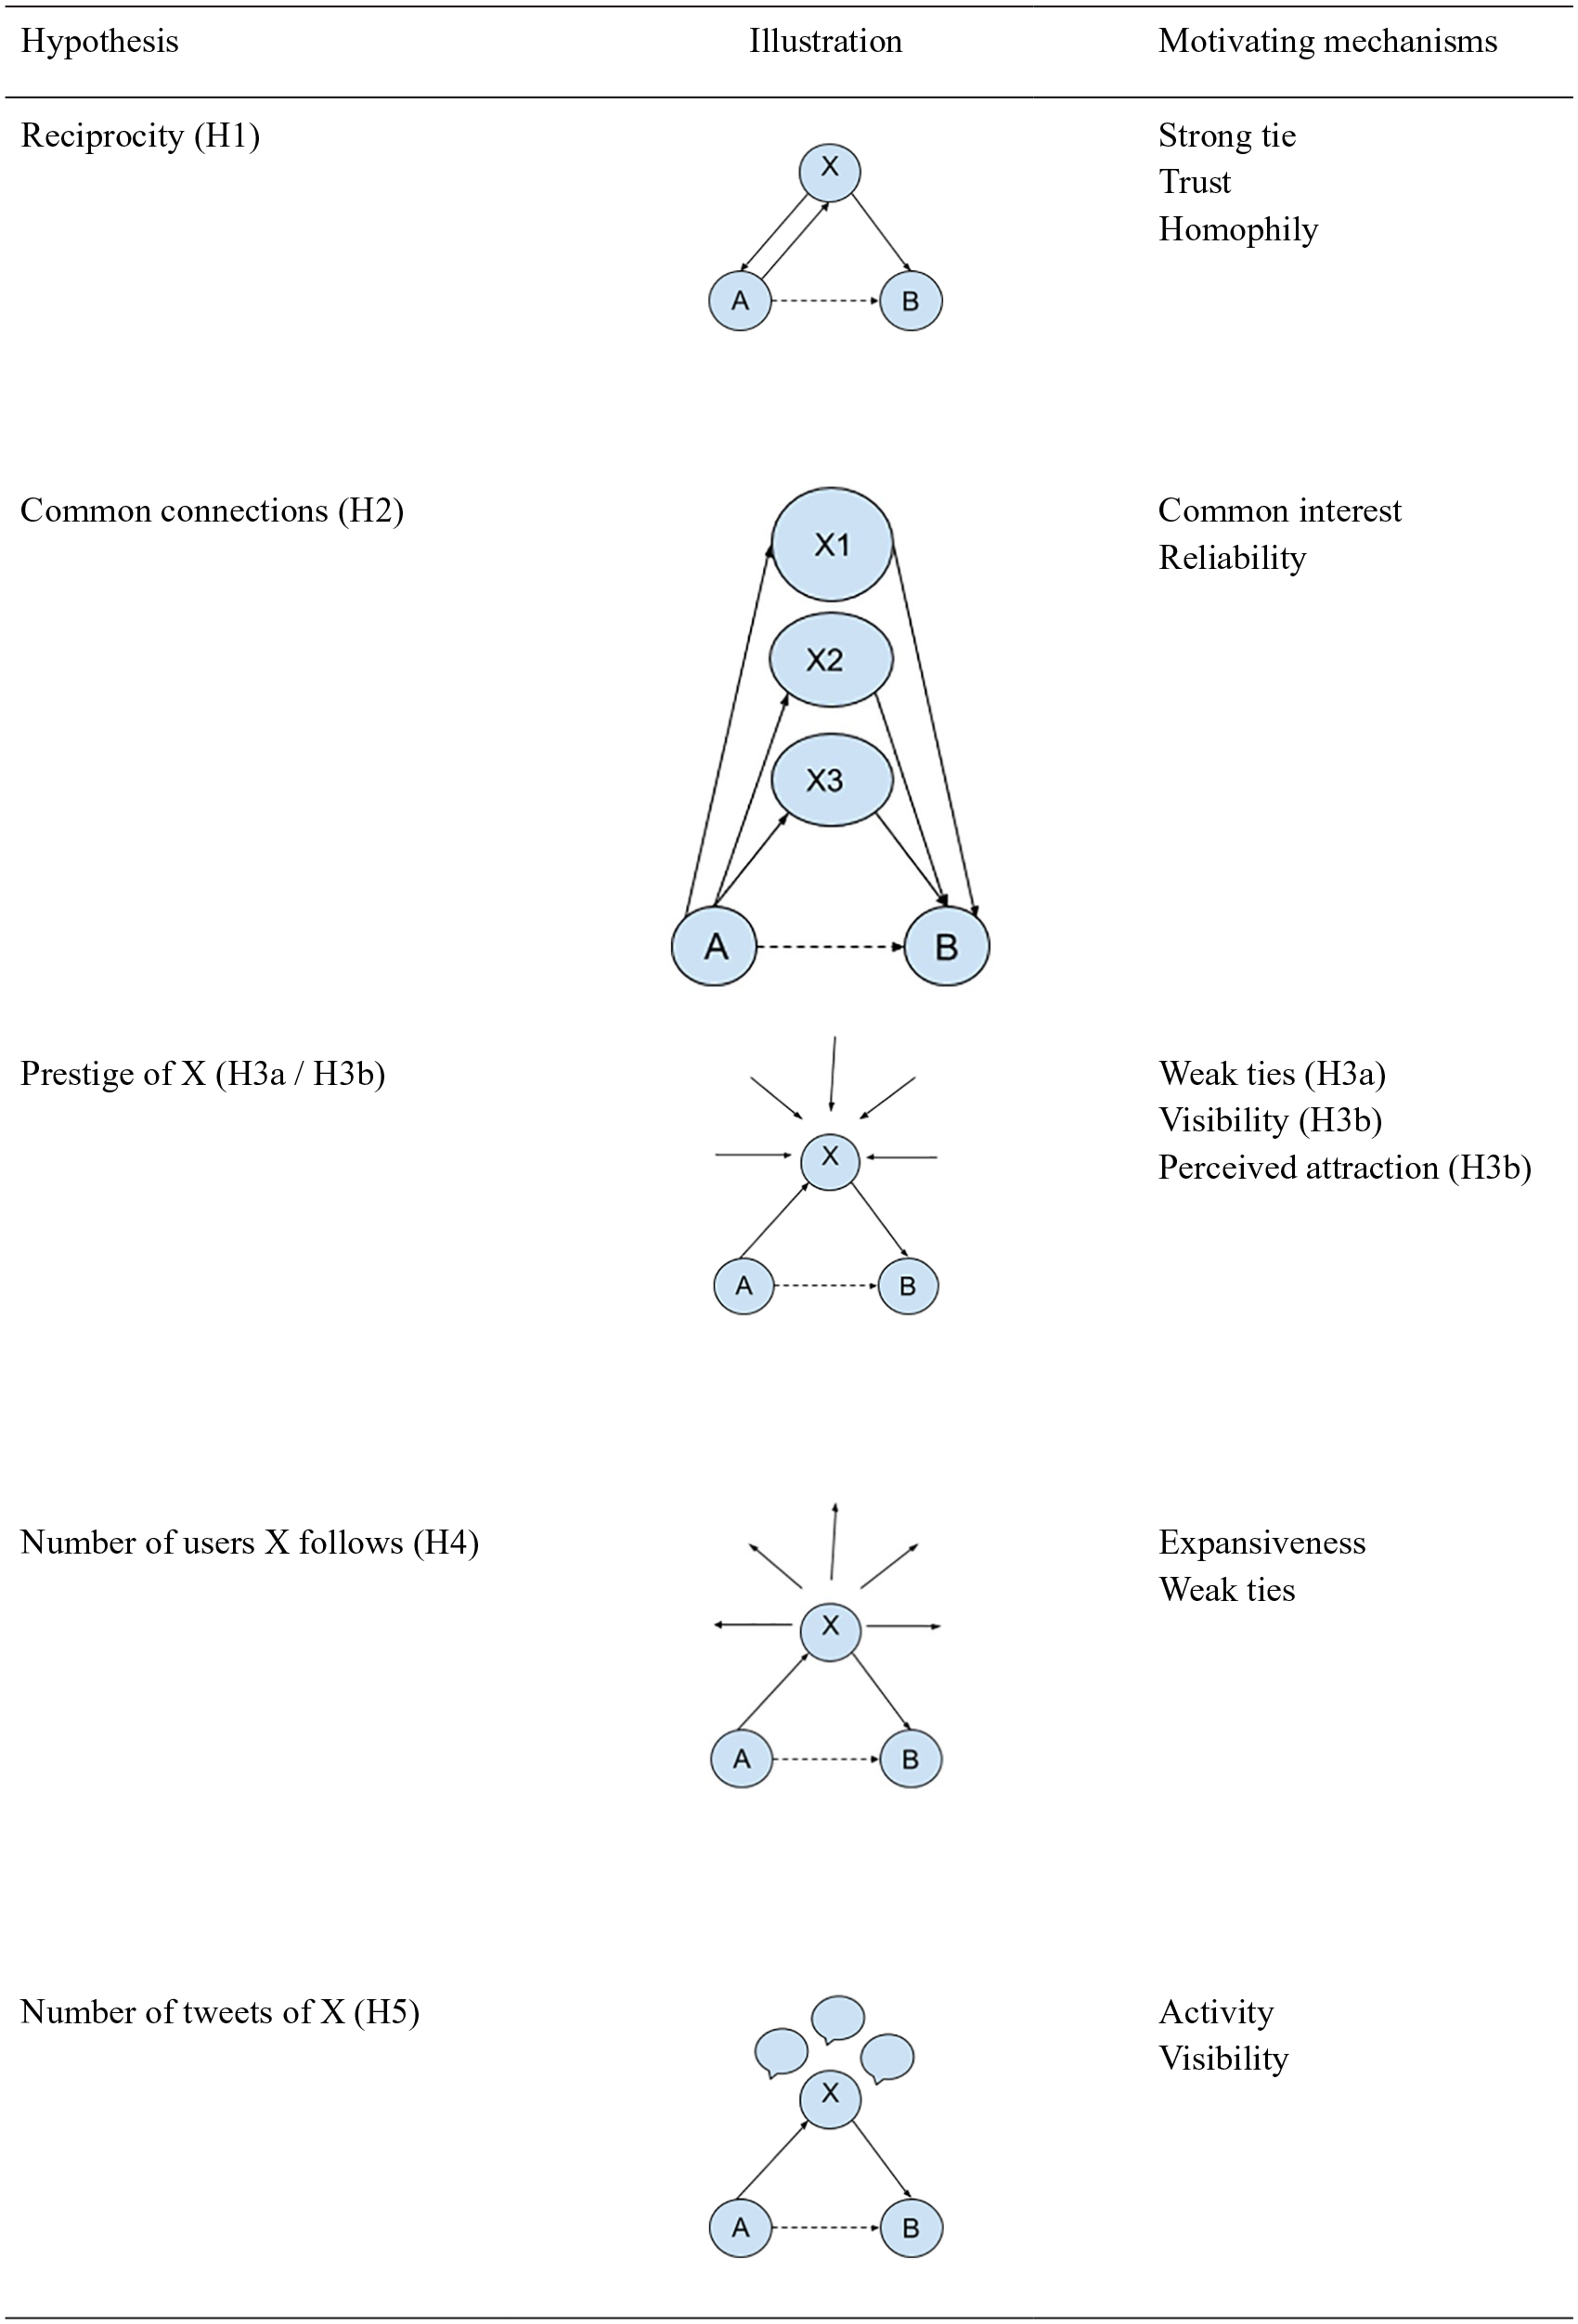
Illustration of factors affecting transitivity presented in each hypothesis, and their motivating mechanisms.
The second structural factor is the number of common connections, Xs, between users A and B. While studying undirected OSNs, Leskovec et al. (2008) found that considering the number of common connections significantly improved the likelihood of a transitive tie. Myers and Leskovec (2014) suggest that this mechanism, where users noticing a retweet of the user they are following, accounted for 21% of new follow ties. Lou et al. (2013) found a correlation between the number of common connections and transitivity. If there are multiple Xs that user A can recognize which follow user B, this will provide a reliable endorsement for the usefulness of B, say, as an information source. Therefore, such signal of reliability will likely encourage A to follow B, and get B’s tweets faster and in a more comprehensive manner. Another important factor that can encourage such pattern of tie formation is that social networks like Twitter recognize the importance of common connections and suggest recommended users to follow based on these known connections.
H2: The number of common connections (Xs) between users A and B will be positively correlated with transitivity.
The first node attribute we test is the prestige of user X. Prestige, measured by the number of incoming ties, represents the extent to which others in the network seek out a particular actor. Prestige may have competing effects on transitivity. First, if X is a prestigious user, for example, a celebrity, there is an asymmetrical status relationship (Marwick & boyd, 2011). In other words, A is one of the many people who follow X, which increases the likelihood that they have a weak tie, and the chance of having a common information need or interest area is low (McPherson et al., 2001). Therefore, the prestige of X will be negatively correlated with transitivity. In contrast, if X is a prestigious user, A might want to mimic X or be interested in whom X receives information from or communicates with, without regard to actual need for the information (Kurzman et al., 2007). Furthermore, A will likely pay more attention to X’s tweets, therefore, becoming aware of the people X follows. Consequently, A might choose to follow the people X follows. This would suggest a positive effect of X’s prestige on the likelihood of A following B. These competing mechanisms lead to the following hypotheses:
H3a: Prestige of X will be negatively correlated with transitivity.
H3b: Prestige of X will be positively correlated with transitivity.
Last, we examine the impact of user X’s activity. In Twitter context, we can consider tweeting and following as indicative of a user’s activity. First, we consider the number of users X follows. Literature has shown that there is a limit in the number of social relationships an individual can maintain (i.e., Dunbar’s number; Dunbar, 1992), and that this argument applies to the context of Twitter (Gonçalves et al., 2011). Given such cognitive limits, as the number of users X follows increases, a tie from X to B is more likely to be a weak tie. Furthermore, if X receives a large incoming stream of tweets from the many users they follow, the chance of being exposed to B’s message decreases as time passes (Himelboim et al., 2013). Therefore, X is less likely to retweet B’s tweets, and subsequently, there is a lower likelihood that A will be viewing B’s tweets and be motivated to follow B.
H4: Number of users X follows will be negatively correlated with transitivity.
The second is the number of tweets of X. A count of tweets sent by a user indicates the user’s activity, which include both the original tweets sent and retweets sent by a user (Bruns & Stieglitz, 2013). If A follows X and views a large number of X’s tweets, A is likely getting a large amount of exposure to X, X’s interests, and the people X follows and interacts with. X might also be frequently retweeting B’s tweets, which will increase the opportunity for A to be exposed to B and therefore follow B. Therefore, it is proposed that:
H5: Number of tweets of X will be positively correlated with transitivity.
Method
Data Collection
Twitter is a microblogging service and has a large user base with over 126 million daily active users (Wagner, 2019). On Twitter, users send updates or tweets to a network of associates or followers. The default setting for tweets is public, which permits users to follow others and read each other’s tweets without giving mutual permission (Jansen et al., 2009). Twitter has been found to exhibit characteristics of both a social network and an information network (Myers et al., 2014). It has been observed that people use Twitter to primarily post about daily activities and to seek and share information (Java et al., 2007).
In comparison with other OSNs, Twitter data are easy to obtain for research purposes (Golder & Macy, 2014). Twitter provides access to its data via an application programming interface (API). An API is a programming interface via which third party clients can make programming calls and collect data or perform various operations permitted by that API. We used Tweepy, 1 a tool that accesses the Twitter API, to collect data including the location of the user, the number of followers, the number of followees (the people who the user follows), the exact accounts followed by a user and the number of tweets.
We started with an initial seed set of 100 random users (As) from Mumbai, a major Indian city, in October 2012. From Twitter’s perspective, India is one of the fastest growing markets in terms of daily active Twitter users (Chaturvedi, 2017). In India, Twitter primarily serves as a platform for obtaining breaking news and participating in public debates (Aneez et al., 2019).
We used Tweepy to collect the list of accounts followed by the users in two hops. The seed set of 100 Twitter users followed a total of 19,804 accounts in the first hop, out of which 13,149 accounts were unique. While the initial 100 users are all individual human accounts, some of the next 13,149 accounts could be non-human bots or organizational accounts. Bots are automated accounts, which have been used for both malevolent activities like spamming and spreading false information, and also for benevolent activities like news and emergency communication (Gilani et al., 2017). Organizational accounts are social media accounts that represent an institution, corporation, agencies, news media, or a common interest group (Oentaryo et al., 2015). However, the Twitter API does not have a built-in function to distinguish these different types of accounts, which is a limitation of the current study. On average, the 100 seed users followed 198 users, with a minimum of 1 and a maximum of 729. The following are the descriptive statistics for the 13,149 unique accounts (Xs) that were followed in the first hop. The average number of followers of X was 172,465 (minimum 0, median 884, maximum 31,480,052). The two top accounts with maximum followers were “Lady Gaga” and “Justin Bieber.” The average number of followees was 3,195 (minimum 0, median 198, maximum 1,016,246), with the two top accounts being “HootSuite” and “Barack Obama.” The average number of tweets of X was 8,303 (minimum 0, median 2,120, maximum 1,201,475) and the two top accounts were “Xbox Support” and “Battlefield.”
We know the total number of B’s each X followed, and there are 42,018,001 (42.02 million) X–B links. Therefore, we have at least 42.02 million (A, X, B) triads in the whole network. However, due to limitations in Tweepy, we collected information of only up to 5,000 random followees (Bs) for a given X. In other words, the data used in the analysis contain all A–X links, but only a subset of X–B links. After this limitation, we still have information about 12,503,462 (12.5 million) triads. When we look at these 12.5 million triads, the average number of common connections is 4.97 (minimum 1, median 1, maximum 343). While the X–B data loss is a technical limitation and having the full data would have been more robust, we think the results are acceptable for a few reasons. First, out of the 13,149 unique Xs in our network, 12,340 Xs (93.8% of Xs) have less than 5,000 followees, and are unaffected. Second, when X–B links were truncated, they were truncated randomly. Finally, prior research on transitivity on Facebook (see Lönnqvist et al., 2014) took a similar approach where they derived conclusions based on information of about 7.3% of all triads.
We revisited the network in March 2014 to examine how the transitive ties were formed over time. While there is no specific reason for selecting the 17-month interval, previous literature typically adopts 12–18-month interval between observations and suggests that this timespan is sufficient for detecting the patterns of link formation on Twitter (e.g., Hargittai & Litt, 2011; Hutto et al., 2013). And indeed, we saw a substantial number of new ties were created between the two time snapshots in our network. We recomputed the graph for the same set of 100 users. By 2014, these 100 seed users followed a total of 28,256 users (an overall increase of 42.7% from 2012; 13,380 A–X links were added and 4,928 A–X links were removed) out of which 19,727 Xs were unique (an overall increase of 50% from 2012; 9,203 unique Xs were added and 2,732 unique Xs were removed). The average number of Xs followed by the seed users (As) was 282, with a minimum of 1 and a maximum of 1,165. Out of the 13,380 new ties which the 100 users formed, at least 6,463 ties closed the triangle (the number is possibly an under-estimate as we are missing some of the X–B links), that is, at least 48.3% of the new ties are transitive ties. This is consistent with previous research (Davis, 1970; Leskovec et al., 2008; Robinson & Balkwell, 1995) which found that a substantial number of new ties are transitive ties. We utilized this longitudinal dataset to examine how the different factors influenced the formation of transitive ties over this 17- month time period, and used it to further validate the results from the cross-sectional correlation that can be found between the factors and the existence of transitive ties in 2012.
Measures
For a quantitative measure of transitivity, we define and use two metrics: Transitivity Percentage and New Transitivity Percentage. Transitivity Percentage in 2012 is explained by the following formula

On the other hand, New Transitivity Percentage captures how often new transitive ties were created between 2012 and 2014, as shown in the following formula

For a given triad (A, X, B), the five predictor variables are defined and measured as follows. Reciprocity is whether A and X follow each other. The number of common connections refers to the number of common connections (X1, X2, . . . Xn) between A and B. Prestige is the number of followers of X. Activity is measured by first, the number of users X follows, and second, the number of tweets of X.
For the longitudinal analysis of how new transitive ties were formed between 2012 and 2014, there is the issue of whether we should use predictor data (e.g., prestige of X) from 2012 or 2014. Neither data point is completely accurate as the network was evolving dynamically and continuously throughout the whole time period. In this article, we used the predictor data from 2012 (e.g., prestige of X from 2012).
Analysis
Pairwise Pearson correlation coefficients among the five predictor variables are listed in Table 1. The biggest correlation (.515) is between the prestige of X and number of users X follows. This implies that users with a lot of followers also follow a lot of users. Another interesting correlation is a negative correlation (−.186) between reciprocity and prestige of X. This implies that prestigious users are less likely to follow back their followers.
Correlations Among the Predictor Variables.

p < .01.
We used ordinary least squares (OLS) linear regression to study the effect of the five predictors. Models 1–5 tested the effect of the five predictors in isolation. Model 6 used multiple linear regression, using all five predictors simultaneously to test the relative effect of each predictor. As shown in Tables 2 and 3, all the variance inflation factor (VIF) values are in the 1–1.4 range which indicates that multicollinearity is not a significant problem. Likewise, all the Durbin–Watson (DW) values are in the 1.7–2.0 range, which indicates the independence of observations assumption is met. An alternate analysis method would be exponential random graph models (ERGMs), but the size of the network makes it challenging.
Results of Regression Model Predicting Transitive Percentage in 2012.

SE: standard error; DW: Durbin–Watson; VIF: variance inflation factor.
p < .01.
Results of Regression Model Predicting New Transitivity Percentage.

SE: standard error; DW: Durbin–Watson; VIF: variance inflation factor.
p < .01.
Results
Descriptive Statistics
In the network data collected in 2012, we have 12.5 million triads. Among these, 343,427 were transitive triads. Thus, the overall Transitivity Percentage is 2.74%. By 2014, an additional 55,185 of the triads were closed. So, the overall New Transitivity Percentage is 0.45%.
Results from Hypotheses Testing
Tables 2 and 3 show the regression results of the effects of the five hypothesized factors on Transitivity Percentage and New Transitivity Percentage, respectively.
H1 tested reciprocity as a predictor of transitivity (Models 1 and 6). The 2012 data contain 4.23 million triads, where A and X have reciprocal ties, and 162,541 of them are transitive triads. Thus, the Transitivity Percentage is 3.84%, which is 40.1% higher than the baseline number of 2.74%. Likewise, if we limit to the triads, where A and X have a reciprocal relationship, New Transitivity Percentage is 0.6%, which is 33.3% higher than the baseline number of 0.45%. In Model 1, reciprocity was found to be a positive predictor of Transitivity Percentage (β = .048, p = .000) and New Transitivity Percentage (β = .016, p = .000). In Model 6, we do not have statistically significant results about reciprocity.
H2 tested the effect of number of common connections (Models 2 and 6). Figure 3a and b shows the strong positive correlation between the number of common connections and both Transitivity Percentage and New Transitivity Percentage. We truncated the X-axis at 100 as 99.6% of the triads have less than 100 common connections. As indicated in plot A, there seems to be almost a perfect linear increase in Transitivity Percentage till we reach around 70 or 80 common connections, beyond which the graph fluctuates as the data are sparse. The intuition of a positive correlation from the plots is confirmed by the regression model. The number of common connections is a strong predictor of Transitivity Percentage (β = .540, p = .000) and New Transitivity Percentage (β = .164, p = .000). The effect remains in Model 6 with all factors together: Transitivity Percentage (β = .540, p = .000) and New Transitivity Percentage (β = .163, p = .000).
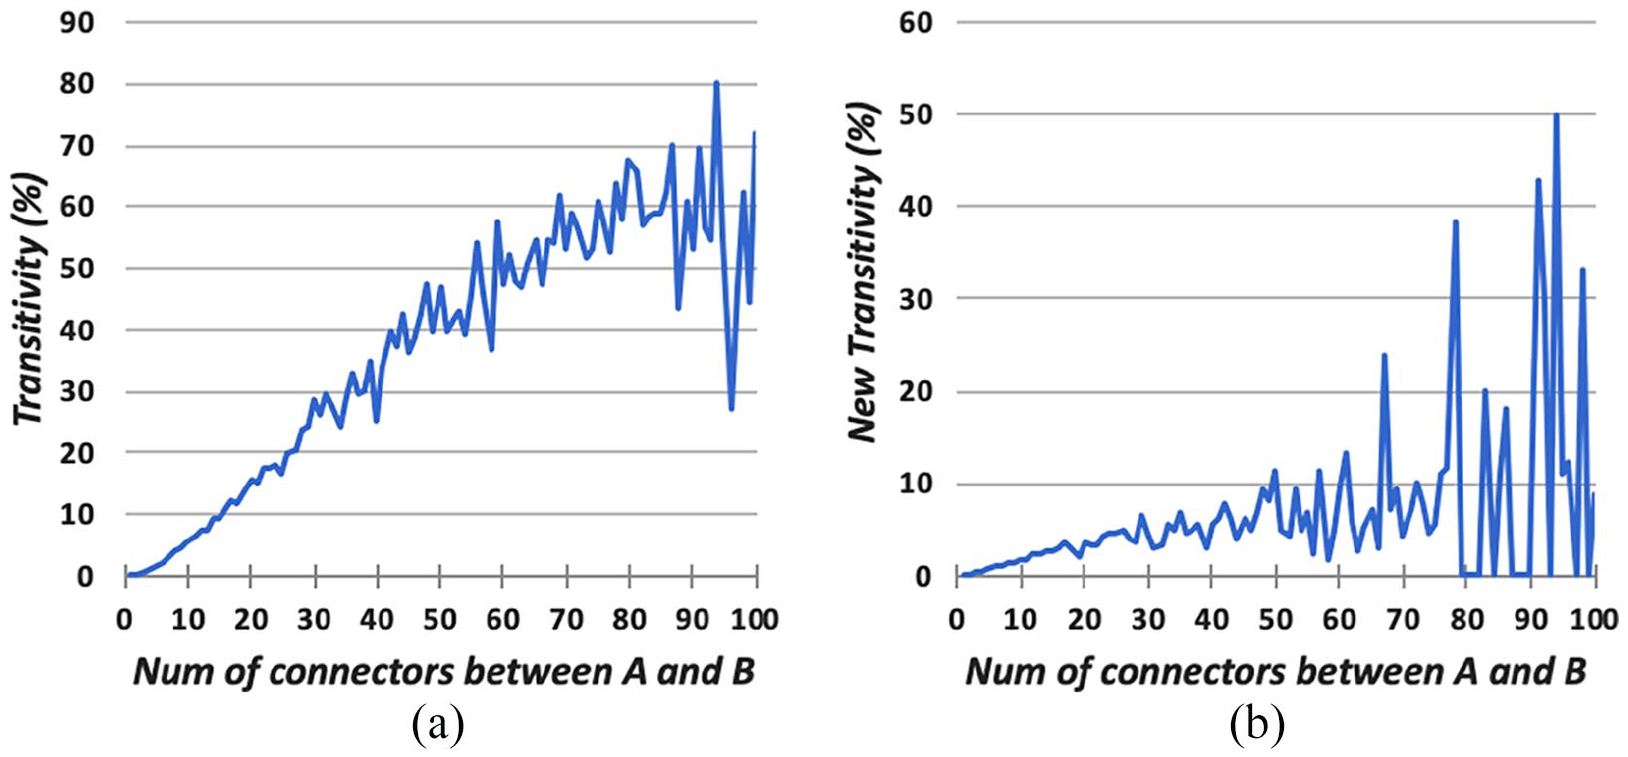
H2: (a) Transitivity Percentage versus number of common connections and (b) New Transitivity Percentage versus number of common connections.
H3 tested the role of X’s prestige (Models 3 and 6). Figure 4a and b shows that Transitivity Percentage and New Transitivity Percentage go down as the prestige of X increases. Prestige is found to be a negative predictor of Transitivity Percentage (β = −.034, p = .000) and New Transitivity Percentage (β = −.013, p = .000). Interestingly, in Model 6, after accounting for the effects of other factors, the effect of prestige is reversed and is found to be a mild positive predictor of Transitivity Percentage (β = .002, p = .000) and New Transitivity Percentage (β = .001, p = .009).
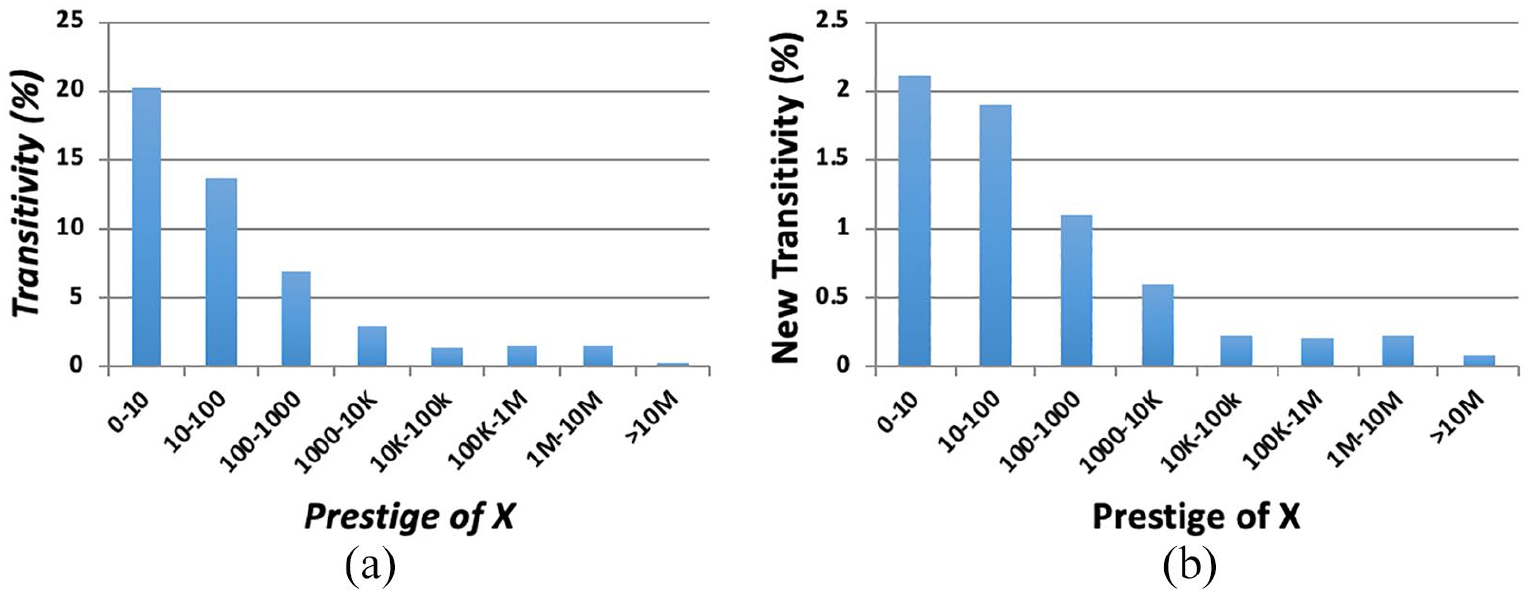
H3: (a) Transitivity Percentage versus prestige of X and (b) New Transitivity Percentage versus prestige of X.
H4 considered the number of people X follows (Models 4 and 6). Figure 5a and b shows a negative correlation between the number of people X follows and both Transitivity Percentage and New Transitivity Percentage. The number of people X follows is a negative predictor of Transitivity Percentage (β = −.057, p = .000) and New Transitivity Percentage (β = −.023, p = .000). The effects are consistent in Model 6, where the number of people X follows remains a negative predictor of Transitivity Percentage (β = −.006, p = .000) and New Transitivity Percentage (β = −.008, p = .000).
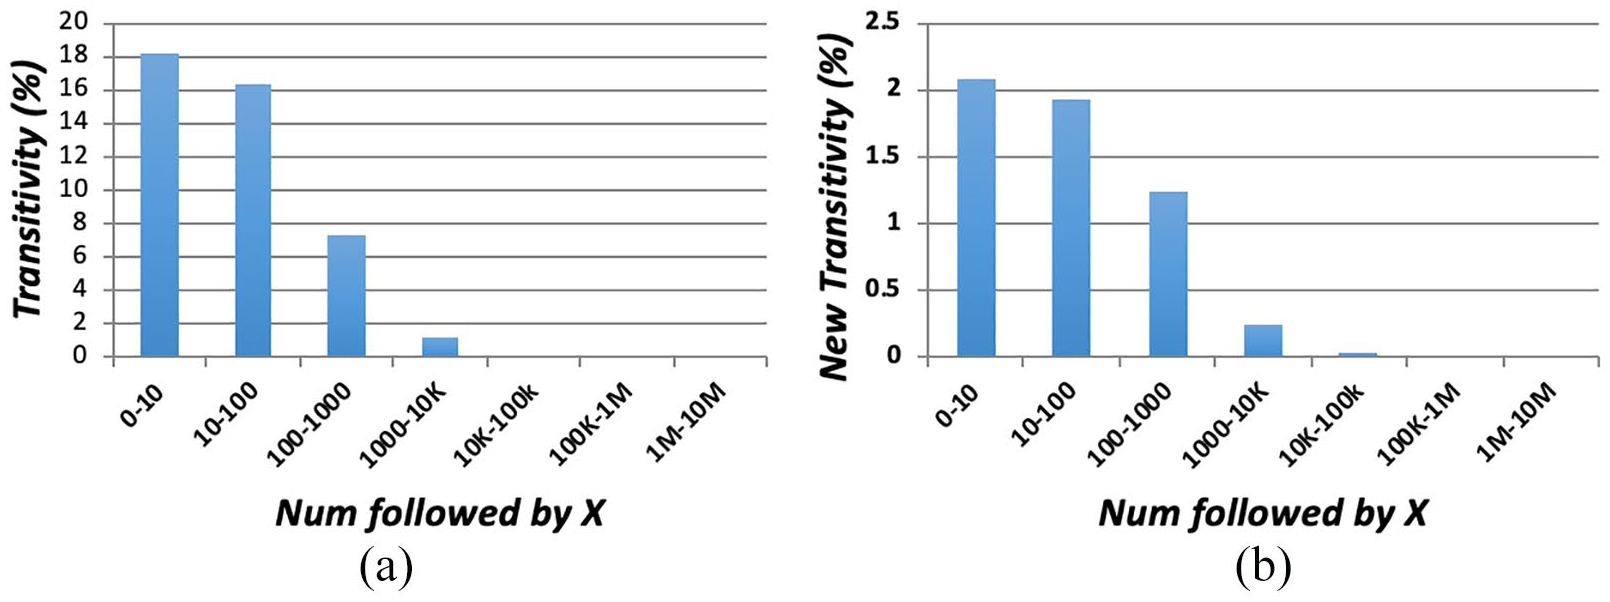
H4: (a) Transitivity Percentage versus number followed by X and (b) New Transitivity Percentage versus number followed by X.
H5 tested the role of tweeting activity (Models 5 and 6). Figure 6a and b shows Transitivity Percentage and New Transitivity Percentage decreasing with an increase in the number of tweets, the former more strongly than the latter. The number of tweets is a negative predictor of Transitivity Percentage (β = −.012, p = .000) and New Transitivity Percentage (β = −.001, p = .001). Even in Model 6, the number of tweets of X is a negative predictor of Transitivity Percentage (β = −.042, p = .000) and New Transitivity Percentage (β = −.002, p = .000).

H5: (a) Transitivity Percentage versus number of tweets of X and (b) New Transitivity Percentage versus number of tweets of X.
Discussion
The regression analyses based on Transitivity Percentage (between the predictors and existing transitive ties in 2012) and New Transitivity Percentage (between the predictors and new transitive ties formed by 2014) answered all five hypotheses in the same way, which further strengthen the confidence in the results.
The number of common connections (H2) is by far the strongest positive predictor of transitivity. From a theoretical perspective, this result reconfirms previous results where common connections were found to be an important factor of transitivity in Twitter (Lou et al., 2013) and in inter-organizational alliances (Gulati & Gargiulo, 1999). However, we see a different relation between transitivity and common connections than Lou et al. (2013), who found an S-shaped relation between transitivity and number of common connections; they saw a sharp increase in transitivity when common connections goes from 1 to 2, then a sub-linear trend, and a flattening of the graph by the time the number of common connections is 5. In contrast, as shown in Figure 3a and b, we see a strong linear relationship between transitivity and common connections even as the number of common connections goes beyond 20 or 30. One possible reason for this discrepancy may be that Lou et al. (2013) considered only triads where A and X have a reciprocal relationship, whereas, we have no such restriction. This discrepancy can be further investigated in future studies.
From a practical perspective, the strong effect of common connections on transitive closures can lead to the formation of subgroups and clusters where information is shared between them, fostering homogeneity and segregation, where one’s own taste or worldview may be strengthened by being exposed to similar information sources. This is consistent with findings from prior studies showing polarization effects across OSNs, including Twitter, Facebook, and Blogs (see Gilbert et al., 2009; Tien et al., 2019; Yardi & boyd, 2010). If this is the natural evolution of ties in OSNs, it is arguably incumbent on the OSNs to promote more diversity in tweets shown to users and in the suggested list of users to follow. On the other hand, for organizations aiming to accumulate followers (for information sharing, etc.), the implication is that it is important to focus on accumulating a critical mass of initial followers in the sub-network they are targeting, and afterwards, the effect of common connections would make the subsequent accumulation of followers much easier.
When prestige is studied in isolation (Model 3), prestige of X is negatively correlated with transitivity (H3a) and implies that prestigious users such as celebrities do not have a strong influence in helping create new transitive ties. This is analogous to a previous finding which found that prestige did not translate into influence in generating more retweets or mentions (Cha et al., 2010), and is consistent with the work of Lou et al. (2013) which found that if A and X follow each other, and if X is an elite user, transitivity is 2.8 times less likely than if X is a non-elite user. However, prestige appears to be a more complex factor based on the findings of the current study. Once we included all the other factors (Model 6), prestige turned out to be a slight positive predictor of transitivity. This might be because there are correlations between prestige and other factors, especially the number of users X follows (see Table 1). Some of the negative effects of prestige are captured by these other factors, and after that, there is a slight positive effect presumably due to users paying more attention to celebrities’ tweets and the information sources they follow.
A high number of followees of X indicates a weak tie, and is a negative predictor of transitivity (H4). Reciprocity corresponds to a strong tie and is a positive predictor of transitivity (H1). Put together, the results suggest that triads with strong ties will have higher transitivity, and vice versa. From a theoretical perspective, this takes the previous observations about the importance of strength of ties in determining transitivity (Granovetter, 1973; Louch, 2000) and validates a similar effect in OSNs like Twitter.
Both of the activity factors, the number of followers of X and the number of tweets of X are negatively correlated with transitivity (H4 and opposite of H5). This is a novel result which suggests that despite all the activity, these users are not able to positively influence transitive tie formation. Number of tweets being a negative predictor of transitivity was opposite of what we expected (opposite of H5). It could be the case that the large number of tweets X posts can make it difficult for A to become aware of B, unless X also retweets a large number of B’s tweets. We do not have information about retweets, and this result could be further examined by including more data such as retweets. For organizations attempting to accumulate Twitter followers or grow influence, the implication is that the most active users in the network they are targeting may not have the potential to influence activities like the generation of new transitive ties.
Conclusion
This study examines a set of factors affecting transitive tie formation on Twitter. The results support some of the previous research findings based on Twitter (Lou et al., 2013) such as the importance of common connections. The results also validated some of the findings from non-OSN contexts such as the importance of the strength of ties in predicting transitivity. Furthermore, the study yields new findings showing that the activity of X including the number of tweets and the number of people X follows is a negative predictor of transitivity. Findings show potential nuanced differences from Lou et al. (2013) like the complex effect of prestige of X on transitivity, and that transitivity might have a linear relationship with the number of common connections to a much larger degree than previously observed. We also discussed practical implications of these findings, for organizations aiming to accumulate followers, and for designers of friend recommendation algorithms.
While findings from the current study are suggestive rather than definitive, they can spur more research in this area. For instance, it will be useful to validate some of the theoretical findings such as the importance of common connections and strength of ties as predictors of transitivity in a unified way across multiple social networks. In addition, it might be useful to examine why activity such as high number of tweets is negatively correlated with transitivity. Some of the differences we found from previous Twitter-based transitivity research could also be investigated further.
Footnotes
Author’s Note
An earlier version of this paper was presented at the 2014 Sunbelt Conference of the International Network for Social Network Analysis.
Declaration of Conflicting Interests
The author(s) declared no potential conflicts of interest with respect to the research, authorship, and/or publication of this article.
Funding
The author(s) received no financial support for the research, authorship, and/or publication of this article.