
Abstract
During the 2012 US presidential debates, more than five million connected viewers turned to social media to respond to the broadcast and talk politics with one another. Using a mixed-methods approach, this study examines the prevalence of humor and its relationship to visibility among connected viewers live-tweeting the debates. Based on a content analysis of tweets and accounts, we estimate that approximately one-fifth of the messages sent during the debates consisted of strictly humorous content. Using retweet frequency as a proxy for visibility, we found a positive relationship between the use of humor and the visibility of individual tweets. Not only was humor widespread in the discourse of connected viewers, but humorous messages enjoyed greater overall visibility. These findings suggest a strategic use of humor by political actors seeking greater shares of attention on social media.
In 2012, political talk on Twitter peaked over three October evenings during which the leading candidates in the US presidential election, Democrat incumbent Barack Obama and Republican challenger Mitt Romney, appeared in televised debates (Hong & Nadler, 2012). Millions of connected viewers turned to Twitter to comment on the unfolding debates and read the comments of others (Bruns & Highfield, 2015; Christensen, 2013; Conway, Kenski, & Wang, 2013). This outpouring of political talk ranged from the phatic to the thoughtful, from the benign to the outrageous, but it was the humorous content—sarcastic, snarky, biting, and bizarre—that seemed to dominate the experience of “live-tweeting” the debates (Freelon & Karpf, 2015; Tsou et al., 2013).
Political humor figured prominently in the discourse surrounding the 2012 presidential debates, both in the real-time experiences of connected viewers and in the post hoc debate coverage published by news organizations. Critics at NPR, CNN, and others ranked the “funniest” tweets of each debate, promised to explain debate-related jokes such as “binders full of women,” and entreated politicians to adapt to the new reality of social media parody (e.g., Dailey, 2012; Katz, 2012; Kelly, 2012). This anecdotal coverage of humor was set against a backdrop of macroscale statistics and charts produced by third-party social media analytics services such as Crimson Hexagon and Topsy (Crimson Hexagon’s Editorial Team, 2012; Sharp, 2012; vanessa, 2012). Neither the news organizations nor the commercial data analytics firms disclosed the overall volume of social media talk dedicated to humor, despite the well-known technical and analytic challenges posed by such polysemous political talk (Bakliwal et al., 2013; Gayo-Avello, 2012; Mejova, Srinivasan, & Boynton, 2013; Wang, Can, Kazemzadeh, Bar, & Narayanan, 2012). The present research was designed, therefore, to estimate the prevalence of humor among the tweets sent by connected viewers of the 2012 US presidential debates and evaluate the impact of humor on the visibility of particular voices within that live-tweeting population:
RQ1. How much of the overall connected viewing activity was dedicated to humor?
RQ2. What was the relationship between humor and visibility among live-tweeting viewers?
To assess the prevalence of humor among connected viewers, we undertook a mixed-methods analysis of a large corpus of Twitter messages sent on the nights of the three debates. Rather than attempt to identify specific types of humor, we adopted a broad definition of humor inclusive of a variety of genres and styles. After analyzing multiple large samples, we estimate that at least one-fifth of all tweets sent during the debates represented some form of humor. Furthermore, we found that humor contributed significantly to the visibility of individual tweets, as measured by their retweet counts. These findings provide a baseline for future research on social media, humor, and political communication. If humor affords greater visibility to political speech, then we have to get serious about jokes.
Literature Review
Live-Tweeting and Visibility
During a US presidential debate, elite and non-elite audiences alike may react and respond in real time using a social media system such as Twitter (Freelon & Karpf, 2015). This practice, known as “live-tweeting” (Schirra, Sun, & Bentley, 2014) or “connected viewing” (Holt & Sanson, 2013; Pittman & Tefertiller, 2015) is common during televised events such as award shows, popular dramatic series, and major sporting events, as well as political debates and speeches (Bentivegna & Marchetti, 2015; Highfield, Harrington, & Bruns, 2013; Houston, McKinney, Hawthorne, & Spialek, 2013; McKinney, Houston, & Hawthorne, 2014). Live-tweeting may take on more pronounced political significance during “breaking” events such as protests, rallies, and emergencies (Bruns, Burgess, Crawford, & Shaw, 2012; Papacharissi & Oliveira, 2012) when participation offers connected viewers the sense of “being a part of” an unfolding drama of historical significance (Thorson, Hawthorne, Swasy, & McKinney, 2015). Across these contexts, Twitter provides a common channel for the voices of everyday viewers, pundits, politicians, and news organizations.
Of course, very few tweets sent by everyday viewers were seen by millions; most remained obscure. On a social media system such as Twitter, where the barriers to expression are low, messages compete with one another for the scarce attention of potential audiences (Webster, 2014). In this context, “visibility” describes the size of a tweet’s potential audience, a precondition for exposure and influence. The visibility of a tweet is shaped initially by contextual factors such as timing and the author’s prior notoriety (Hodas & Lerman, 2012; Pezzoni, An, Passarella, Crowcroft, & Conti, 2013) and later by the mechanics of the platform such as the sequencing of each user’s timeline and the selection of Trending Topics (Bucher, 2012; Gillespie, 2012).
Twitter users actively participate in the allocation of visibility through the practice of “retweeting.” Retweeting is a platform-specific form of recirculation, analogous to “sharing” on Facebook or “reblogging” on Tumblr. On an individual basis, retweeting is a conversational practice (Christensen, 2013) but taken in aggregate, retweeting offers a proxy measure of visibility (boyd, Golder, & Lotan, 2010). Zhang, Wells, Wang, and Rohe (2017) theorize retweeting as the “amplification” of visibility, a means of signaling that a particular tweet and its author are worthy of attention. These signals are continuously fed back into the Twitter platform as inputs to various ranking and recommendation algorithms that, in turn, contribute to the ongoing distribution of visibility.
Political Humor
Political humor is a particularly potent form of political communication, used to critique and expose politicians’ values, ineptitude, abuses of power, or arrogance (Nilsen, 1990). In some instances, political humor has moved audiences to political action (Jones, Baym, & Day, 2012). In the early 2000s, political entertainment programs such as The Daily Show developed a new form of political humor combining elements of news, commentary, satire, and late-night comedy (Baym, 2005, 2007; Warner, 2007). Later iterations, such as The Colbert Report, presumed the connectedness of their audiences, extending engagement with viewers across social media and the Web (Burwell & Boler, 2014). While political humor has long been a component of mainstream political culture, researchers are only beginning to explore the circulation of political humor through social media.
Humor is fundamental to Internet-mediated communities and cultures (Shifman, 2007; Shifman & Blondheim, 2010). For many users, the decision to amplify a message on Twitter is based on a desire to share something meaningful, poignant, or entertaining (Jenkins, Ford, & Green, 2013). In their exploration of virality, Nahon and Hemsley (2013) found that humorous media “resonates” with viewers in a way that may motivate sharing. On Twitter specifically, humor connects journalists and politically interested participants (Holton & Lewis, 2011), and during live-tweeting events, tweets containing humor may reach greater visibility and longevity than breaking news messages (Highfield, 2015b). In addition, the structure of Twitter affords platform-specific forms of political humor, such as parodies of public figures (Highfield, 2015a).
Political humor, however common, remains elusive to social media researchers. Humor is difficult for both human and non-humor coders to reliably identify because of its linguistic variety and dependence on context (Attardo, 2014). Few researchers have tackled the problem of reliably identifying humor specifically in the context of Twitter. In a comparative study of sentiment analysis software for Twitter, joke and sarcasm semantics were found to account for the largest percentage of tweets mis-categorized by both “out-of-the-box” and learning-based tools (Abbasi, Hassan, & Dhar, 2014). Furthermore, there is no standard schema for the identification of humor by human coders (c.f., Chew & Eysenbach, 2010). To examine the prevalence of political humor and its relationship to visibility, we undertook a mixed-methods analysis of tweets sent during the 2012 presidential debates.
Method
Data Collection
To explore the role of humor among connected viewers of the three presidential debates, we combined microscale participant observation with macroscale analysis of tweets sent during the broadcast.
On the evening of each debate, graduate students and faculty with subject area expertise gathered to observe and participate in live-tweeting. A large television displayed the broadcast feed while a random sample of tweets was projected onto a nearby wall. Equipped with their own devices and Twitter accounts, researchers took notes, made screenshots, and discussed unusual statements and images that they saw on television, on the projection, and in their personal streams.
From November 2011 to November 2012, we continuously collected tweets related to the election using the Gnip PowerTrack service (colloquially, the “firehose”). 1 PowerTrack generated a custom, real-time stream of tweets based on a list of “filtering rules.” Each rule was defined as a combination of keywords, phrases, hashtags, and usernames. Our data collection system included a mechanism for collective management of filtering rules, enabling members of the team to add or remove rules in response to emergent phenomena as well as to later reconstruct the chronology of these changes (Wang et al., 2012).
Before each debate, we developed a list of filtering rules related to the event, issues, and candidates. To capture unanticipated themes, we also continuously updated the rules during our participant observation. At the conclusion of the third debate, we conducted a post hoc round of filtering to eliminate false positives. 2 By incorporating emergent keywords, we mitigated the problems associated with predetermined lists of hashtags or keywords (Tufekci, 2014). Only 14.5% of the messages in the final corpus included #debate or #debates.
Analysis
Each debate lasted 90 min, followed by at least 30 min of televised commentary. To observe the rise and decline of Twitter activity related to the debates, we defined a six hour window of observation beginning one hour before the start of the debate. During these three periods, we observed 33,501,086 tweets matching our rules (Figure 1). For comparison, the three evenings of the debates accounted for 12.47% of all election-related tweets sent between November 2011 and November 2012. The only single day to prompt more activity on Twitter than the debates was Election Day.

Connected viewership during the 2012 US presidential debates.Note. Television audience estimates based on Nielsen (2012a; 2012b; 2012c).
The corpus included a mix of original tweets and retweets. To identify retweets, we adopted the Bruns and Stieglitz (2013) method to sort each tweet into one of the three mutually exclusive categories: original tweet, edited retweet, and unedited retweet. Conventionally, unedited retweets simply replicate an earlier message with a short citation string prepended. Edited retweets include additional text such as brief commentary or additional hashtags. 3 Occasionally, a tweet passed through several rounds of retweeting, significantly altering the text of the original message. In such cases, we assessed only the relationship of the two most recent tweets in the retweeting sequence. We collapsed all retweet variants into a single retweet category and classified Tweets that did not match any of the retweet criteria as original. 4 Using this method, we classified 15,740,404 (46.98%) tweets as original and 17,760,682 (53.02%) as retweets. An overwhelming majority of the retweets—16,660,358 (93.8%)—were created using the platform’s built-in “retweet” feature.
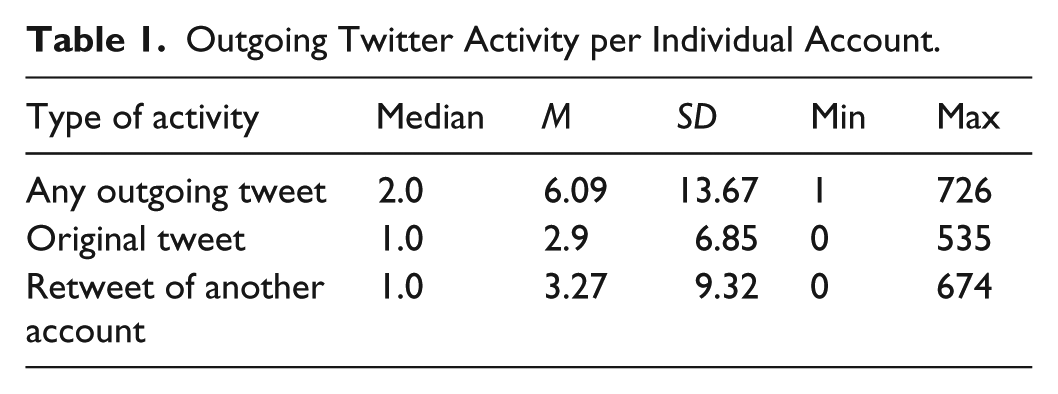
The tweets and retweets in this collection were authored by 5,423,355 unique accounts, 1,863,170 (34.35%) of which were created within the previous year and 245,477 (4.53%) of which were created during the previous month. The distribution of messages sent by this population was positively skewed, ranging from 1 to 726 (Table 1). A majority of accounts (3,748,179 or 69.11%) sent at least one retweet during the observation period and 1,570,583 accounts (28.96%) exclusively sent retweets and no original tweets. Conversely, most accounts that sent an original tweet were never retweeted. Of the nearly four million accounts that sent an original tweet during the observation period, only 1,427,230 (37.04%) had one or more of their messages retweeted.
Outgoing Twitter Activity per Individual Account.
Among those accounts that sent a tweet on these three evenings, most were active during the two hours of the televised debate. Across the three debates, the volume of outgoing tweets—original and retweet—surged during the first fifteen minutes of the broadcast, peaked just after the first hour, and began a steady decline approximately thirty minutes before the conclusion of the debate. Approximately 85% of all activity occurred during the debate broadcasts (Figure 2).

Live-tweeting activity summed per minute from October 3, 16, and 22, 2012. (Times listed in PDT).
Identifying Humor Among Debate Tweets
Informed by participant observation during the debates, we conducted three rounds of analysis to measure the prevalence of humor in the corpus. First, we used pattern matching to filter tweets referencing highly publicized jokes. Next, we analyzed a sample of highly retweeted accounts to identify accounts that exclusively engage in humor. Finally, we analyzed the content of a large sample of individual tweets.
Debate-Defining Moments of Humor
Before the analysis, we expected to find a significant volume of Twitter activity related to three well-known gaffes. In the first debate, Mitt Romney followed a comment about defunding public broadcasting with an aside about loving Big Bird, a character from long-running television program for children. In the second, Romney described the “binders full of women” from which he planned to recruit women into his administration. In the third debate, Barack Obama responded to a comment about the state of the US Navy’s armament by quipping that the military also stocked “fewer horses and bayonets” than it did a century before. Freelon and Karpf (2015) described these gaffes as “debate-defining moments” that influenced public opinion and shaped media coverage of the campaign.
In spite of their visibility in post-debate reportage, however, tweets referring to the candidates’ comments about Big Bird, binders, and bayonets accounted for a small proportion of the overall activity during the debates. To identify tweets referencing these gaffes, we parsed the text of each tweet in search of “big bird,” “bayonet,” or “binder,” terms that were unlikely to be mentioned in any other context (Figure 3). 5 In total, we found 847,119 tweets authored by 490,696 unique accounts mentioning Big Bird, binders, or bayonets. Retweeting was more common in this sample than the whole corpus. Of the total number of tweets related to these three highly publicized moments, we classified 289,551 (34.18%) as “original” and 557,568 (65.82%) as retweets. Indeed, while references to Big Bird, binders, and bayonets were relatively rare among all the original tweets (1.84%), they were approximately twice as common among the top 1% of most retweeted tweets. All the tweets and retweets related to these three gaffes were labeled “humor” in our database.

Highly publicized moments of humor during the three debates (not mutually exclusive).
Identifying Accounts that Exclusively Tweet Humor
During our participant observation, we noted that many highly visible accounts seemed to exclusively send out messages of a humorous nature. Some, such as @BorowitzReport, @TheOnion, @billmaher, and @SarahKSilverman, were “verified” by Twitter and explicitly affiliated with professional comedians and satirical media organizations, while others, such as @BigBirdRomney and @RepubGrlProbs, were created during the previous 12 months and appeared to exist solely for the purpose of political humor. To identify the prevalence of these “strictly humor” accounts, we undertook a systematic content analysis of accounts.
The discourse among connected viewers of the debates was fundamentally shaped by accounts sending out original tweets as opposed to retweets. The visibility of these accounts was amplified, in turn, through the retweets sent by others. To facilitate a sampling strategy based on the relative visibility of individual accounts, we assigned a visibility measure to each account, constructed in two steps: First, we calculated the retweet frequency of every original tweet in the corpus. Second, we summed the retweet frequencies for each account sending one or more original tweets. We then ranked the population of accounts by retweet frequency and removed accounts with zero retweets. The resulting subpopulation included 1,427,230 accounts or 26.32% of the connected viewing population. The distribution of retweets was highly skewed. We traced 50% of all retweets back to just 3,399 accounts (0.0001% of all accounts in the corpus). Because visibility was not normally distributed, we stratified the ranked population of accounts into four quartiles (Table 2). Each quartile represented an approximately equal number of aggregate retweets.
Connected Viewers Retweeted Once or More Ranked and Stratified by Retweet Count.

Note. A total of 1,987,748 retweets could not be reliably traced back to an original tweet and were excluded; 1,100,324 were “manual” retweets and 887,424 were retweets of messages sent outside of the observation period.
To identify strictly humor accounts, we examined the profile page of each account in situ on twitter.com and answered the question: “Is the main purpose of this Twitter account humor, comedy, parody, or sarcasm?” This prompt was purposefully agnostic about the style or genre of humor at work. Only those accounts that appeared to exclusively send out messages fitting one or more of these criteria were classified as “strictly humor.” The human coders assigned to this task were graduate students and faculty with subject area expertise and contextual knowledge based on their experience as participant observers during the debates. Coders were instructed to take into consideration the account’s profile picture and design, the account’s bio, and recent tweets. They were not asked to review the account’s activity during the debates. 6
Five coders were trained using a preliminary sample of 151 accounts (Riffe, Lacy, & Fico, 2005). The reliability sample was stratified according to the four quartiles: 14 accounts from the top-ranked quartile, 25 from the second most retweeted quartile, and 56 each from the least retweeted quartiles. Reliability scores were calculated independently for each quartile (Table 3). 7 The coders proved highly reliable only when coding accounts from the top quartile (α = 0.92), a distinction that suggested a qualitative difference between the most visible accounts and the rest of the sample.
Intercoder Reliability for the Analysis of Accounts.
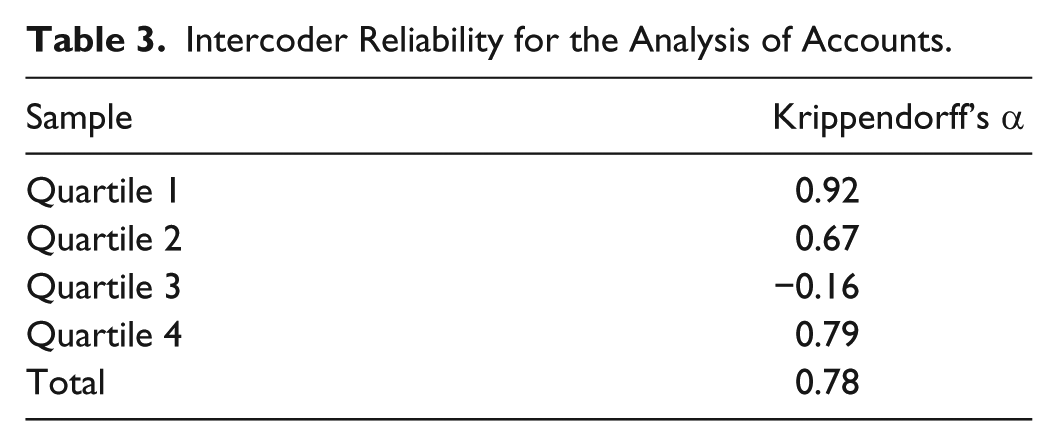
The coders overwhelmingly agreed that the accounts from the less-visible three quartiles were not strictly used for humor. Of the 137 accounts in the less-retweeted groups, only 12 (or 8.76%) were identified as strictly humor by one or more coders. In contrast, 8 of the 14 (or 57.1%) accounts drawn from the top-ranked quartile were coded as strictly humor. Based on these results, we decided to analyze only the top-ranked quartile. Strictly humor accounts appeared so rarely in the lower ranked quartiles that it would be impossible to distinguish the results of human coding from random chance, a phenomenon identified by Krippendorff (2004).
After completing the reliability test, a census of the remaining highly visible accounts was distributed evenly among the coders (N = 196). Of these, 61 accounts (31.1%) were coded as strictly humor. These accounts sent 2,619 original tweets that were, in turn, retweeted by others 1,239,552 times during the debates. In total, accounts identified as strictly humor by our coders were responsible, directly and indirectly, for 1,242,836 tweets and retweets, or 3.71% of the full corpus. All the humor accounts in the top quartile tweeted primarily in English. All the original tweets authored by strictly humor accounts and the accompanying retweets were marked as “humor” in our database.
Identifying Unambiguously Humorous Tweets
The previous analysis revealed that a small number of Twitter accounts dedicated exclusively to humor were responsible for an outsized volume of highly visible (i.e., frequently retweeted) messages. Yet, our participant observation suggested that humorous activity spread far beyond these strictly humor accounts. To estimate the prevalence of humor among accounts that were not strictly dedicated to humor, we carried out a quantitative content analysis of original tweets.
To prepare a population of tweets for analysis, we calculated the frequency with which each original tweet was retweeted, removed tweets with zero retweets, and ranked the remaining population. We also excluded any tweet marked as humor in the previous two rounds. The resulting population included 3,106,594 original tweets that were collectively retweeted 13,125,117 times. The distribution of retweets among original tweets was highly skewed—more than half of the tweets (57.48%) were retweeted just once—so we stratified the retweeted tweets into four quartiles representing equal shares of the overall visibility (Table 4).
Ranked and Stratified Population of Original Tweets.

Note. Tweets referring to Big Bird, binders, or bayonets, and tweet sent by strictly humor accounts were excluded.
In this stage of the analysis, we classified the tweets as either “humor,” “non-humor,” or “unsure.” The coders were prompted to mark a tweet “humor” if it “appeared primarily authored for the purpose of humor” (see Appendix for the complete codebook). To avoid biases in coders’ individual senses of humor, we instructed the coders to conjecture about the author’s motivation in composing a tweet rather than evaluate the content alone. In practice, this allowed coders to mark a tweet as “humor” even if it did not strike them personally as funny. Coders were further instructed to label tweets conservatively, preferring to exclude rather than include edge cases. In addition to in-person training, coders were provided with 13 example tweets, 7 of which were marked as “humor” and 6 of which were marked as “non-humor.” A stratified reliability sample was taken from the four quartiles and distributed to the team of coders (N = 73). The team underwent two rounds of reliability testing and reached a satisfactory level of intercoder reliability given the difficulty of the coding exercise (α = 0.685). Reliability scores were calculated using the ReCal software package (Freelon, 2010).
A stratified sample was drawn independently from each quartile of the population and combined into a single sample (N = 1,503) to achieve a 95% confidence level. At the conclusion of the coding exercise, 327 (21.76%) tweets were identified as “humor,” 1,061 (70.59%) were coded “non-humor,” and 115 (7.65%) were marked “unsure” and set aside for close textual analysis (Table 5). Consistent with the analysis of accounts, the proportion of cases clearly identifiable as humor was greatest among the top-ranked highly retweeted tweets; messages sampled from lower in the rankings tended to be more difficult for coders to interpret. Using the approach described in Riffe et al. (2005, p. 109), we determined that the sampling error of proportion for the stratified sample was 0.0189 at a 95% confidence interval. Because of the strict coding instructions, these results should be interpreted as a conservative but reliable under-estimate of the prevalence of humor in the sample.
Humor Among Original Tweets Sent During the US Presidential Debates in 2012.
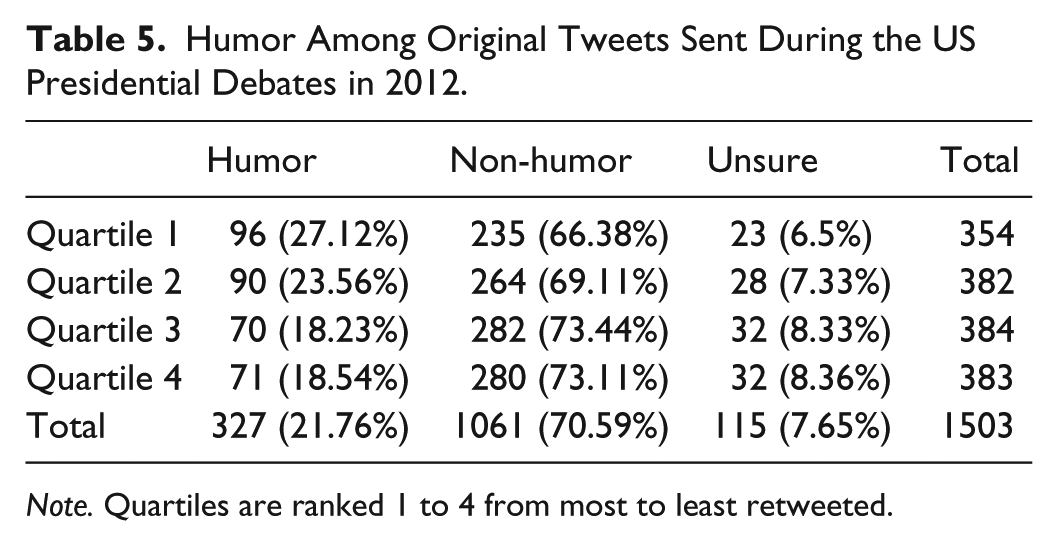
Note. Quartiles are ranked 1 to 4 from most to least retweeted.
Findings
How Much of the Overall Connected Viewing Activity was Dedicated to Humor?
To estimate the overall proportion of connected viewing activity related to humor, we generalized from the sample of tweets coded “humor” in our database to the total corpus of tweets. To account for the skewed distribution of retweets, we stratified the total population of original tweets and calculated independent estimates for each quartile. Every original tweet was assigned to one of the four quartiles according to its retweet count (Table 6). Original tweets with zero retweets were assigned to the least visible group, quartile 4. Original tweets sent prior to, but retweeted during, the observation period were analyzed separately. After every tweet and retweet was assigned to one of the four groups, we calculated an independent estimate of humor for each group and summed the results (Table 7). Using this stratified approach, we estimate that 6,865,493 messages, or 20.49% of the corpus, were clearly intended as humor.
Retweeting of Original Debate-Related Messages.

Estimated Proportion of Humor Within the Stratified Population of Debate-Related Tweets.

Our estimates indicated that humor was more prevalent among retweets (22.22%) than original tweets (18.55%). This difference suggested, but did not prove, that tweets expressing humor were retweeted more often than non-humor tweets.
What was the Relationship Between Humor and Visibility Among Live-Tweeting Viewers?
To investigate whether humorous messages gain more visibility (i.e., receive more retweets) than non-humorous messages, we modeled a negative binomial regression to predict the number of retweets that a particular original tweet received, controlling for a number of variables, including if the tweet was categorized as strictly humor by a human coder. 8 The model allows us to infer how much the presence of humor in an original tweet impacted the resulting number of retweets. In addition to whether or not the tweet was intended to be humorous, our model included six additional independent variables that may also have contributed to the retweet count (N = 1,346):
Number of Retweets
A dependent count variable of retweets per tweet (min = 1, max = 8387, M = 200.994, SD= 538.079).
Humor
A dichotomous variable indicating whether the tweet was coded strictly humor (yes = 317, no = 1,029).
Minutes from Start
The number of minutes between the start of the observation period and the time that the tweet was posted (min = 1, max = 315, M = 121.008, SD= 41.977).
Author Followers
The number of followers, logged, of the tweeting account at the time that they sent the tweet (min = 1.609, max = 16.871, M = 8.366, SD = 2.868).
URL
A dichotomous variable indicating whether the tweet contained a URL (yes = 73, no = 1,273).
Media
A dichotomous variable indicating whether the tweet contained media (such as an image; yes = 11, no = 1,335).
Hashtag
A dichotomous variable indicating whether the tweet contained one or more hashtags (yes = 413, no = 933).
Hashtag Count
The count of the number of hashtags in the tweet (min = 0, max = 7, M = 0.410, SD= 0.738).
The model shows that, after controlling for all other variables, tweets labeled humor were significantly more likely to be retweeted (Exp(β) = 2.537, p < .001); humor tweets had around a 2.5 times higher log of expected counts of retweets than non-humor tweets (Table 8). Other factors that contributed positively to the number of retweets were the author’s (logged) number of followers (Exp(β) = 1.712, p < .001) and if the tweet contained media (Exp(β) = 1.298, p < .001) or at least one hashtag (Exp(β) = 1.800, p < .001). Multiple hashtags had a significant, lower log of expected retweets (Exp(β) = 0.822, p < .001).
Negative Binomial Regression Predicting Count of Retweets.

N = 1,346; *p < .05, **p < .01, ***p < .001.
Log likelihood: −6,831.889
Reference categories: humor (no), has_url (no), has_media (no), has_hashtag (no).
The model supports our intuition that humor contributed to the overall visibility of original tweets. Not only was a large proportion of connected viewing activity dedicated to humor, but clear expressions of humor were made more visible than other messages in the corpus.
Discussion
Retweeting is a platform-specific mechanism for the collective allocation of visibility. During the 2012 US presidential debates, a small number of accounts and messages became unusually visible after receiving an overwhelming majority of retweets. While this unequal distribution of visibility may be partially explained by contextual factors such as an account’s preexisting notoriety or the mechanism by which Twitter curates search results, our analysis demonstrates the critical role of humor in the allocation of attention. Many connected viewers were afforded greater visibility specifically because of their use of humor.
Most connected viewers participated in the allocation of visibility via retweeting. Not only did retweets account for a majority of the tweets in our collection but the majority of participants (3,748,179 or 69.11%) in our corpus sent at least one retweet and 1.6 million accounts (28.96%) exclusively sent retweets. The most prolific accounts retweeted constantly during the broadcast; 326 accounts sent at least one retweet per minute. Conversely, most of the accounts that sent at least one original tweet were never themselves retweeted. Of the nearly four million participants who sent an original tweet during the observation period, only 1,427,230 (37.04%) had one or more of their messages retweeted.
Silence and invisibility are the steady states of social media. Many legitimate forms of participation—reading, searching, direct messaging, and laughing out loud—were simply invisible to our data collection apparatus and therefore also our analysis. One hint at the size of this invisible connected viewership was a set of 1.6 million accounts (28.96% of the overall population) that sent only retweets and no original tweets during the debates. Similarly, the 2,045,350 accounts (37.71%) that sent just one original tweet were somewhat more likely than the rest of the connected viewership to send out their sole messages just before the start of the debate (i.e., signaling their otherwise silent presence). The prevalence of these quiet activities is a reminder that a truly complete population of Twitter participants would include those who read tweets without ever posting or retweeting.
In practice, the circulation of humor took many forms on Twitter during the debates. We observed both spontaneous bursts of humor in response to the live event as well as generic one-liners and accounts that exclusively trafficked in humor. While contemporaneous coverage by journalists focused on a handful of humorous moments, our analysis demonstrates that highly publicized gaffes such as Big Bird, “binders full of women,” and “horses and bayonets” made up just a small proportion (2.53%) of the overall debate-related humor on Twitter. Strictly humor-only accounts, meanwhile, occupied a larger share of the corpus (3.71%). Indeed, of the top quartile of most visible Twitter accounts, we labeled nearly one in three (31.1%) as “humor-only.”
Succinctly characterizing the full range of humorous themes and practices in circulation during a mass-scale live-tweeting event remains a challenge. The outsized attention paid to Big Bird, binders, and bayonets during and after the debate was not incorrect, per se, but rather reflects the mechanics of visibility on Twitter. As this research demonstrates, humorous accounts and messages are more likely to be retweeted and, therefore, afforded greater visibility on the platform.
Limitations
While our method of combining participant observation with software-assisted data collection is an improvement over studies that exclusively analyze a predetermined set of hashtags, our keyword management system may have missed some tweets sent before the addition of a particular rule (though we believe these cases to be minimal). In addition, retweet count is a relatively narrow measure of visibility, given that some tweets were reproduced in mass media news coverage. While we cannot measure the total visibility of a given message, the retweet counts we observed were accurate measures of visibility within the system. Accounts and tweets with high retweet counts simply have a greater chance of being seen than their peers. Finally, the definition of humor in our content analysis procedures was, out of analytical necessity, particularly conservative. A more robust approach might independently analyze multiple categories of humor defined by genre and style.
Conclusion
Humor was fundamental to the political discourse on Twitter during the US presidential debates in October 2012. This multi-method content analysis indicates that at least one in five of the tweets sent by connected viewers of the presidential debates was either itself humorous, satirical, snarky, or parodic, or else referred to the humorous discourse of other users. We also found that a higher proportion of retweets (22.22%) than original messages (18.55%) were related to humor. Regression analysis supported our intuition that the presence of humor was a significant factor in the retweet counts of original messages. Not only was humor widespread among connected viewers of the debates but humorous tweets were afforded greater visibility than other messages.
Expressions of humor in our database ranged from the spontaneous to the pre-scripted, from the carefully crafted to the crude. The overall volume of humorous tweets makes clear that any effort to use aggregated social media messages as a proxy for public opinion must contend with the challenge of interpreting humor in all of its many varieties. Whether in academic, journalistic, marketing, or advocacy contexts, it is essential that social media researchers anticipate the prevalence of humor to avoid misrepresenting the discourse unfolding online. Researchers must be aware of the limits of off-the-shelf tools for text mining and sentiment analysis. Social media systems support a wide range of themes, practices, and participants. To represent this diversity of activity with validity and care, it is essential that we adopt appropriate methods shaped by firsthand participation.
The positive relationship between humor and visibility is especially salient to individuals and organizations seeking a greater share of public attention. As scholars, journalists, and practitioners have observed, attention-seeking tactics such as “joke stealing” and “content farming” exploit the connection between humor and visibility to attract massive audiences (e.g., Bonair, 2012; D’Orazio, 2015; Gates, 2015; Knibbs, 2014; O’Neil, 2015). While these tactics were pioneered by relatively harmless spammers, they are now used for the purposes of politics, persuasion, and propaganda. Recent work by investigative journalists reveals far-right activists in the United States using humor to avoid censorship by platforms, offer plausible deniability to publishers, and gain legitimacy among otherwise moderate audiences (e.g., Bernstein, 2017; Feinberg, 2017). In short, humor has become an effective conduit for extreme, racist, and anti-social speech on social media (see also Phillips, 2015; Phillips and Milner, 2017). As a rhetorical form that provides visibility and legitimacy to unpopular ideas, humor will continue to shape the future of political communication, demanding serious methodological creativity and theoretical sophistication.
Footnotes
Appendix 1
Acknowledgements
The authors are grateful for earlier comments and contributions from Mike Ananny, Kjerstin Thorson, and database management from Hao Wang and Abe Kazemzadeh. Useful feedback was obtained from presentations on this research at the 14th and 16th annual conferences of the Association of Internet Researchers and the 99th annual convention of the National Communication Association.
Declaration of Conflicting Interests
The author(s) declared no potential conflicts of interest with respect to the research, authorship, and/or publication of this article.
Funding
The author(s) disclosed receipt of the following financial support for the research, authorship, and/or publication of this article: This research was supported in part by USC Annenberg Graduate Fellowships and the Annenberg Innovation Lab.