
Abstract
The headache any researcher faces while using Twitter data for social scientific analysis is that we do not know who tweets. In this article, we report on results from the British Social Attitudes Survey (BSA) 2015 on Twitter use. We focus on associations between using Twitter and three demographic characteristics—age, sex, and class (defined here as National Statistics Socio-Economic Classification [NS-SEC]). In addition to this, we compare findings from BSA 2015, treated as ground truth (known characteristics), with previous attempts to map the demographic nature of UK Twitter users using computational methods resulting in demographic proxies. Where appropriate, the datasets are compared with UK Census 2011 data to illustrate that Twitter users are not representative of the wider population. We find that there are a disproportionate number of male Twitter users, in relation to both the Census 2011 and previous proxy estimates; that Twitter users are predominantly young, but there are more older users than previously estimated; and that there are strong class effects associated with Twitter use.
Introduction
In the past decade, the social sciences have undergone a revolution in response to the challenges of utilizing “big data” for social scientific analysis. The data generated by social media platforms such as Twitter are indeed “big” as defined by Kitchin and McArdle (2016) and present particular problems for researchers through their size, the speed at which data are generated, their variety (text, images, audio, videos, hyperlinks), their exhaustivity (populations rather than samples), tight and strong resolution and indexicality, strong relationality built on networks, and high extensionality and scalability (Kitchin & McArdle, 2016). Underlying all of this is the question of veracity in regard to the authenticity of both the message being conveyed (Williams, Burnap, & Sloan, 2016) and, of principle importance for this article, who is producing the content. Because social scientific analysis is based on the investigation of group differences, this inability to accurately categorize social media users into demographic groups stymies the potential for researchers to fully embrace the “big data” revolution. For example, we cannot test hypotheses regarding the use of particular vocabulary on Twitter as a function of gender. We may be able to estimate political affiliation based on tweet content, but without knowing the age of the user we cannot estimate their propensity to vote. Without knowing social class, we cannot test whether Twitter is an emancipatory platform that allows users to transcend class structures or whether it simply reproduces hierarchies from the social to the virtual.
Developing demographic proxies for Twitter is thus a key endeavor for 21st-century social science, but proxies are just that—best estimates of a user’s demographic characteristics based on a set of rules. While most computational approaches involve some level of human validation as a quality control, the sheer amount of data being processed means that researchers are heavily reliant on algorithms with limited reliability, and fundamentally, we do not know the truth. To clarify, a gender detection algorithm may search for first names in an attempt to categorize a Twitter user and human validation may agree with the categorization, but there is no mechanism for verifying this with the person from whom these data have been collected.
So the issue that remains to be resolved is relatively straightforward: Are such algorithmic approaches reliable? This article tackles this question by comparing the UK Twitter population as estimated by recent work on demographic proxies with new data from the British Social Attitudes Survey (BSA) 2015. We compare the distribution of gender, age, and social class reported through computational means with equivalent measures collected via a random probability sample survey, weighted to be representative of the Great British population. In turn, we provide UK Census 2011 data as a baseline from which to judge to what extent Twitter users are representative of the population of interest.
Literature Review
In response to concerns about the ability of the academic community to keep pace with the explosion of digital and transactional data (Savage & Burrows, 2007, 2009), there has been a flurry of theoretical (Edwards, Housley, Williams, Sloan, & Williams, 2013; Kitchin, 2017; Kitchin & McArdle, 2016), methodological (Murthy, 2008; Schwartz et al., 2013; Sloan & Morgan, 2015; Sloan, Morgan, Burnap, & Williams, 2015; Sloan et al., 2013), and substantive (Williams et al., 2016) work trialing new approaches and methods covering topics as wide ranging as predicting flu epidemics using Google search data (Ginsberg et al., 2009), modeling box office revenue through activity on Wikipedia (Mestyán, Yasseri, & Kertész, 2013), and using Twitter to forecast exchange rates (Papaioannou, Russo, Papaioannou, & Siettos, 2013), predict user income (Preoţiuc-Pietro, Volkova, Lampos, Bachrach, & Aletras, 2015), or forecast elections (Burnap, Gibson, Sloan, Southern, & Williams, 2016).
Indeed, Twitter has been the platform of choice for many of these studies because of the ease of accessing the data through the streaming application programming interface (API), where users can collect data directly from Twitter as they are produced (Burnap, Avis, & Rana, 2013), and the fact that up to 1% of global data produced can be accessed for free in real time (Sloan et al., 2013). Data extracted through the streaming API contain a wealth of information and metadata in addition to tweet content, such as user profile description and number of follows/followers. Twitter is also an open platform that allows qualitative research to take place for small n studies that offer great insight into motivations and behavior online (see boyd (2015) for a discussion of ethnographic research strategies for social media). Yet, despite the ease of access to data and the temporal and (sometimes) geographical granularity it has (Sloan, 2017), issues of representation can stymie research.
The fly in the ointment for any social scientific research using Twitter is that we do not know who tweets (Mislove, Lehmann, Ahn, Onnela, & Rosenquist, 2011), and we have no way of knowing who is and isn’t represented (Gayo-Avello, 2012). Twitter does not require users to publish demographic data, and this paucity of information on who is represented on the platform undermines attempts by researchers to explore how social phenomenon manifests online in relation to gender, age, location, occupation, and class. For studies that attempt to predict elections (Burnap et al., 2016), we cannot account for differential voter turnout based on personal characteristics; for investigations into predicting rates of recorded crime through the preponderance of crime and disorder terms in tweets (Williams et al., 2016), we cannot control for exposure to certain types of crime based on demographic differences. We also know that different social media platforms attract different types of users (Haight, Quan-Haase, & Corbett, 2014), and thus we cannot assume that the types of users on a platform such as Facebook (on which demographic data are relatively abundant) are similar to those using any other social media service. In short, social scientific analysis is based on the investigation of group differences, but we can’t easily identify the groups.
In response to this, there have been attempts to profile the demographic characteristics of Twitter users which have drawn on metadata to estimate location, gender, language use (Sloan et al., 2013), occupation, social class (National Statistics Socio-Economic Classification [NS-SEC]), and age (Sloan et al., 2015). These induced demographic proxies have in turn been used to understand differences in behavior, such as the tendency to enable location services and geotag tweets (Sloan & Morgan, 2015).
Despite this work, the fact still remains that the lack of ground truth data for Twitter user demographics, where ground truth is defined as a known (rather than estimated) individual characteristic, means that we can’t be sure that these categorizations are correct or that we can reliably and accurately say that we know who is and isn’t represented on Twitter. For example, the apparent over-representation of lower managerial, administrative, and professional occupations (NS-SEC 2) may be a function of users reporting hobbies rather than their occupations and the skew in favor of young users may be due to older tweeters simply not wishing to disclose their age (Sloan et al., 2015). Without verified data on demographics, we cannot evaluate the accuracy of the demographic projections derived from these proxies.
In light of this, this article presents new data from the BSA 2015 on who uses Twitter in Great Britain (GB) and compares the demographic data from the survey with existing projections derived from demographic proxies. Accordingly, this article sets out to answer two research questions:
RQ1. To what extent are certain demographic characteristics associated with Twitter use for GB users?
RQ2. To what extent do the survey data confirm or challenge the demographic picture of Twitter users using computational methods that derive information from profile metadata?
The first question addresses the relatively simple question of “who tweets?” and the answer will provide researchers using Twitter with an understanding of representation of the British population in relation to sex, age, and class (NS-SEC).
The second question aims to evaluate recent attempts to explore issues of representation through the development of demographic proxies. Such methods use Twitter metadata to induce the representation of certain groups using the platform. Having the BSA data allows us for the first time to assess how accurate these methods are; however, it is important to bear in mind that the derivation methods looked at UK Twitter users (including Northern Ireland), while BSA only samples GB users (not including Northern Ireland). The Northern Ireland population accounts for around 1.8 million people, or 2.8% of the UK population (Office for National Statistics [ONS], 2013). Because this is such a small proportion and because we have no a priori reason to believe that Twitter use would significantly vary in this region as a function of demographic characteristics to the rest of the United Kingdom, we attempt to answer the research question to the best of our ability while considering the limitations of the data. Where Census data are reported, they refer to the whole United Kingdom to maintain comparability with the Twitter data and previous studies. In pragmatic terms, the demographic proxy approach needs to be evaluated against survey data, and this provides a starting point.
There have been recent attempts to profile the Twitter population using survey methods. Duggan and Page (2015) present the demographic picture for a range of social media platforms but only for users in the United States. Closer to home, the Ipsos Mori (2016) Tech Tracker reports do a similar job for users in GB; however, the samples are smaller than the BSA, fulfilled by quota rather than random probability sampling, and the data are aggregated to a higher level (e.g., using age groups rather than age by year and less refined measures of social class). In summary, no other study has profiled the UK Twitter population to this granular a level with such a large sample size or compared survey data against derived demographic proxies to evaluate their accuracy and reliability.
BSA 2015
The BSA is run by NatCen Social Research and has been conducted annually since 1983 (NatCen Social Research, 2016a). Around 3,000 people are surveyed each year using random probability sampling, ensuring that there is a known chance of everyone in the population of interest being selected (British residents, 18 years plus); thus, the results are representative of the British population (NatCen Social Research, 2016b). In 2015, the sample size was 4,328. Weights are calculated to adjust for any non-response bias and the weighting variable
All respondents were asked whether they used Twitter or not, with the exact phrasing of question and response as follows: Twitt Do you have a personal Twitter account? 1 Yes 2 No 8 (Don’t know) 9 (Refusal)
This variable (
It is worth reflecting on the limitations of the BSA data for the purposes of comparison with demographic proxies. Users can sign up to Twitter from the age of 13, while BSA respondents are all 18 or over, and previous research has indicated that over 30% of tweeters for whom age could be identified are 18 or under (Sloan et al., 2015). When presenting the two data sources side by side, we have not trimmed the x-axis at 18 precisely to make the point that a significant proportion of the Twitter user base is not represented in the survey data and this needs to be considered when interpreting results. The survey item on Twitter use was specifically designed to capture personal rather than business or organizational accounts. There is complexity around the relationship between an individual and how they may use an account, and it is possible that some respondents who have professional accounts might not have declared them, deeming such activity as not being personal.
Gender/Sex
Table 1 gives a breakdown of Twitter use crosstabulated against sex with row percentages and shows that a higher proportion of Twitter users identified as male than female.
Cross Tabulation of Twitter Use and Sex from BSA 2015.

BSA: British Social Attitudes Survey.
The gender split within the subgroup of those who use Twitter is 57% male and 43% female, which is a notable discrepancy from the male/female split of 49.1% and 50.9%, respectively, in the UK population according to the 2011 Census (ONS, 2011). Previous studies using demographic proxies estimated a split of around 48.8% male and 51.2% female users using first name identification (Sloan et al., 2013). Treating the BSA 2015 data as ground truth, the proportion of users identified as using female names in their Twitter profiles is disproportionately high. One explanation for this difference may be due to the high number of cases for which a gender could not be identified (or was considered unisex) as no discriminating first name was found in the profile data. Table 2 presents the proportional gender split while taking account of “unknown” group for tweeters.
Gender Split on Twitter Using Derived Proxy Measures.
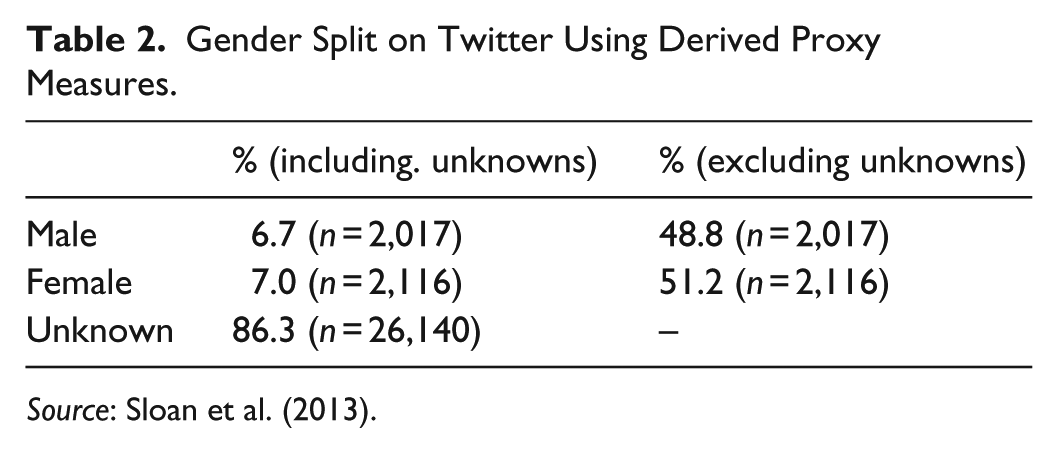
Source: Sloan et al. (2013).
Table 2 illustrates the fact that for a majority of users gender could not be identified, suggesting that no first name could be found in the profile metadata, or if a name was found, it did not fit neatly into a male or female category. (Sloan et al. (2013) found that in 8% of cases where a name could be identified, it was unisex.) As the gender detection algorithm looks for the presence of first names in profile data, we could conclude that there is either a disproportionate preponderance of female names or an underrepresentation of male names used on the platform. There are two possible explanations for why this might be the case relating to online identity and deception, respectively. Male Twitter users may simply be less likely to put a first name in their profile because of how they choose to present their virtual selves. Kapidzic and Herring (2011) studied profile pictures used on teenage chatrooms and found that male user profile pictures tended to have averted eye contact and appear more distant than female users, which mirrors gender differences in face-to-face behavior (Kapidzic & Herring, 2014). As construction of online identities appears to be a function of gender identification, we might expect the “distancing” behavior of male users to manifest through profile data, in this case resulting in a systematic tendency to avoid including a first name. If this were the case, then male users are hidden in the “unknown” group. Alternatively, even before the advent of web 2.0, social media scholars were struggling with issues around presentation and authenticity on the Internet (Turkle, 1995), and although the democratization of the Internet beyond an elite few has reduced the tendency for identity play (Joinson, 2003), deception in online communications remains a facet of virtual life (Caspi & Gorsky, 2006) and presentation of the self can be expressed differently in online and offline contexts (Yang, Quan-Haase, Nevin, & Chen, 2017); thus, it might be that male users are engaging in identity play and using female pseudonyms and the “unknown” category contains a proportional male/female split. Inevitably, the issues of authenticity and virtual identity arise for all demographic characteristics, and highlighting these discrepancies is one of the values of cross-referencing derived proxies with survey data, even if the explanations for the differences are yet to be explained.
Age
Of the 4,328 respondents, 4,321 gave their age (six refused and one responded that they didn’t know). Figure 1 shows the distribution of age by year for the whole sample (weighted) and also for only those respondents who said that they used Twitter. Because the number of cases is divided into many small groups (age by year), we should focus on the overall shape of the distribution rather than individual proportions of use by age.
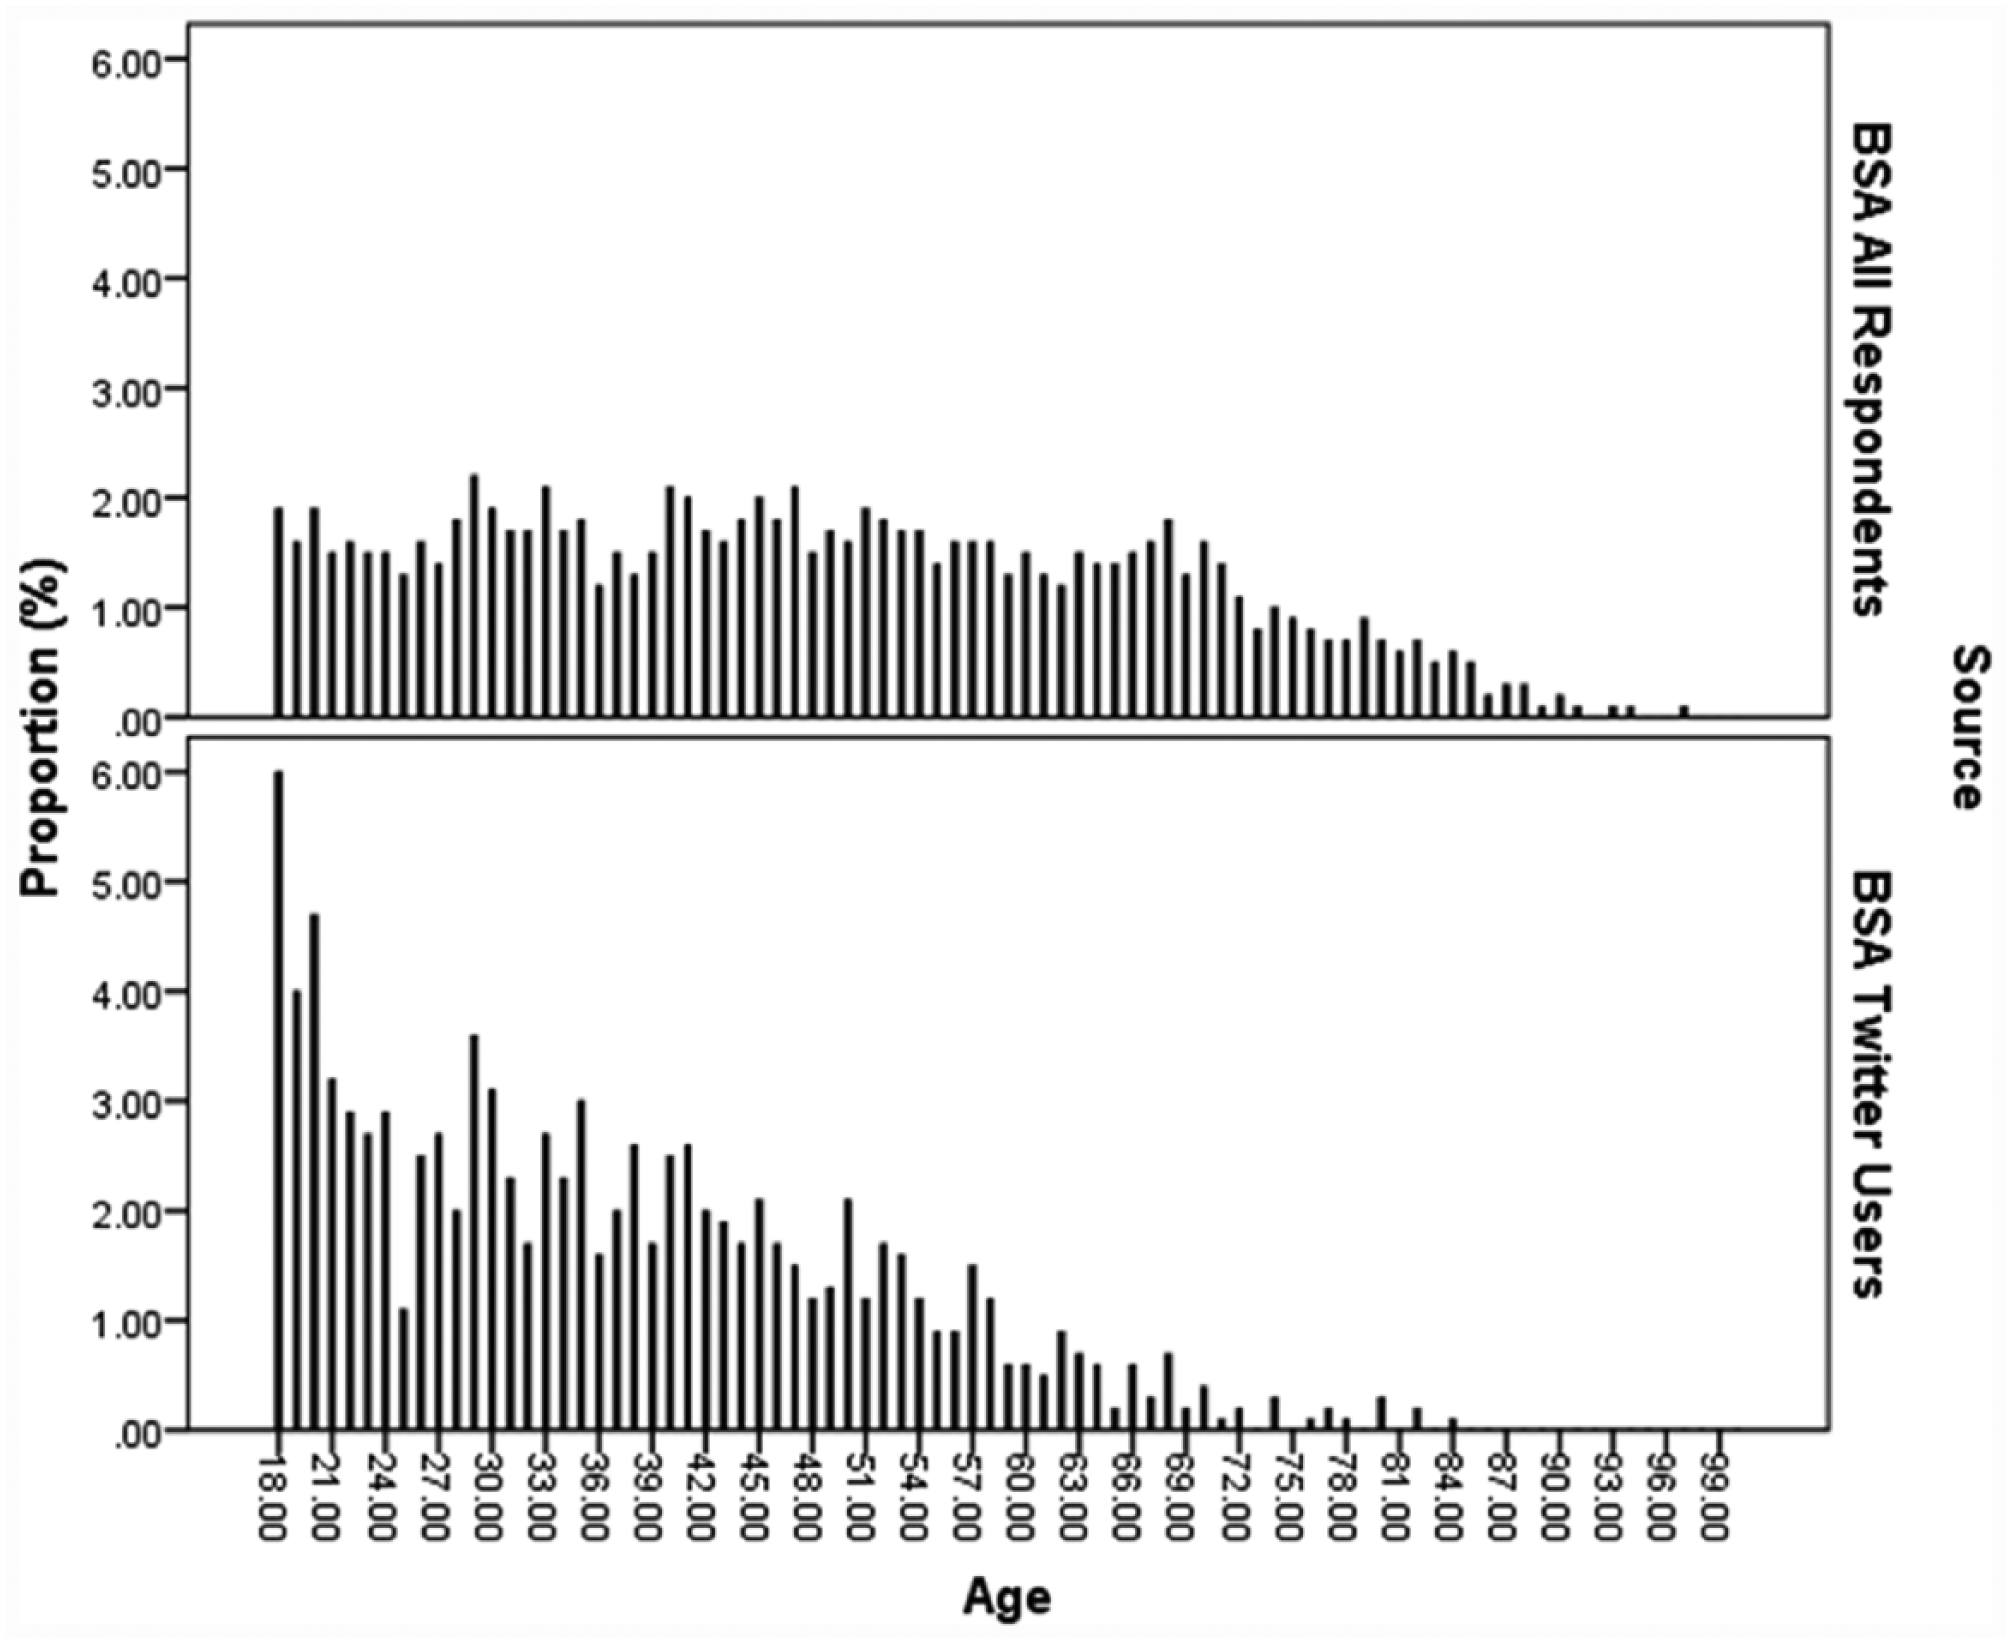
Comparison of age distribution for all BSA 2015 respondents and those who use twitter.
The lower half of Figure 1 illustrates the relative youth of Twitter users and a clear left-hand skew, but there are also a significant number of respondents over the age of 30 who use Twitter. Previous research has suggested that the actual population of Twitter users in the United Kingdom is much younger than suggested in Figure 1. Sloan et al. (2015) searched Twitter profile data for signatures of age through pattern matching for phrases such as “XX years old” or “born in XXXX.” Figure 2 compares the age distribution of tweeters from the BSA 2015 data with the age distribution of this derived age data, and the difference is marked. Users can sign up to Twitter from the age of 13, so the derived age categorization starts at this age, while main respondents on BSA 2015 are 18 or older. While this must be taken into account when comparing the two data sources, the overall shape of the distributions indicates a systematic under-counting of older users (or, indeed, a systematic over-counting of younger users) when inducing age from profile data.

Comparison of age distribution for BSA 2015 Twitter users and derived age.
Why might this be the case? Simply put, there are two possible explanations. Younger people may be more likely to express their age in their profiles perhaps as a function of how they use Twitter (for social interactions with peers), while older users may not personalize their account to such an extent if they prefer to use Twitter as a news source. If this is indeed the case, then it is not surprising that younger users are more likely to share information about themselves as it provides a mechanism through which they can “make friends” through crafting a profile (boyd, 2006) even if sharing sensitive data is a risky behavior (Livingstone, 2008). boyd and Marwick (2011) give an example from an interview to demonstrate how a 17-year-old male conceptualizes the difference between Facebook and Twitter: “Facebook is like yelling out to a crowd whilst Twitter is just like talking in a room” (p. 20). So while the audience for a tweet is actuality limitless, users are often producing content for an imagined audience (Marwick & boyd, 2010) not least because the manner in which a user engages with a social media platform has a clear impact on the manner in which they think it will be used by others, providing an explanation for what may appear to be naive behavior to older users. The second reason for the overestimation of younger users may be due to identity play (as discussed in the previous section)—that is, people pretending to be someone they are not or presenting what they perceive to be a more desirable virtual self, in this case a younger virtual self. It will be possible in future studies to investigate which of these two factors is at play on Twitter or, indeed, whether both are part of the explanation—we return to how this might be accomplished in the final section.
Social Class (NS-SEC)
The original variable from BSA 2015 (
NS-SEC Analytical Group Classification for all BSA 2015 Respondents.

NS-SEC: National Statistics Socio-Economic Classification; BSA: British Social Attitudes Survey.
Table 4 crosstabulates NS-SEC with Twitter use and presents row percentages to illustrate differing prevalence rates by group (note that percentages may not add up to 100 due to rounding). The proportion of Twitter users in Groups 1 and 2 is identical (28%) and notably higher than any of the other NS-SEC categories. When excluding the top two groups, the variance in usage is surprisingly small (5%), indicating homogeneity of Twitter use outside of higher and lower managerial, administrative, and professional occupations. The higher level of use in the two top groups offers support for the hypothesis that Twitter is used by some users to promote a professional identity or oneself or one’s work (Sloan et al., 2015), but an alternative explanation might be that Twitter is a useful tool for people in these occupational groups that may help with networking, keeping up to date with developments in industry, maintaining communication links with other organizations, or any other function that a social network can accommodate. Either way, the strength of association between managerial and professional occupations and Twitter use is notable.
Cross Tabulation of NS-SEC Analytical Group and Twitter Use from BSA 2015.

NS-SEC: National Statistics Socio-Economic Classification; BSA: British Social Attitudes Survey.
Focusing solely on the subgroup of those who do use Twitter, Figure 3 illustrates the distribution of users by NS-SEC group and compares findings from BSA 2015 with previous projections using demographic proxies and the UK population according to the 2011 Census. Comparison with the UK population at large is a useful benchmarking exercise, but previous to the BSA 2015 study it has not been possible to say whether the discrepancy with 2011 Census data is due to classification errors or a genuine demographic difference in Twitter use. The accuracy of methods using profile data to assign users to occupational groups has only ever been verified through human validation of a small subset of users. This process indicated that many misclassifications might occur due to users reporting on their hobbies and interests rather than actual occupations (e.g., writer, artist), but that this was less likely to happen in certain NS-SEC groups (such as 1 and 3) where occupational terms are more clearly defined and more likely to occur in NS-SEC 2 where occupations that could be confused with hobbies are located (Sloan et al., 2015). Small variations between data sources are commented on but should be treated critically due to the exclusion of Northern Ireland and the fact that the BSA data are a survey estimate.

Comparison of NS-SEC distribution for BSA 2015, Census 2011, and derived data.
Following this, Figure 3 paints an interesting picture. Derived proxies underestimate the proportion of user with “higher managerial, administrative, and professional occupations” (NS-SEC 1) on Twitter by 2.6%, with the BSA 2015 data suggesting that there is a higher prevalence of users from this group than previously demonstrated that is in excess of the proportion of NS-SEC 1 occupations in the UK population. There is a larger discrepancy for “lower managerial, administrative, and professional occupations” (NS-SEC 2) with derived proxy measures overestimating the proportion of users in this group by 5.1%; however, the BSA 2015 data confirm that there is a genuinely disproportionate number of users in this group compared to the UK population. Previous work suggested that because this is the group in which many occupational terms that may be confused with hobbies reside (such as “artist,” “singer,” “coach,” “dancer,” and “actor”), any algorithm looking for occupational terms related to NS-SEC 2 is susceptible to Type 1 errors (Sloan et al., 2015). The BSA 2015 data indicate that while there does appear to be a slight overestimation, the large discrepancy with data from the Census is genuine—there truly are a disproportionately higher number of users from NS-SEC 2 on Twitter relative to the UK population.
There is very little difference between all the sources regarding “intermediate occupations” (NS-SEC 3), likely because these occupational terms are clear and well defined and include terms such as “teacher” and “nurse”; thus, we may observe that automated categorization of occupational terms is particularly reliable for this group. “Small employers and own account workers” (NS-SEC 4) is the first group for which there is a substantial underrepresentation on Twitter, the magnitude of which has been slightly underestimated using derived proxy measures by 1.5% (although we can’t be confident that a real difference exists when the discrepancy is this small). This group includes occupations such as “photographers,” “farmers,” and “gardeners.” Although we might expect photography and gardening to be hobbies that people list on their Twitter profiles, the majority of occupations in this group are not likely to be confused with leisure activities.
“Lower supervisory and technical occupations” (NS-SEC 5) is the least represented occupational group in the UK population and even less well represented on Twitter according to derived proxy measures; however, the BSA 2015 data demonstrate that NS-SEC allocation using profile information results in a systematic and substantial underestimation of the proportion of users in this group in Twitter by 5.6%. NS-SEC 5 includes occupations such as “electrician,” “plumber,” and “locksmith,” and the comparison between sources indicates that users from this group are present on Twitter in approximately the same proportion as the UK population, but the underestimation of proxy measures suggests that they do not declare their occupation in their Twitter profiles. This is evidence of a behavioral difference based on NS-SEC that influences the manner in which people use Twitter and construct a virtual identity. Users from NS-SEC 5 do not typically define themselves through their occupation and it may be this behavior that results in an over-inflation of NS-SEC 2 if these users are referring to hobbies instead.
Those in “semi-routine occupations” (NS-SEC 6) are proportionally represented on Twitter relative to the UK population, and the BSA 2015 data indicate that this is an accurate assessment, but for “routine occupations” (NS-SEC 7) the picture is more complex. Users from this group are relatively underrepresented on Twitter according to the Census 2011, but derived proxy measures overestimate prevalence by 2.6%—most likely due to archaic occupational terms being confused with common parlance (Sloan et al., 2015).
Conclusion
This article set out to answer the following research questions:
RQ1. To what extent are certain demographic characteristics associated with Twitter use for GB users?
RQ2. To what extent do the survey data confirm or challenge the demographic picture of Twitter users using computational methods that derive information from profiles and metadata?
With reference to RQ1, the analysis of BSA 2015 in this article has demonstrated associations between Twitter use and sex, age, and NS-SEC for British users: Men are proportionally more likely to use Twitter than women relative to the male/female split of the UK population; the age distribution of Twitter users is younger than the age distribution of the UK population; and certain occupational groups are more likely to use Twitter than others—notably NS-SEC 1 and 2, characterized by managerial, administrative, and professional occupations.
What this article is unable to answer is why differences in Twitter use are associated with these demographic characteristics. While we have offered some thoughts on the motivations for Twitter use and crafting of a virtual identity (boyd, 2006; Caspi & Gorsky, 2006; Joinson, 2003; Turkle, 1995), much more research is needed to investigate the mechanisms through which these associations manifest. It is our sincere hope that by describing the UK Twitter population, we have provided a foundation for further work to build upon. However, the act of mapping these differences will have a significant impact on research that uses Twitter data. We now reliably know who is over- and underrepresented in GB with a greater level of reliability, and this sheds light on previous studies. As an example, Draper et al. (2016) report on an analysis of Twitter data during the horsemeat scare of 2013 when horse DNA was found in beef products consumed in the United Kingdom. The dominant discourse was one of humor, which seems an odd response until we reflect on the BSA 2015 data and see that the people in low wage occupations (NS-SEC 7) who would most likely be consuming the “low-quality” products that had been adulterated form a very small proportion of the Twitter population. As most thematic Twitter analysis is based on volume, this carefree attitude is not surprising as most users may not have deemed themselves to be at risk—being in higher status jobs with better incomes. This example draws attention to how easily smaller subgroups can be lost in the “noise” of big data and provides a warning for researchers. Clearly, an appreciation of the level of disproportionate representation from particular demographic groups can help us understand why bias in social media data might weaken the link between mentions of crime and disorder and recorded crime (Williams et al., 2016) and who may not vote despite displaying preference for a political party on the run up to a UK General Election (Burnap et al., 2016). In short, it was always highly likely that Twitter samples were not representative, and this article has further confirmed that, but now we know where the representation is lacking or inflated.
The second research question was concerned with evaluating existing automated methods for categorizing demographic characteristics based on signatures and clues in Twitter metadata. As there was no a priori reason to assume differential participation on Twitter based on demographic characteristics between Northern Ireland and the rest of the United Kingdom, we compared proxy measures with BSA 2015 data. For sex, we found that automated methods based on first name identification systematically underestimate the proportion of men on Twitter—possibly due to a high level of unknowns or differences between male and female behavior in profile construction. Because the BSA 2015 sample does not include users under the age of 18 while proxy demographic approaches can identify those aged 13 or above (the age at which Twitter “allows” users to sign up), we cannot make a direct comparison, but the shape of the distributions indicates that automated methods overestimate the youthfulness of the user community likely due to differences in reporting of age. For occupational classification, the picture is mixed, with high levels of similarity regarding the proportion of users for some groups (NS-SEC 3 and 6) and substantial variation for others (NS-SEC 2 and 5). Overall, considering the coarseness and simplicity of the rules used to categorize occupations and the messiness of the profile data used, automated classification appears to work in some cases and could be a useful tool following further refinement. For all three proxy demographic measures, comparisons with the BSA 2015 data identify where the weaknesses lay and highlight areas in need of improvement.
Automated detection tools are based on the assumption that users will offer information on their demographic background through profile information or other metadata (such as first name). While we would not expect all users to do this, if those who did were a random subset of the Twitter population, then we would not expect to find discrepancies in prevalence rates for sex, age, and occupation between automated measures and the BSA 2015 data. The fact that such systematic discrepancies do exist indicates that demographic characteristics are associated with differences in Twitter use, but the BSA 2015 data do not allow us to explain why these differences occur and, perhaps more importantly, what the origins of the differences are. For example, are female names over-reported or male names under-reported? To what extent do users engage in identity play around professed age? Is NS-SEC related to how a user uses Twitter—are there typologies of users that can be defined starting with the observation of these class differences?
The only way to answer these questions is to look at the relationship between a user’s actual demographic characteristics (as the ground truth) and how demographic categorization tools classify that user as a function of how profile information is presented and a virtual identity constructed. In short, there needs to be a link between Twitter profiles and survey data. In anticipation of this, BSA 2015 asked respondents whether they would be prepared to share their Twitter username to allow this data linkage to take place, and 283 users completed this field. While this article has described what is going on, the linked dataset will allow us to explore the mechanisms that are driving the descriptive picture. We very much look forward to presenting these data to the academic community in the near future.
Finally, the differences in Twitter use based on NS-SEC (particularly for Groups 1 and 2 compared to the rest) hint at tweeters using Twitter for different purposes, perhaps suggesting a distinction between those who use it in a professional capacity and others who use it for personal interests. Understanding user purpose and intention alongside the development of typologies of users would be of great use to any researchers working in this field and potentially offer an answer to the persistent question of what naturally occurring data are and can be taken to mean in respect to Twitter.
Footnotes
Acknowledgements
Declaration of Conflicting Interests
The author(s) declared no potential conflicts of interest with respect to the research, authorship, and/or publication of this article.
Funding
The author(s) disclosed receipt of the following financial support for the research, authorship, and/or publication of this article: This work was funded by the Economic and Social Research Council and Food Standards Agency under the Global Food Security program and the project titled “Public Perceptions of the UK Food System: Public Understanding and Engagement, and the Impact of Crises and Scares” (ES/M003329/1).
Author Biography
![]() ) and Senior Lecturer at the School of Social Sciences, Cardiff University, UK. His research is concerned with increasing the utility of Twitter data for the social science community, through the development and evaluation of demographic proxies, to establish who is and who is not represented.
) and Senior Lecturer at the School of Social Sciences, Cardiff University, UK. His research is concerned with increasing the utility of Twitter data for the social science community, through the development and evaluation of demographic proxies, to establish who is and who is not represented.