
Abstract
Introduction
This study compared fixed and individualized speed zone methods for quantifying external match load (EML) across classification and playing levels in women’s wheelchair basketball (WB) and examined their relationship with internal match load (IML) measures.
Methods
EML of 31 well trained female players (age: 28 ± 7 years, experience: 11 ± 5 years, weekly training: 12 ± 4 h) were quantified across 13 international (INT) and 5 Women’s Premier League (WPL) games using two inertial measurement units. A linear mixed model compared the percentage time in fixed and individualized speed zones and correlations with IML (eTRIMP, sRPE) using Pearson and Spearman Rho.
Results
Individualized zones recorded more time (10%) in low speed (Z3) and less time (0.3–5.9%) in moderate to very high-speed zones (Z4-Z6) versus fixed (p < 0.0001). Differences and effect sizes were greater in INT games (+0.8-1.1 pp) and highest classifications (+9.5 pp). Both methods correlated poorly with IML, except weak Z3 correlations at the INT level (p ≤ 0.020).
Conclusions
Speed zone method influences high-intensity movement assessments, varying by playing level and classification. Neither method optimally related to IML, highlighting the need for calibrated, consistent thresholds.
Introduction
Wheelchair basketball (WB) is a popular Paralympic sport, enabling athletes’ whose disability fits within one of the seven eligible impairment types 1 an opportunity to participate at the highest level. Examples of eligible disabilities that significantly affect an individual’s ability to play WB include spinal cord injuries (SCI), lower limb amputations, cerebral palsy, and other mobility impairments. Players are allocated a classification ranging from 1 to 4.5, based on the extent their physical impairment impacts their movement and function on the court; the sum of all 5 players on court must not exceed 14.0. 1 Internationally ineligible players may be classified as a 5.0 under the national classification system and play domestically, where teams are permitted a total of 14.5 on court at any one time. 2
The sport is an intermittent, high-intensity team sport played over four 10 min quarters, and is characterised by frequent high-speed sprints, accelerations, decelerations, and changes of direction.3,4 Quantifying the internal and external demands in wheelchair court sports is crucial to optimise training practices and athletes’ preparedness for competition. The external match load (EML) refers to the work performed on court, such as distance covered, time spent in speed zones, or number of high-intensity actions, while the internal match load (IML) reflects the physiological cost of that work, often measured using heart rate (HR) or rating of perceived exertion (RPE).5,6 The IML can be quantified as a training impulse (TRIMP) score using the time in HR zones 7 or as a session RPE (sRPE), 8 the product of session duration and RPE. Since HR monitoring presents known limitations for wheelchair athletes with SCIs, due to altered autonomic regulation, 9 and has demonstrated poor validity in intermittent sports, 10 practitioners are encouraged to combine both IML and EML metrics when assessing load in wheelchair court sports.
Technologies such as inertial measurement units (IMUs), placed on the wheelchair frames and wheel hubs, have proven effective for profiling wheelchair mobility performance and EML demands in wheelchair sports such as tennis, rugby and basketball.11–14 Wheelchair mobility performance refers to the kinematic output of the wheelchair-athlete system, including metrics such as speed, acceleration and movement patterns. 11 From these IMU-derived data, variables such as total distance covered, peak and average speed, number of efforts, and time spent in specific zones are typically extracted to estimate EML. The number of efforts or time spent (absolute or percentage) within specific speed zones, as seen in previous WB studies11–13,15,16 provides a more detailed understanding of EML intensity distribution compared to distance covered alone.
In non-disabled sport, speed zones are often expressed as a percentage of peak speed,17–19 however wheelchair sports have used diverse zonal approaches. Some wheelchair rugby studies have employed individualized zones based on peak wheelchair propulsion speed,15,16 whereas WB has relied on fixed speed thresholds,3,12,13 with the highest zones ranging from 2.50 m.s-13 to 3.50 m.s-1.11,13 However, these upper zones may only represent approximately 50 – 67% of an athlete’s peak speed, limiting the ability to measure high-intensity wheelchair propulsion. As a result, efforts of varying intensities may be grouped into a single, broad zone, reducing the sensitivity of the system to detect and differentiate high-intensity propulsion. This is particularly relevant given peak speeds of up to 5.22 m.s-1 have been reported during WB match play. 11
Wheelchair mobility performance varies depending on player classification and playing level.11,20 Players with lower wheelchair mobility performance, and therefore lower peak speed, may have fixed speed thresholds set too high, resulting in minimal time recorded in fixed speed high-intensity zones. 11 Conversely, those with higher peak speeds, due to their classification or playing level, may record more time in these zones, leading to an overestimation of high-intensity activities.18,19 The appropriate selection of zonal methods is essential to accurately gauge match load across players with varying wheelchair mobility performance. Despite these observations, no investigations have examined the applicability of these zones across classification or playing level groups within WB.
The primary aim of this study was to examine how fixed and individualized speed zone methods, which differ fundamentally in how speed thresholds are defined, influence the quantification of EML across classification groups and playing levels in women’s WB. Building on this, the secondary aim was to explore the relationship between EML quantified using these zones and measures of IML to evaluate how different approaches relate to physiological demand.
Methods
Participants
Thirty-one female WB players (age 28 ± 7 years, playing experience 11 ± 5 years, weekly court training 8 ± 3 h or 4 ± 2 sessions, weekly gym training 3 ± 1 h, weekly total training 12 ± 4 h) provided written informed consent and volunteered to participate in the study. Approval for the study was obtained by the Human participants sub-committee at Loughborough University (2022-8445-10161). For inclusion, players had to be a member of the GB national team (n = 11) or from four teams in the UK domestic female league (Women’s Premier League, WPL; n = 20). The WPL is a non-professional league, with each team permitted a maximum of four GB players. As a result, the standard of competition is lower than the international level. Players were excluded before data collection if their coaching staff identified they would not receive any playing minutes. All international and fourteen players from the domestic level held an international playing classification, 1 and six players had a classification from the National Governing Body. 2 All players used their own personalized sports wheelchair for all testing sessions.
Design
Competitive match play (excluding the warm-up periods) was monitored at two different playing levels, international level (INT) and the WPL. The INT matches took place over a four-month period (Aug – Oct 2022), during training camps leading up to the IWBF 2022 World Championships in November (which was later rescheduled to June 2023). Thirteen friendly international matches were used for data collection, with 100 observations collected. The WPL data was collected over a four-month period (Jan – Apr 2023) during the regular national league season. Data was collected from five league matches involving four teams (excluding the warm-up periods), totaling 31 observations. Teams ranked 2 to 4 were observed in games against the top ranked team, and the top ranked team was measured for two games, against the 2nd and 3rd ranked teams in the league. Prior to data collection, participants were familiarised with IMU technology on their wheelchair and wearing HR monitors.
Measurements
Wheelchair configurations (wheel diameter, chair width and camber angle) were measured during the study, for subsequent IMU data processing and the calculation of linear and rotational velocity, acceleration and displacement.14,21 Prior to match play and training sessions involving maximal sprinting, participants completed a standardised 20-minute warm-up on a standard wooden-sprung WB court. Maximal sprinting speed was assessed using three 20m maximal sprints from a stationary start, with 3-min passive recovery.
To measure speed, two IMUs (Movesense Active, Vantaa, Finland; 52 Hz) were secured onto straps with stiff foam padding and tightly fitted to the sports wheelchairs - one on the hub of the right wheel and the center of the frame. 21 Each IMU contained a gyroscope (2000 DPS), accelerometer, and magnetometer. Data from testing, training, and match play were transmitted via Bluetooth to an application on a handheld mobile device (Movesense Showcase, Version 11.0; iPhone SE, Apple Inc., California, USA).
For match play, EML was measured using the same IMU configuration. IML was collected using chest strap HR monitors (Polar Pro Chest Strap, Polar Electro Oy, Kempele, Finland) with data transmitted via Bluetooth to the Polar team pro tablet application (Polar Team Pro system, Polar Electro Oy, Kempele, Finland).
During all observations, substitutions and extended stoppages of time (time-outs, equipment delays, half-times, and quarter breaks) were noted. All data collection was performed by the lead researcher (embedded sports scientist, 6 years of applied sports science experience), a co-author (5 years of IMU data collection experience with wheelchair tennis) and supported by the sports strength and conditioning practitioner.
Data analysis
Data were excluded from the analysis if the athlete played less than 10 min of a match or if IMU Bluetooth connectivity disconnected for more than 30 s within a quarter.
IML
HR was recorded at ∼10 Hz and averaged at a rate of 1 Hz, with peak HRs determined for each participant at the end of the data collection period using the highest 5 s average HR during all observations. HR zones were split into Z1 (50-60% of peak HR), Z2 (60-70%), Z3 (70 – 80%), Z4 (80 – 90%) and Z5 (90 – 100%) and a training impulse (TRIMP) score was calculated using the summated HR zone method
7
:

For the INT players, after each game, an RPE score was recorded using the Borg CR-10 scale
22
and used to calculate sRPE
8
:

Unfortunately, RPE could not be collected from the WPL players due to restricted court-side access imposed by the competition regulations.
EML
Cut-off values used in the fixed and individualized zone methods and example zone thresholds used in the individualized zones for the WPL and INT groups.

aAbbreviations: INT, International; WPL, Women’s Premier League; m.s‐1, metres per second.
Statistical analysis
Statistical analyses were conducted using IBM SPSS Statistics (Version 28, Chicago, Illinois, USA) and a custom R script (RStudio, Version 2024.12.1, Posit, Joseph Allaire). The Shapiro-Wilk test revealed the time in speed zones data to violate parametric assumptions; therefore, for aim 1 a linear mixed model was applied to each speed zone, incorporating logarithmic or square root transformations based on model fit. In the models, the relative time spent in the two zonal methods were fixed factors, and participant was included as a random effect, accounting for multiple observations per individual, with two performance levels (INT and WPL) and three classification groups (Group A: 1 – 1.5; Group B: 2 – 3; Group C: 3.5 – 5.0). Using the fitted model, differences between the two zonal methods were analysed using a Type II Wald Chi-Square ANOVA with post hoc pairwise comparisons. These were interpreted using a Hedge’s g score (trivial, g < 0.20; small, g = 0.20 < 0.50; medium, g = 0.50 < 0.80; large, g ≥ 0.80). 25
For aim 2, a linear mixed model was fitted to examine the relationship between EML and IML measures, with participant as a random effect and across two performance levels (INT and WPL), while classification group was not included as a level. Pearson correlations were conducted, and where transformed data that violated parametric assumptions, Spearman rho correlations were additionally used. The correlations were interpreted using correlation coefficient magnitudes 26 (negligible, r < 0.1; weak, r = 0.10 – 0.39; moderate, r = 0.40 – 0.69; strong, r = 0.70 – 0.89; very strong, 0.90 – 1.00). Statistical significance was set at p ≤ 0.05 for all analyses and Bonferroni corrections were used for multiple comparisons and correlations. All data are presented as estimated marginal means ± standard error.
Results
Estimated marginal means ± SE peak speed profiles for the whole cohort, subgroups and classification groups.
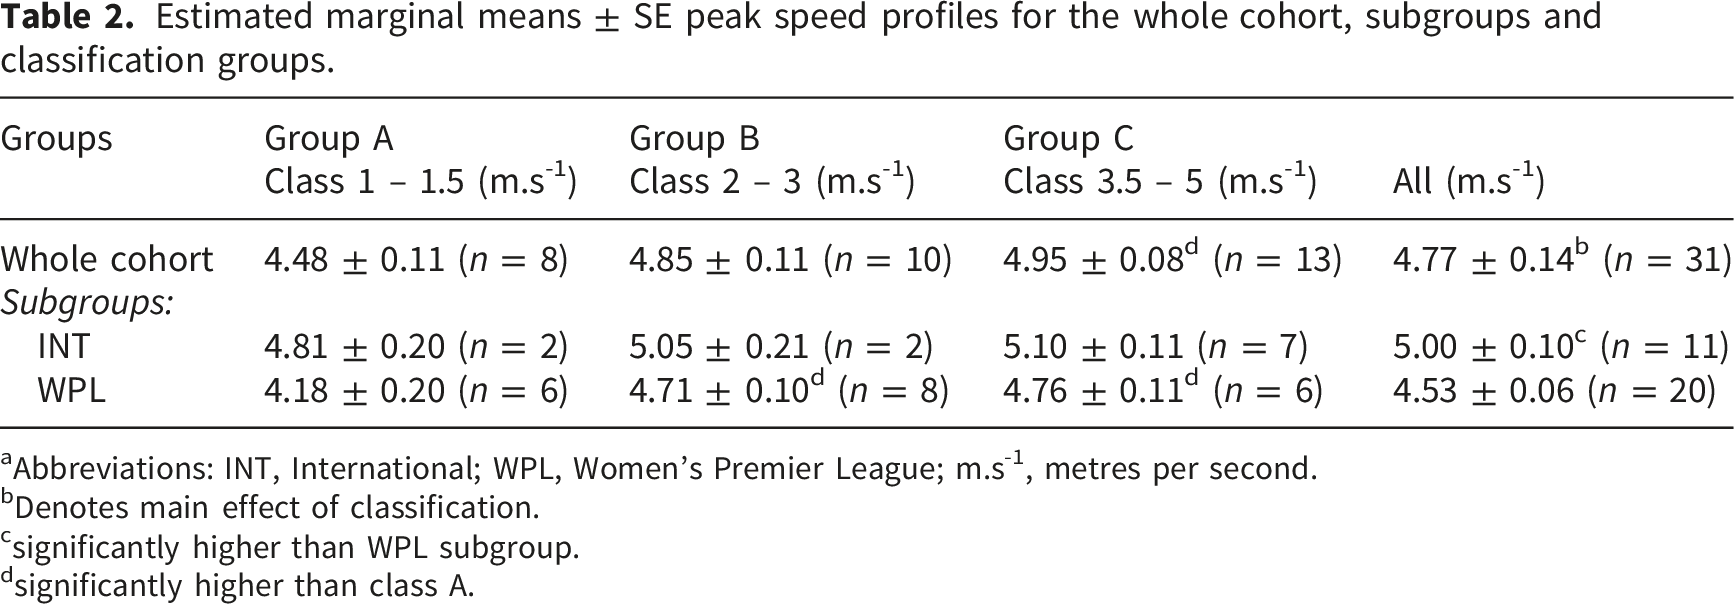
aAbbreviations: INT, International; WPL, Women’s Premier League; m.s-1, metres per second.
bDenotes main effect of classification.
csignificantly higher than WPL subgroup.
dsignificantly higher than class A.
A significant main effect for classification was observed (F (2) = 9.63, p < 0.001), with post-hoc tests revealing greater peak speeds in group C (+0.47 m.s-1, p = 0.007, ES = 1.5) compared to group A. Peak speeds were also higher for the INT subgroup compared to the WPL subgroup (5.00 vs. 4.53 m.s-1, p < 0.001, ES = 1.5).
Comparison of zonal methods
A main effect for the zonal method was observed for Z3 - 6 (p < 0.05, Figure 1), with more time recorded using the fixed method compared to individualized for Z4 to Z6 (+ 0.3 - 5.9pp., p < 0.0001, ES = 0.7 – 2.3), whereas the opposite was true for Z3 (- 10 pp., p < 0.0001, ES = 1.8). Estimated marginal means of percentage time spent in speed zones 2 – 6 across INT and WPL groups. Error bars indicate SE. Symbols denote statistical significance: # main effect of method (fixed vs. individualized), † main effect of group, * main effect of classification (p < 0.05 for all). Letters indicate posthoc differences between methods within groups: a for INT, b for WPL. *Abbreviations: Z, Speed zone; INT, International matches; WPL, Women’s Premier League matches.
The WPL group spent greater time in Z4 compared to the INT group (+3.8 pp., p = 0.0001, ES = 1.6). The fixed method resulted in greater time spent in Z2 at the WPL level (+3.4 pp., p < 0.0001, ES = 0.8) and Z4 at the INT level (+4 pp., p < 0.0001, ES = 1.3). This was also the case for Z5 and Z6, however larger differences were observed between methods at the INT level (+1.1 – 6.7 pp., p < 0.0001, ES = 1.7 – 2.3) compared to the WPL level (+ 0.3 – 5 pp., p ≤ 0.0002, ES = 0.7 – 1.4).
The effect of classification
A main effect of classification was found for Z3, Z5 and Z6 (p ≤ 0.046), with post hoc tests showing that group C spent more time in Z5 and Z6 (+0.2 - 1.4 pp., p ≤ 0.0018, ES = 0.9 – 3.3). Group B recorded more time in Z6 (+0.1 pp., p = 0.026, ES = 2.7) compared to group A (Figure 2). Estimated marginal means of percentage time spent in speed zones 2 – 6 across three classification groups (A, B and C). Error bars indicate SE. * Symbols indicates fixed speed zone method significantly higher than the individualized method (p < 0.05). *Abbreviations: Z, Speed zone; A, Classification group A (1 – 1.5); B, Classification group B (2 – 3); and C, Classification group C (3.5 – 5).
The fixed method resulted in more time spent in Z5 compared to the individualized methods; however, the differences were larger in group C (+16.4 pp., p < 0.0001, ES = 3.3) compared to group A (+6.9 pp., p < 0.0001, ES = 2.6) and B (+10.9 pp., p < 0.0001, ES = 2.4). Group C also had larger differences between methods (+ 1.1 pp., p < 0.0001, ES = 2.3) for Z6 compared to group B (+ 0.8 pp., p < 0.0001, ES = 1.5).
EML and IML
Correlation coefficients (95% confidence intervals) between EML measures and IML measures at the international and WPL game level.

Abbreviations: EML, External match load; IML, internal match load; HIA, high intensity activations; Z, Speed zone; INT, International; WPL, Women’s Premier League; eTRIMP, Edward’s training impulse; sRPE, sessional RPE.
aSignificant correlation at p < 0.05 level.
At the INT level, distance covered was also moderately correlated with time spent in Z3 for both methods (r = 0.46 – 0.53, p < 0.0001), and weak correlations were observed between HIA and time spent in individualized Z3 (r = 0.33, p = 0.02) and fixed Z6 (r = 0.30, p = 0.04). There were weak to moderate correlations between time spent in Z3 and the eTRIMP method for both the fixed (r = 0.34, p = 0.020) and individualized methods (r = 0.41, p = 0.002) at the INT level. No additional statistically significant correlations were identified.
Discussion
This study examined differences in EML quantification from two commonly used speed zone methods (individualized vs. fixed) in women’s WB. The aim was not to determine which is more accurate, since no gold standard exists, but to quantify the discrepancies between methods across two levels of competition (INT vs. WPL). The main findings were: (i) the fixed method classified more time recorded in higher-intensity zones (Z4, moderate speed; Z5, high speed; and Z6, very high-speed wheelchair propulsion) and less in Z3 (low speed) than the individualized method; (ii) these differences were more pronounced in INT players, who also achieved higher peak speeds; and (iii) classification level influenced EML, with higher-functioning athletes showing the greatest divergence between methods.
The fixed method led to a greater proportion of time spent in moderate (1–3% time), high (5-7% time) and very high-speed (0.2-0.7% time) zones compared to the individualized method. These differences were more pronounced at the higher level of competition (INT), likely reflected by the higher peak speeds observed in these athletes. Previous research has highlighted a difference of 0.43s in a 12m sprint between national and international WB athletes. 27 These higher peak speed capacities lead to substantially higher individualized speed thresholds in INT compared to WPL athletes, as illustrated in Table 1, thereby increasing the gap between the two zonal approaches. These findings suggest that fixed thresholds may insufficiently account for functional variability across competition levels.
The player’s functional capacity, which is associated with their level of impairment and therefore their classification group, was evidenced by the varying peak speeds between the groups. Our results showed that the lowest classification group (A), who typically have reduced trunk function limiting their propulsion speed,1,27 spent less time in high intensity zones compared to groups B and C, regardless of the zonal method used. This pattern supports the idea that the zones may be less closely aligned for individuals with greater physical capabilities. Similar trends have been observed previously, with one study noting that ‘higher-class’ players (3.0 and above) spent slightly more time in the highest intensity zone compared to the overall sample. 11 The differences in peak speed capacity across classification groups are well established in WB, with particularly big differences between group A and group C athletes,16,28,29 as observed in this study. The greatest discrepancies between methods observed in group C (8.4% time, Z5-Z6) compared to groups B and A further support the idea that the zones may be less closely aligned for individuals with greater functional capacity, and therefore impact EML quantification.
The individualized zones applied in this study were adopted from thresholds originally developed in running sports17–19 and utilised in wheelchair rugby, 15 which are recognized as arbitrary and not validated for WB. This likely explains the higher thresholds for high intensity zones in the individualized method, leading to less time being classified at very high speeds. These findings contrast with non-disabled team sports research, where fixed zonal methods typically underestimate EL.30–32 While we acknowledge this limitation, these zones were applied as a practical approach to reflect relative intensity based on individual peak speeds. Given the absence of established methods for wheelchair sports, this study provides an important first step in exploring their application within this context. Future work should aim to develop sport-and-impairment specific zones to better capture the demands of WB.
In addressing the relationship between EML and IML measures, moderate to strong positive relationships were found between distance covered and HIA with the eTRIMP measure of IML at both competition levels, consistent with prior wheelchair rugby research. 15 Additionally, moderate to strong correlations with sRPE were observed in INT players, which contrasts with previous research reporting weaker associations. 15 While researchers have recommended combining RPE and HR-based measures to quantify IML in wheelchair court sports, 9 due to logistical constraints sRPE data were not collected for WPL participants, limiting our ability to compare these relationships fully across competition levels. There are well-established limitations to the use of HR monitoring in intermittent sports, often underestimating the physiological load of short-duration high-intensity actions. 10 In individuals with an SCI, blunted autonomic responses 9 can reduce the ability to reach higher HR zones and lead to a greater proportion of time classified within moderate zones. These considerations might influence the strength of relationships observed between IML and EML measures across different impairment groups, presenting implications not only for the validation of speed zone methods but also for longitudinal monitoring purposes.
The predominance of time spent in the moderate intensity zone (Z3) across both methods explains much of the observed relationships with IML. This pattern reflects the intermittent nature of WB, where high intensity efforts are interspersed with periods of lower intensity propulsion and coasting, the latter of which complicates the interpretation of speed-based zones. 27 Consequently, IML measures such as eTRIMP and sRPE are more strongly associated with time spent in Z3, distance covered and HIA, as they represent global measures of load and capture the demands of the entire session rather than the most intense periods, unlike the time spent in high intensity zones. Whilst these measures of EML are essential for practitioners seeking to understand the load demands of WB, it remains vital to consider the distribution of intensity within this total load, as this may significantly influence the athlete’s perceived effort as well as their subsequent adaptations or fatigue responses. The relatively small amount of time recorded in the highest intensity zones using individualized thresholds in this study suggests that these zones may need adjustment, such as combining the upper zones or lowering the lower limits to 70-80% of peak speed to better capture meaningful high intensity efforts. 15
Importantly, our analysis did not determine which zonal method has a stronger relationship with IML, and the generally weak associations observed indicate neither method clearly outperforms the other in representing internal load, as previously observed in soccer players. 30 Future studies employing within-individual correlations may provide more robust insight into these relationships. 15
Limitations
Due to logistical constraints, not all participants completed peak speed sprint testing, resulting in some peak speeds being derived from gameplay, training or sprint trials. This may have introduced variability in individualized zone thresholds via the underestimation of true peak speed and increased the likelihood of WPL athletes (n=8) recording time in the highest zones. Therefore, caution is warranted when interpreting differences in time spent in the highest intensity zones across competition levels and practitioners should aim to adopt a standardised method for determining peak speed in future analyses. There is, however, value in confirming whether an athlete’s peak speed measured during linear sprint testing truly represents their maximal capacity, or if higher speeds are achieved during training or competition.
Maximal HR was not collected through laboratory testing, potentially affecting the accuracy of eTRIMP calculations. Additionally, sRPE was not collected from the WPL subgroup, limiting comparisons between IML between competitions. Our sample was limited to a single nation’s female squad, with some classification groups underrepresented, which may limit generalizability. Finally, given the narrower variance in peak speeds among male athletes due to higher professionalisation, fixed zones may be more relevant in that population, but this requires empirical verification.
Practical recommendations and future directions
Practitioners should be cautious when applying speed zones derived from running sports 17 to WB athletes due to the fundamental differences in propulsion kinematics and the impact of impairment. Both fixed speed and individualized zonal methods have limitations; fixed zones do not account for functional variability between athletes, while individualized zones rely on able-bodied running.17,18 Assessing additional physiological markers such as blood lactate or oxygen consumption during gameplay and laboratory testing could allow practitioners to anchor these speed zones to established physiological thresholds, including ventilatory and lactate thresholds. This would offer a more objective basis for establishing individualized zones, rather than relying on arbitrary percentages of peak speed adapted from running sports.
Until more accurate, validated zones are developed, we recommend the consistent use of a single method with an awareness of these limitations for monitoring EML in WB. It would be valuable for practitioners and researchers to retrospectively analyse existing IMU datasets from WB and apply these individualized zones, particularly when comparing intensity distributions across classification groups or playing levels. Based on the minimal time observed in Z6 in this study, we recommend combining Z5 and Z6 to represent very high intensity propulsion.
Given these limitations, future studies should focus on developing and validating wheelchair specific, impairment informed speed zones tailored to women’s WB; examining within individual EML–IML relationships longitudinally; and include male and mixed nationality cohorts to improve generalizability.
Conclusion
Fixed and individualized speed zone methods produce meaningfully different EML profiles, especially in highspeed activities (Z4-Z6). The magnitude of these differences were greater at higher competition and classification levels. Neither method demonstrated clear superiority in relation to internal measures of match load (eTRIMP, sRPE), underscoring the need to develop and validate wheelchair-specific zonal thresholds that account for the diverse functional abilities of athletes.
Footnotes
Acknowledgements
The authors would like to acknowledge all the athletes and support staff within British Wheelchair Basketball and the teams from the BWB Women’s Premier League for their participation in this research.
Ethical considerations
Ethical approval was received from the Human Participants sub-committee at Loughborough University (2022-8445-10161). All procedures were conducted in accordance with the declaration of Helsinki.
Consent for publication
All participants provided written informed consent prior to data collection.
Author contributions
Conceptualisation: PB, RB, TR, VGT; Methodology: PB, RB, TR, RvdS, VGT; Data collection: PB, TR; Data analysis: PB, RB, TR, RvdS; Writing (original draft): PB; Writing (review & editing): PB, RB, TR, RvdS, VGT.
Funding
The author(s) disclosed receipt of the following financial support for the research, authorship, and/or publication of this article: This research was joint funded by the Peter Harrison Centre for Disability Sport and British Wheelchair Basketball.
Declaration of conflicting interests
The authors declared no potential conflicts of interest with respect to the research, authorship, and/or publication of this article.
Data Availability Statement
Anonymized data are available from the corresponding author upon reasonable request.