
Abstract
Background
Electrical stimulation of the spinal cord may improve rewiring of the affected pathways. Immediate modulation of stimulation parameters, and its effects of it on kinematics and electromyographic variables is unclear.
Methods
This study piloted the safety and feasibility of the Reynolds Innovative Spinal Electrical Stimulation (RISES) technology with a focus on its novel closed-loop setting. This personalized, task-specific non-invasive stimulation system enables real-time stimulation parameter modulation and supports multi-data acquisition and storage. Four SCI participants underwent a clinical trial coupled with activity-based training. Primary safety outcome measures included adverse events (AEs) and skin integrity; secondary measures were vital signs, pain, and fatigue assessed at the pre, mid, and post-stimulation sessions. The trial included open-loop and closed-loop blocks of transcutaneous spinal cord stimulation (tSCS).
Results
Results showed no serious adverse events, with skin integrity unaffected. Vital signs and pain showed no significant differences across session timepoints. Fatigue levels differed significantly with post-session > mid-session > pre-session. Comparisons between open-loop and closed-loop blocks showed no significant differences in setup time, vital signs, pain, or fatigue. Average stimulation duration per task was significantly longer for open-loop (467.6 sec) than Closed-loop (410.8 sec).
Conclusions
RISES, demonstrated safety and feasibility. Further work will focus on clinical efficacy.
Keywords
Introduction
Disruption of communication within the nervous system caused by Spinal Cord Injury (SCI) results in the impairment of the neural circuitry. 1 Combining activity-based training with other techniques and technologies can enhance recovery by modulating impaired neural pathways. However, recent applications of electrical spinal cord stimulation have shown the potential for clinically relevant improvements in the neuromuscular recovery, even without intensive activity-based training.2–8 Efficacy for spinal stimulation for people with SCI has not been demonstrated in rigorous randomized trials. Anecdotal reports of stimulation with spinal cord injury show mixed results with some patients reporting benefits and others not. The small sample size and heterogeneity of these reports make it difficult to infer if there are particular characteristics in spinal cord injury that shows benefit.9–11
Electrical spinal cord stimulation includes invasive and non-invasive methods.8,12,13 Transcutaneous spinal cord stimulation (tSCS) is a non-invasive approach that may to enhance recovery. In contrast to invasive methods like implanted epidural stimulation, which have demonstrated significant functional gains in patient recovery,11–13 the exploration of non-invasive approaches to achieve comparable results is warranted. Although the precise mechanisms of action for tSCS are still under investigation, it is hypothesized to engage dorsal afferents, triggering transsynaptic activation of motor nerve roots. 14 Recent studies, supported by two systematic reviews, have demonstrated that tSCS increases motor activation in upper and lower extremities,14,15 benefiting motor functions, such as grip.16,17 Such motor functions are crucial for people living with SCI to improve independence and quality of life. 18
Recent advancements in tSCS technology have shown promising results, such as the ability to deliver high-intensity stimulation without causing discomfort. 19 However, there is an ongoing debate surrounding the comfort and effectiveness of kHz carrier frequencies in tSCS, particularly in relation to recent studies’ findings.20–24 The ongoing advancement of tSCS technology is crucial for refining stimulation parameters to achieve optimal real-time neuromodulation of the spinal cord. Moreover, the field currently lacks objective measurements for assessing the instantaneous and long-term effects of stimulation. Enhancing the above-mentioned technological aspects will allow for delving deeper into the clinical efficacy of tSCS and unlocking its true potential.
This safety and feasibility study introduces the Reynold Innovative Spinal Electrical Stimulation (RISES) system, which offers a novel tSCS technology by including a closed-loop stimulation setting. The system offers two stimulation modes: open-loop, with fixed parameters delivered at predetermined time intervals, and closed-loop, with parameters continuously updated in real-time based on the person’s movement execution. The innovation of the presented technology lies in its capabilities to modulate stimulation parameters in real-time and in a task-specific manner in its closed-loop setting. Moreover, the RISES system can perform real-time movement analysis and activity recognition owing to its multi-sensor data acquisition configuration. This feature unifies and synchronizes different data streams collected by multiple sensors, namely electromyography (EMG) and a wireless inertial measurement unit (IMU) sensor that serve as a wireless human motion capture system.
Although, the primary focus of our study is to evaluate the safety and feasibility of the RISES system, particularly its innovative closed-loop mode, we included analysis of both open-loop and closed-loop modes to demonstrate the feasibility of the closed-loop approach compared to the conventional open-loop method commonly used in the field. This study aimed to assess the safety and feasibility of deploying the developed technology in a clinical trial, incorporating tSCS in open and closed-loop modes during functional task practice (FTP) for rehabilitation.
Methods
The RISES system was developed at the Raphael Center for Neurorestoration at Thomas Jefferson University, in Philadelphia.
Participant description
Inclusion and Exclusion criteria.

Demographics and injury characteristics of participants.

ISNSCI: International Standards for Neurological Classification of Spinal Cord Injury; NLI: Neurological Level of Injury; ML: Motor Level of Injury; SL: Sensory Level of Injury; R: Right; L: Left.
Study design
The study had a non-randomized single group repeated measures design in which participants received 30 sessions of tSCS in conjunction with functional task practice (FTP) over 3 months. Each session was 2 hours long, which included RISES system setup, the FTP session with tSCS and a brief clinical assessment pre, mid and post tSCS application. Participants were assessed with a battery of clinical outcome measures at baseline, mid-point, and endpoint of the study. The study consisted of two intervention blocks in series for each participant: the first 15 sessions used the RISES system in open-loop stimulation mode, and the remaining 15 sessions used its closed-loop stimulation mode.
Functional task practice
For each FTP session, maximum of 6 tasks were selected based on participant’s Canadian Occupational Performance Measure 26 (COPM). The participant received tSCS delivered by the Xcite system (Restorative Therapies Inc.) to the spinal column during the FTP tasks. Tasks practiced involved the use of upper extremities, lower extremities, and/or trunk, as well as bilateral and unilateral gross and fine motor movements; these are presented in Supplemental Table 1. Assistance to perform tasks by interventionists was limited to active assistance for up to 50% of effort, otherwise known as a moderate level of physical assistance. In our study, the up to 50% effort level was not measured by a specific scale. It was determined based on the interventionists’ clinical judgment and experience. A typical rest break between tasks ranged between 30 seconds and 5 minutes as needed.
At the beginning of each session, wireless IMU (Xsens MTw Awinda)
27
and EMG (Delsys Trigno®)
28
sensors were placed on the participant’s body (Figure 1(a), (b), (d)). A schematic shows IMU sensor locations on the subject’s body (a), an IMU sensor on the left forearm (b), electrode placements with corresponding levels (c), and EMG sensor placement on muscles (Extensor Carpi Radialis, Flexor Carpi Radialis, Biceps, Triceps) used for muscle activity analysis (d).
Outcome measures and data collection
To ensure safety, interventionists routinely examined the skin for any signs of irritation or injury, including blanchable erythema, by visual inspection and occasional palpation. If there was concern of impaired skin integrity, the study team completed documentation of concern and was reported as an adverse event. The Principal Investigators (PIs) were evaluating its relevance to the study. For a given study session, spinal cord stimulation was actively applied for approximately 45 minutes. It should be noted, the net 45 minutes was not continuous either due to the mode of the stimulation (closed-loop) or the rest breaks given to the participant. Vital signs (Blood pressure, Heart Rate, Oxygen Saturation) were recorded pre, mid, and post-stimulation for each intervention session. Pain and fatigue (scale 1-10) were assessed pre, mid, and post-stimulation for each intervention session for Participants two and 3 and at baseline, midpoint, and endpoint of the study for all participants. Participants also completed questionnaires to report on fatigue, sleep and quality of life (Supplemental Table 6). Primary safety measures included Adverse Events (AEs) and skin integrity; secondary measures were vital signs; pain and fatigue. Metrics used to compare Closed-loop and Open-loop blocks included setup time, calibration, total stimulation duration per task, and vital sign changes between pre, mid and post stimulation session.
Clinical outcome measures were implemented at the baseline, midpoint and endpoint assessment sessions by trained licensed therapists. The baseline assessment occurred prior to the open-loop block, midpoint occurred after the open-loop and before the closed-loop block, and endpoint occurred after the closed-loop block. These measures included the International Standards for Neurological Classification of Spinal Cord Injury (ISNCSCI), 29 the Capabilities of Upper Extremity Test (CUE-T),25,30 the Spinal Cord Independence Measure (SCIM), 31 the Modified Ashworth Scale (MAS), 32 a Numeric Pain Rating Scale (NPRS), 33 Pain Catastrophizing Scale, 34 PROMIS-Pain interference-SF 8A, 35 Quality of Life Index-Spinal Cord Injury Version III (QLI-SCI) 36 World Health Organization-Five Well-Being Index (WHO-5), 37 Pittsburgh Sleep Quality Index (PSQI), 38 Epworth Sleepiness Scale 39 and the Canadian Occupational Performance Measure (COPM). 40
During these assessment sessions the instantaneous effects of tSCS stimulation on muscle activity were investigated. These sessions included trials of two distinct electrical stimulation waveforms incorporated in the RISES system: Burst and No-Burst (Described in detail in section F, subsection RISES Stimulation Parameters and safety considerations). Participants performed structured tasks, namely bilateral Lifting Pin Upward (LPU) and Rolling Pin Forward (RPF), to evaluate the instantaneous changes in muscle activities elicited by each waveform. During the FTP sessions, we exclusively utilized the Burst waveform for stimulation. This choice was informed by prior research reporting advantages of high-frequency stimulation, such as improved patient stimulation tolerance and comparable increase in function compared to No-Burst.8,41 However, ongoing debates persist regarding kilohertz (kHz) carrier frequencies reports in the literature in terms of providing higher comfort levels.20,21,24 Our main justification for its usage is based on the reported therapeutic effects and the widespread adoption of this approach in current practice.
Electrode placement
Throughout the study, tSCS was delivered via 12 rectangular shaped electrodes (3″x4″, PALS®, Axelgaard, Fallbrook, CA, USA) that were positioned in pairs bilaterally along the dorsal column. Electrodes were arranged in pairs, with one on either side of spinal levels C7, T2, T7, T12, L4 and S2, thus forming 6 (active/return) electrode pairs that served as “stimulation channels” (Figure 1(c)). To ensure a reliable electrode adhesion and impendence when applying tSCS during activities, the skin was cleansed with hypoallergenic soap and water wipes to remove debris and oils. As an additional measure, participants were advised to shave their skin before attending sessions.
Technology development
Hardware and software components
RISES software suite components.

RISES software operations
The RISES software offers an intuitive GUI for rehabilitation therapists and technicians to customize and apply electrical stimulation. The RISES software architecture is introduced in Figure 2, where the main components and their interfaces are presented. The RISES software application has been designed to operate in two primary modes: (a) open-loop, in which a participant-specific stimulation is continuously delivered for a pre-chosen amount of time, and (b) closed-loop, in which the stimulation parameters (amplitude, frequency, channel, pulse-width (for No-Burst Stimulation)) can be controlled and adjusted in real-time using activity recognition derived from the participant-worn sensors. In both modes, the stimulation labels and data are synchronized with the target therapy activities. The hardware and software architecture of RISES. The architecture incorporates a Restorative Therapies (RTI) Xcite2 Functional Electrical Stimulator (FES) device, along with two data streams from the Delsys Trigno Wireless EMG system and the Xsens MTw Awinda wireless IMU system. A PC laptop is used to run all the necessary software to acquire and manage sensor data. The RISES software suite, customized to support open-loop and closed-loop control, integrates the various sensor data streams and the Xcite2 control wireless libraries.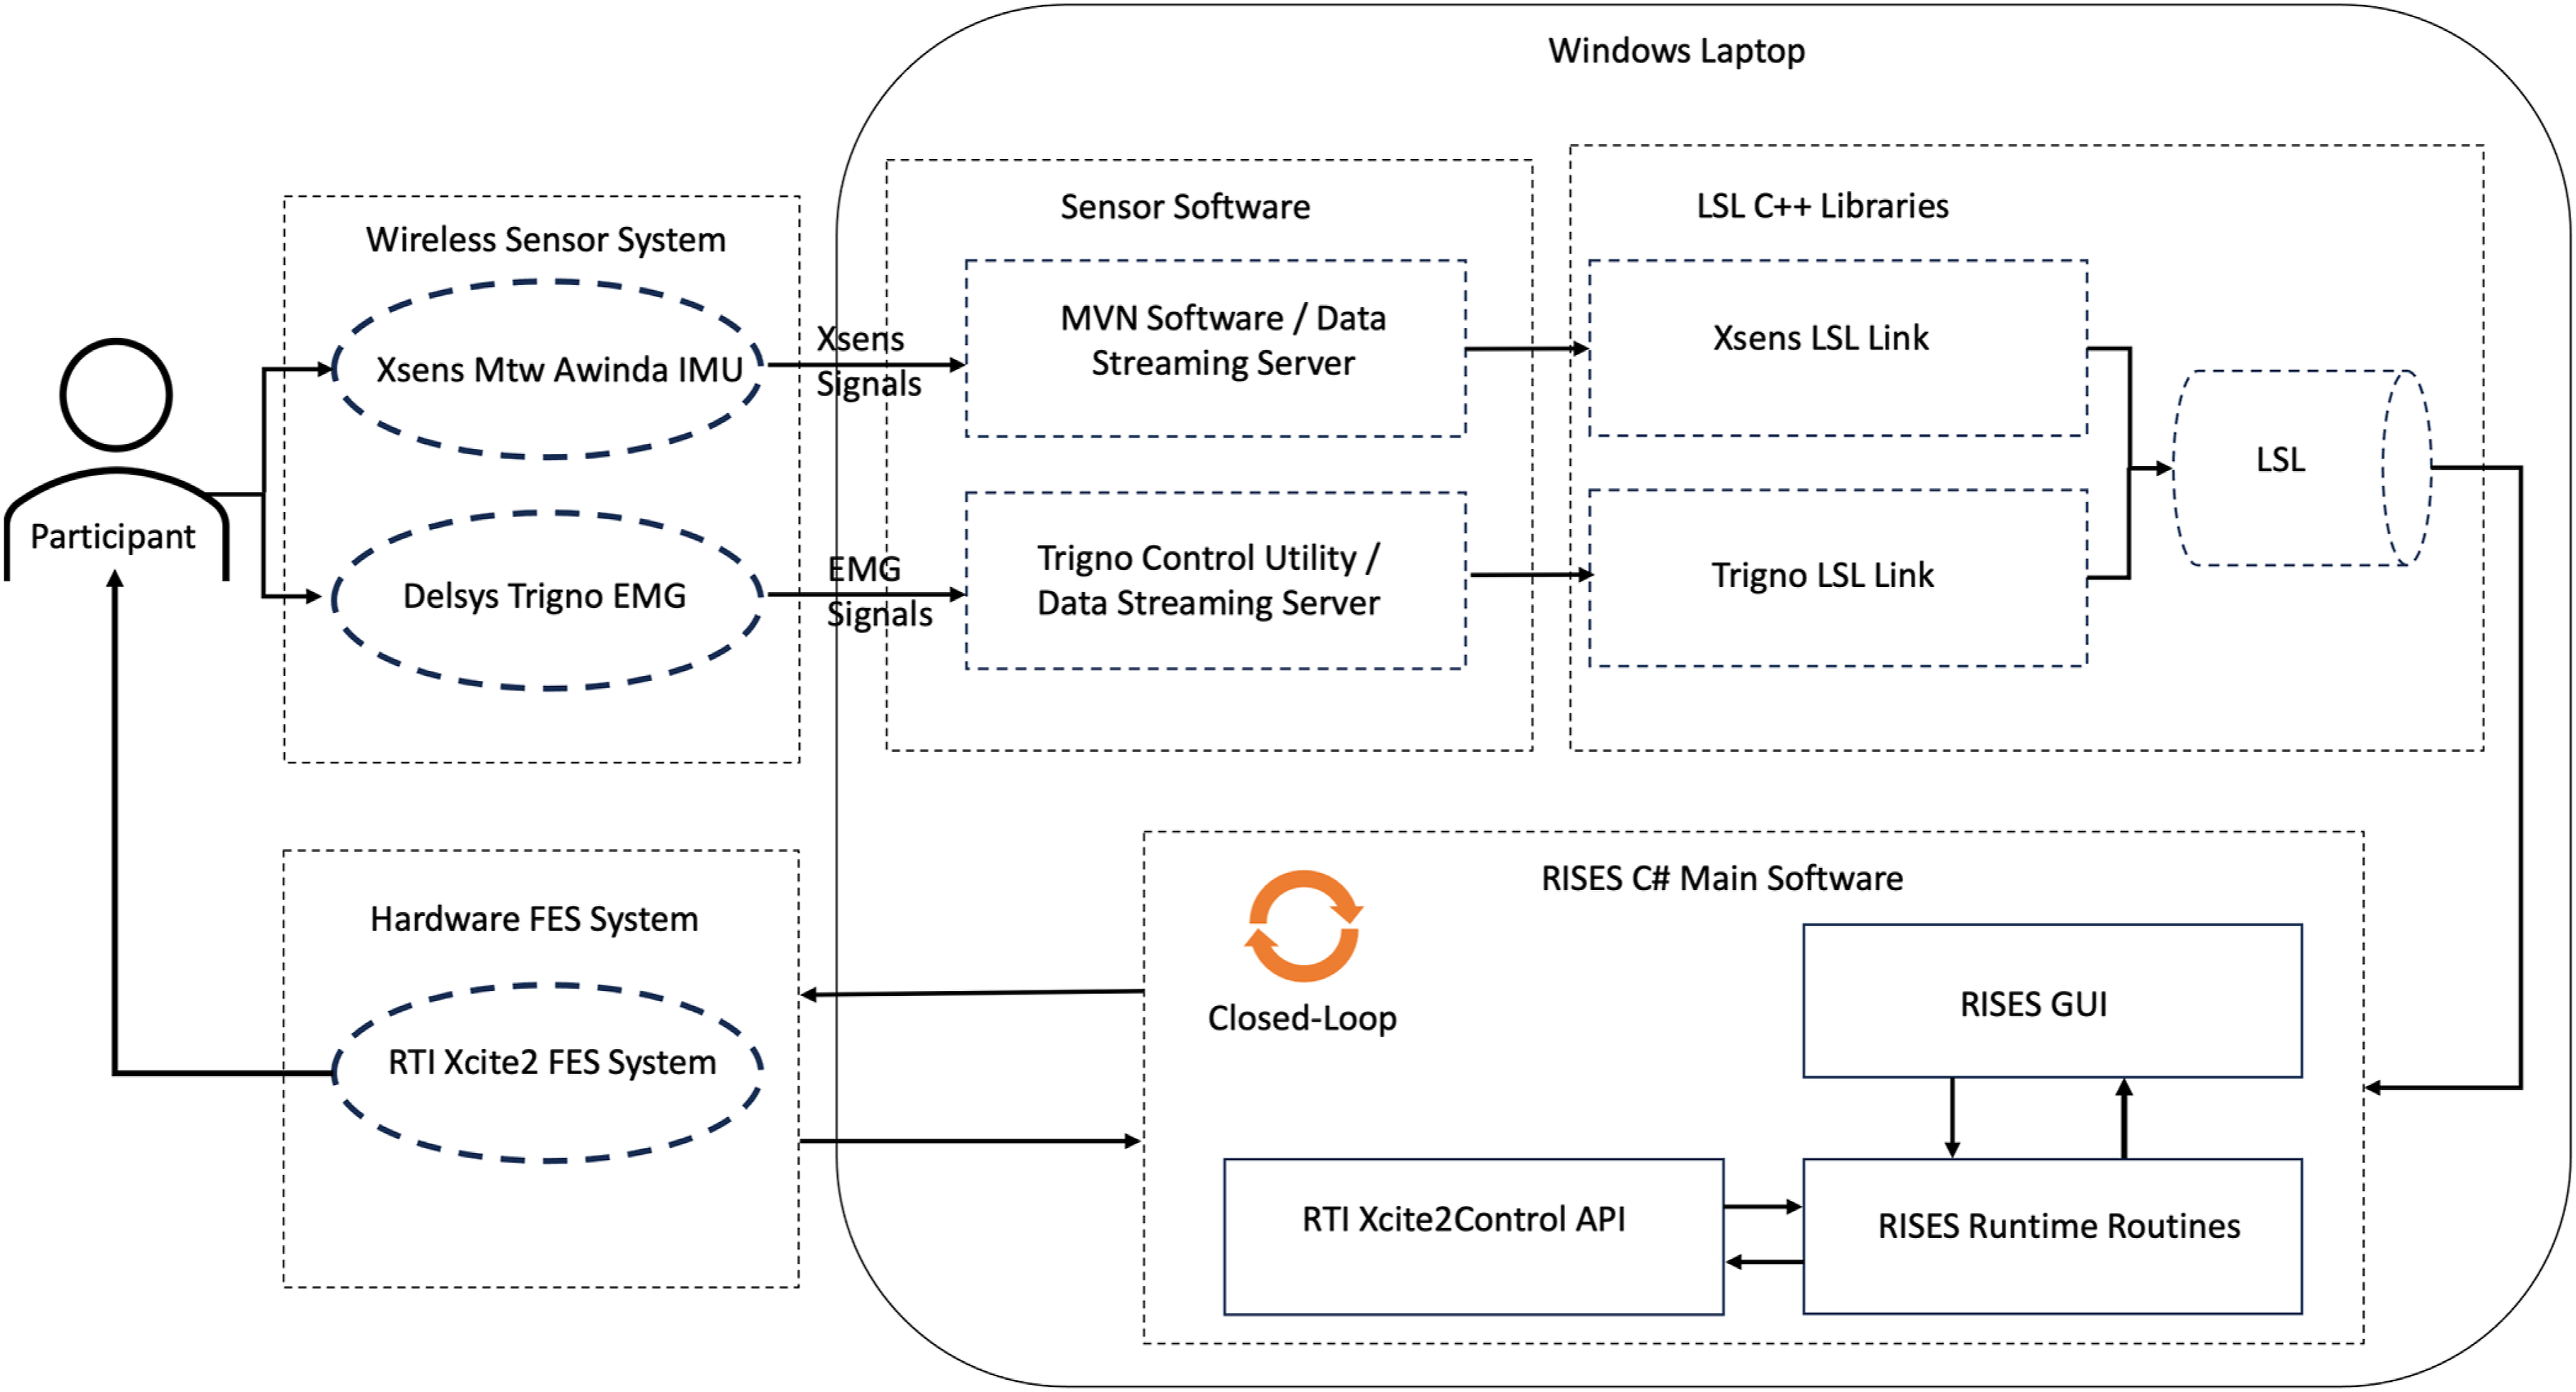
Open-loop mode: This mode offers two settings: Manual and Automatic. In the Manual setting, stimulation parameters are manually entered, allowing for pauses for adjustments. In Automation, stimulation parameters are stored on a file and are initiated sequentially based on pre-set time intervals, with no need to pause to adjust parameters. The stimulation delivered during open-loop mode is not affected or changed based on activity.
b) Closed-loop mode: The primary innovation of RISES software, this method is capable of delivering and modulating stimulation in a closed-loop manner, meaning that the software can adjust stimulation parameters in real-time based on information derived from wireless sensors. This enables the software to provide stimulation that is optimized for and in sync with activities performed by the participants. The Xsens sensors provide accurate body segment positions, velocity, acceleration, and gyroscope readings (refer to Xsens for thorough list of possible variables 27 ). With accurate calibration, the body model can also provide precise estimations of joint angles. The Delsys EMG sensors provide insights into muscle activity. And data from one or more of these sensors can be used to trigger stimulation based on algorithms that we provide the system.
The RISES system closed-loop mode offers the sophisticated capability of utilizing data from selected sensors or a combination thereof to precisely modulate stimulation parameters. These parameters include current amplitude, timing, and the specific channel or channels responsible for delivering stimulation. Consequently, depending on the task at hand, we can designate which stimulation channel (corresponding to a specific spinal level) or combination of channels will receive the stimulation, and we can adjust the amplitude and frequency accordingly. This dynamic adaptability enables customization of the stimulation protocol to suit the participant’s needs and maximize therapeutic efficacy.
The data streams from EMG and IMU sensors serve a dual purpose: not only do they facilitate real-time parameter adjustments in closed-loop mode, but they also offer immediate insights into task performance. Furthermore, these data can be stored for offline analysis, enabling the identification of meaningful patterns that can be used to derive metrics for objective measurements of intervention progression. This multifaceted utilization of data ensures both dynamic adaptability during sessions and comprehensive analysis post-session, contributing to a thorough understanding of therapy outcomes and informing future interventions.
The closed-loop mode can operate in one of two control methods: (i) Discrete or (ii) Continuous. During Discrete control, presented in (1), the system operator can select specific sensor data or combination of sensor data variables to capture the desired task and trigger a fixed stimulation paradigm. When the variables pass above a set threshold, set stimulation parameters are deployed. Namely, this control algorithm is set up in such a way that: -- t is time expressed in software update, every 50 ms. -- Stimulation(𝑡): ON/OFF is the command sent to trigger the Xcite device at each software time update (every 50 ms). -- Sens(𝑡) is the selected sensor input at each time update. -- Threshold is an operator selected threshold chosen to turn ON the stimulation when activity is detected and turn it OFF when rest is detected
During Continuous control, detailed in (2), the system operator selects the specific sensor data or combination of sensor data variables to capture the desired task and trigger stimulation that can be continuously modulated (in real-time) using variations in the sensor data. As an example, above a certain threshold, the current amplitude can be modulated in a ramp-like manner based on the parameters of the ramp or different stages of recognized activity. -- t is time expressed in software update, every 50 ms. -- A(t) is the command sent to the stimulator at each time step which represents the stimulation current value, ranging between clinician selected limits. -- 𝐴0 represents a subperception current amplitude, as low as 1 mA. -- Sens(t) is the selected sensor input at each time update. -- S𝑒𝑛𝑠𝐵a𝑠𝑒𝑙𝑖𝑛𝑒M𝑒a𝑛 is the mean of the selected sensor input data corresponding to resting state. -- S𝑒𝑛𝑠𝐵a𝑠𝑒𝑙𝑖𝑛𝑒S𝑇D is the standard deviation of the selected sensor input data corresponding to resting state -- Mu𝑙𝑡 is an effect multiplier that can be used to control the stimulation amplitudes as a factor of the absolute values of sensor data variations over baseline activity.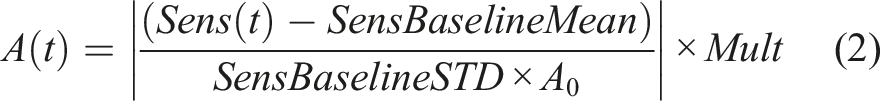
Figure 3 illustrates a basic real-time stimulation control algorithm (Closed-loop mode, discrete control) implemented during an upper-extremity gross arm movement task, specifically tossing a ball. Various variables can be utilized to discern the onset and offset of activity. In this instance, we explored the capabilities of upper extremity IMU sensors. Right panel (F) shows IMU sensor outputs for three different sensors: Upper Arm (UA), Forearm (FA), and Hand (H). Total Acceleration (T-Acc) and Total Gyroscope (T-Gyro) were computed. Hand’s T-Gyro, with the highest activity-to-rest ratio, was ideal for discrimination of different events of this task (activity vs rest). Right panel (G) shows real-time closed-loop software with T-Gyro feedback. Left panel (A, B, C) presents hand’s 3D angular velocity (x, y, z), while D depicts Hand T-Gyro’s Euclidean norm. E, represents modulation of stimulation output, detected, and controlled by RISES system in real-time using a threshold (e.g., 0.8°/sec for this task). Example of a real-time stimulation control algorithm while the participant was performing a ball tossing task. Right panel F displays the outputs of three IMU sensors: Upper Arm (UA), Forearm (FA), and Hand (H). The Euclidean norm of acceleration and angular velocity vectors were computed to express Total Acceleration (T-Acc), and Total Gyroscope (T-Gyro) respectively. The T-Gyro of hand exhibits the highest activity-to-rest ratio, indicating its superior detection capability for this task. Right panel G presents the software display in closed-loop setting with T-Gyro feedback in real-time. The left panel ((a), (b), and (c)) depicts the 3D angular velocity vector of the hand in x, y, and z directions respectively. Left panel D represents the Euclidean norm of angular velocity (Hand T-Gyro), and E represents the stimulation command output, which was successfully detected and modulated in real-time by the RISES algorithm.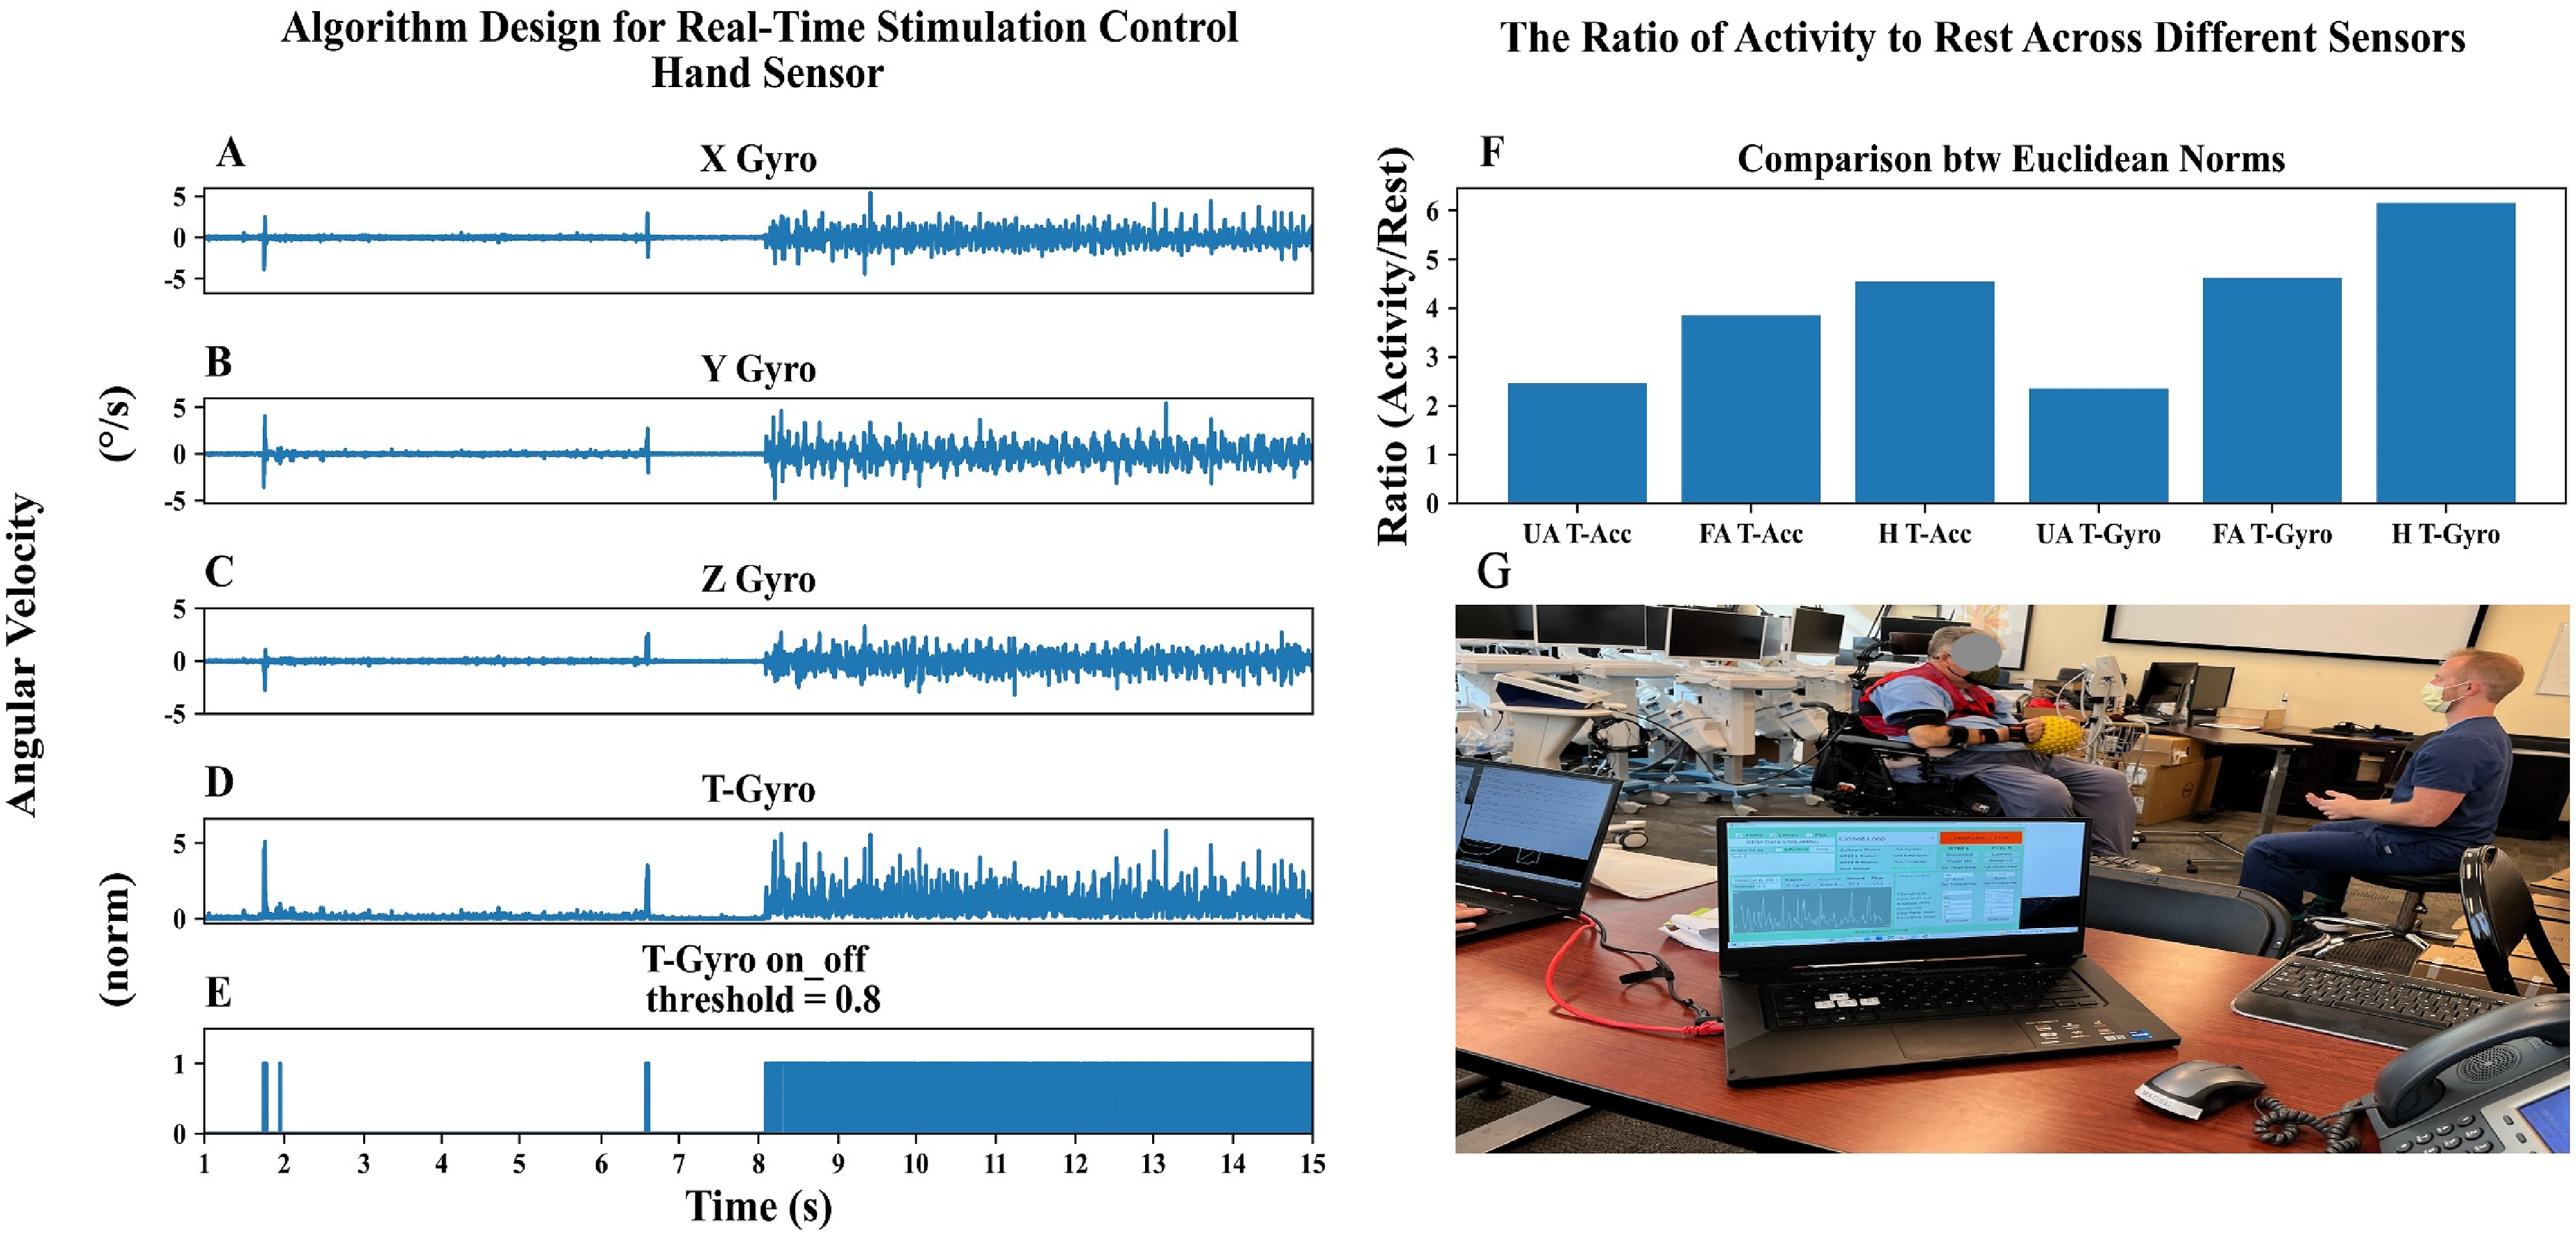
While the long-term goal of RISES system is to develop a completely automated system that can assist individuals living with SCI, the system is currently in its initial stage of technology development, being used in a controlled environment (under the research team’s supervision). To further enhance oversight in this study, we opted for a manual setup and carefully selected trigger sensors tailored to each specific task.
RISES stimulation parameters and safety considerations
The RISES system provides a range of parameters, encompassing two electrical stimulation waveform types: low-frequency (No-Burst) and high-frequency (Burst). The system’s ability to deliver both types of stimulation is crucial for therapeutic purposes, considering ongoing debates in the literature regarding their clinical efficacy.20,21,24,41
The RISES system Burst stimulation uses 10 sequential biphasic pulses consisting of 50 µs negative and positive phases with 50 µs intervals between them, resulting in a 2 ms pulse train repeated at a predetermined frequency (set to 30 Hz in this study). The Burst stimulation’s pulse train frequency can vary from 10 to 49 Hz, and its carrier frequency is 5 KHz. In Figure 4, the left top panel depicts one Burst stimulation, consisting of 10 sequential biphasic pulses. The top right panel depicts a train of these Bursts with 30 Hz frequency. Comparison between simulation output and oscilloscope output. Bench testing using equivalent electrical circuits and oscilloscope measurements was carried out to verify and validate the new stimulation paradigm (Burst waveform type) and ensure safety The top panel depicts one Burst stimulation pulse train on the left, and sequences of pulse trains on the right. The bottom panel displays the output of the oscilloscope during the Burst pulses, confirming the similarity between two signals to ensure safety of the Burst stimulation type and the RISES software operates as intended.
The RISES system No-Burst stimulation delivers alternating monophasic square current pulses. Each pulse time duration (pulse-width) can vary between 50 µs and 1000 µs. In this study, No-Burst stimulation deployed 250 µs pulse time duration with a repetition frequency of 30 Hz selected based on the therapeutic literature’s common range of 30-50 Hz. 15 Stimulation current ranges from 1 mA to 120 mA for both Burst and No-Burst paradigms. Refer to Supplemental Table 3 for maximum and selected values.
The RISES system utilizes the FDA-cleared Xcite system for stimulation delivery. The system provides No-Burst stimulation options as part of its clinical device. To introduce Burst stimulation, we collaborated with device’s manufacturer, Restorative Therapies, Inc. (RTI) to create custom firmware for the RT60 stimulators within Xcite. Bench testing using equivalent electrical circuits and oscilloscope measurements was carried out to verify and validate the new stimulation paradigm and ensure safety. Oscilloscope traces of such tests are shown in Figure 4. It is important to emphasize that XCite device and its inherent safety controls have not been modified in any way. The RISES software interfaces with the Xcite clinical hardware using a proprietary Bluetooth communication protocol.
To ensure the safety and long-term viability of spinal cord stimulation, the stimulation power density was carefully monitored at runtime. Excessive power density can lead to hazardous current densities that can result in tissue damage, local heating, and electrode corrosion. We computed the maximum power density by using the smallest available electrode size (5.08 cm × 5.08 cm, PALS®, Axelgaard, Fallbrook, CA, USA), which provided highest impedance, combined with the maximum possible pulse amplitude, frequency, and duration, and ensured that power density remained below the FDA recommended maximum limit of 0.25 W/cm2. Equations (3) and (4) are the ones we used for computing power density for No-Burst stimulation. Where Irms stands for the Root-Mean-Square (RMS) of the current, D is the duration of each phase (pulse width), -A and +A are the max current amplitude of the pulses, T is the time duration of each signal period, which can be derived from T = 1/f and f is the frequency, S is electrode contact surface, and Z is the impedance between two electrode.

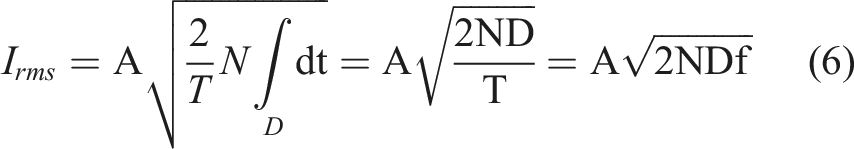
Equations (5)–(7) describe the procedure for computation of power density for Burst Stimulation where N represents the number of positive and negative pulses (N = 10 in this system).

To ensure safety, power density was measured for each participant, considering that this depends on electrode placement and skin contact changes, we measured voltage and calculated impedance at the beginning of each assessment session. As an additional safety measure, the RISES system features real-time current control, halting stimulation if deviations surpassing 5 mA occur. By design, the maximum power density permitted by the system is 0.084 W/cm2 for both Burst and No-Burst stimulation, which is below the previously mentioned FDA recommended limit. More data regarding these calculations are presented in Supplemental Table 3.
Data processing
Data in the text are presented as mean ± Standard Deviation (SD) for all comparisons. Data was checked for normality violations using Shapiro-Wilk test. Post-hoc analysis was performed using Tukey’s Honestly Significant Difference (HSD) test to explore significant effect at p < .05 across all analysis.
Analysis of safety and feasibility
The incidence of adverse events and skin integrity data were calculated as the ratio of total number of events over the total responses. To evaluate effects of stimulation modes on vital signs a mixed linear model (MLM) was performed to explore the effects of mode (open-loop, closed-loop), participants (1- 4), and time-point (pre, mid, post stimulation session) on variables of interest including diastolic and systolic blood pressure (mmHg), heartrate (bmp), and oxygen saturation (SpO2 %). Similar analysis was performed for the pain and fatigue for data gathered from participants 3, and 4. For Fatigue analysis we also included the number of tasks performed at each session as a covariate. An MLM analysis was also performed to explore the effects of mode and participant on duration of stimulation received per task. Analysis of stimulation time in Open-loop versus Closed-loop sessions was conducted by normalizing the total stimulation duration to the number of tasks performed for each session. Set-Up time was discussed for both closed-loop and open-loop intervention sessions in Results section.
General closed-loop features and algorithms used in this study
In the closed-loop setting, the system is set up to utilize one or more data inputs to implement subject-specific input/output control rules. For each of the placed IMU sensors (up to 17) these inputs include three-dimensional sensor angular velocity, acceleration, rotation data (Euler, Quaternion) and body segment linear kinematics (segment’s position, velocity and acceleration), and angular kinematics (angular velocity, angular acceleration). Furthermore, if the participant undergoes the calibration process, additional closed-loop variables such as body joint angles and center of mass are also available. In order to derive meaningful input/output control strategies, the RISES software is capable of performing several real-time mathematical transformations: such as, but not limited to differentiation, integration and input weighted combinations. In terms of output control, multiple rules can be implemented, such as specifying the behavior of certain stimulation channels in response to different rules. For instance, rule 1 commands channel 1 and channel 2 placed on cervical spinal levels deliver stimulation when the person attempts to straighten their arm at the elbow joint, but stimulation is not delivered when flexing the elbow joint. This can be possible by having a rule of when the derivative of elbow flexion becomes negative, then deliver stimulation and if positive, deliver zero intensity (stimulation off). Meanwhile, rule number 2 commands at the same time to deliver a continuous stimulation via channel 3 placed on trunk (T11-12) level to maintain a continuous posture throughout the task. This can be done by choosing acceleration of the upper extremity IMU sensor as the trigger with a small threshold level so it will be on whenever the participant attempts to perform a movement. As another example of using different variables for closed-loop mode, the root mean square (RMS) of an EMG sensor can be used as a trigger during an isometric wheelchair push-up activity.
Participant 1 received stimulation on Channels 1 and 2, while participants 2, 3, and 4 received stimulation on all channels. Current amplitudes ranged for participants 1 and 3 between 25 mA and 60 mA, and were task-dependent, while amplitudes remained constant for participants 2 and 4 (at 45 mA and 55 mA, respectively). Prior to applying stimulation, participants were reminded that stimulation would be applied and to inform the team if they felt any discomfort, whether it be painful, sharp, or another type of unpleasant sensation. Stimulation was then applied, and the team confirmed verbally with the participant that if the level of stimulation was tolerable for the whole duration of the visit. The current amplitude was gradually increased in incremental steps; at each level, the participant was asked to confirm that the stimulation was tolerable and that it could be further increased. This process was repeated until a maximum intensity (never exceeding a ceiling of 70 mA) that could be tolerated without experiencing discomfort and sustained for the entire visit was identified. The frequency was fixed at 30 Hz.
Closed-loop stimulation algorithms varied based on tasks. In this study we used variety of variables to test feasibility of the device. For upper extremity tasks, we utilized hand total acceleration or gyroscope readings, while bimanual tasks incorporated data from both hand IMU sensors. Trunk control tasks relied on data from head and sternum IMU sensors, and lower extremity tasks were assessed using foot IMU sensors. Isometric activities, such as wheelchair push-ups, employed EMG sensors (specifically, the Biceps Brachii) to trigger stimulation when activity exceeded a predefined threshold. While numerous variables could have been considered for each task, our aim was to showcase a subset of these possibilities.
No extra time was allocated for threshold adjustments during Closed-loop sessions. If a task deviated from the defined threshold, a clinician or technician modified the threshold or triggering variable/sensor in real-time.
Analysis of the immediate effects of stimulation waveform types on muscle activity
Muscle activity was captured via wireless surface EMG electrodes (Delsys Trigno System) at 2000 Hz placed on several arm muscles, including biceps, triceps, wrist flexors (Flexor Carpi Radialis) and extensors (Extensor Carpi Radialis). Offline analysis was performed in Python™ programming language. EMG signals were filtered using a 60 Hz second-order IIR notch filter and 10-500 Hz Butterworth second-order bandpass filter to eliminate artifacts and noise. EMG full-wave rectification was achieved by subtracting the average baseline from the signal and then obtaining absolute value of the signal. Subsequently, EMG mean envelope over 500-m epochs and frequency analysis were carried out as introduced in more details in the following sections.
Sessions inclusion for muscle activity analysis for LPU and RPF tasks (only clinical data was accepted for analysis from TS01).

To explore the effects of Stimulation type (Burst, No-Burst) on muscle activation, we conducted three analyses: (1) Comparing mean rectified EMG while the participant was at rest, with no stimulation (NStim rest), Burst Stimulation at rest (BStim-on rest), and No-Burst Stimulation at rest (NBStim-on rest); (2) Comparing mean muscle envelopes across stimulation types during activity periods; (3) Conducting frequency analysis for No Stim rest, BStim-on rest, and NBStim-on rest. The data for these analyses were collected during assessment sessions.
(1) For the comparison of at rest values, the mean rectified EMG signal was computed over 10-second windows for each assessment session. For this analysis, a two-way Kruskal-Wallis test was performed. This analysis explored Stimulation type (NStim, BStim, NBStim levels) and Muscle (Biceps, Triceps, Wrist Extensors, Wrist Flexors) effects on normalized mean rectified muscle activity at rest. Data was normalized with respect to the maximum value of the mean rectified muscle values across different stimulation types for each muscle and each assessment session. (2) For the mean muscle envelope comparison during activity, we explored the effects of different types of stimulations during RPF and LPU tasks. We normalized each session’s data with respect to maximum RMS value across all stimulation types, for each participant and for all assessment sessions. This analysis excluded the rest period data. A two-way Kruskal-Wallis test explored effects of factors Stimulation type and Muscle on normalized RMS values during task engagement. RMS values were normalized with respect to the maximum value of mean RMS across three levels of stimulation type variable for each muscle and each assessment session. (3) For the frequency analysis, the power spectrum of EMG signals was obtained by applying the Fast Fourier Transform (FFT) on rest period stim-off and stim-on time series for 10 sec time windows of data. Frequency content analysis compared power spectra of rest periods without stimulation (stim-off) and rest periods with stimulation (stim-on (BStim-on rest and NBStim-on rest)).
Results
All participants were included for Safety and feasibility analysis. Participants 2 and 4 completed all 28 study intervention visits; participant 1 completed 25 visits, participant 3 completed 20. Participant 1 was withdrawn at the discretion of the Principal Investigators (PIs) because he expressed unmet expectations for improving daily function, despite having conveyed understanding during and after informed consent that the primary purpose of the study was to establish safety and feasibility and not improve function. Participant 3 was also withdrawn by the PIs because she observed decreased tone in hand muscles, which adversely affected compensatory strategies that utilized the tone to hold objects. Although the potential of tSCS to affect spasticity had been anticipated, as a precaution, the team decided to suspend her participation in the study until she was evaluated by her treating physician to rule out other potential causes of change in tone. Although the participant expressed her willingness to continue and she was cleared by her treating physician, the time elapsed became too long for inclusion in the study.
Analysis of safety and feasibility
The Shapiro-Wilk test confirmed a normal data distribution for the safety and feasibility data. Diastolic blood pressure analysis indicated that Mode (closed-loop, open-loop) had a non-significant effect (p = .08), with no significant differences between time-points (pre, mid, post). Comparing ‘end’ to ‘pre’ stimulation yielded a non-significant p-value of 0.24 (p-value (pre, end)).
Systolic blood pressure showed a non-significant Mode effect (p-value (Closed-loop, Open-loop) = 0.62). There were no significant differences between time-points (p-value (pre, end)) = 0.26; p-value (pre, mid) = 0.37). However, a significant effect of Subject was observed (p-value = .01), with post-hoc analysis indicating higher systolic blood pressure for Participant 1.
The analysis of Heart Rate data revealed no significant differences in Mode (Closed-loop, Open-loop) with a p-value of 0.10. Time-point comparisons (p-value (pre, end) = 0.23; p-value (pre, mid) = 0.73) showed no significance.
Results for oxygen saturation were consistent, with no significant Mode effect (p-value = .98) and no significant time-point differences (p-value (pre, end) = 0.99, p-value (mid, pre) = 1.0).
Pain analysis revealed no significant Mode effect (p-value = .71) and no significant time-point differences (p-value (pre, end) = 0.17, p-value (mid, pre) = 0.41). Mean values for pre, mid, and post-stimulation sessions were as follows: pre (0.07 ± 0.35), mid (0.21 ± 0.60), post (0.2 ± 0.7).
Fatigue analysis showed a significant time-point effect (p-value (mid, pre) = 0.0, p-value (mid, end) = 0.001), with mean levels in the order of pre < mid < post. There was no significant Mode effect (p-value = .59). Mean values for pre, mid, and post-stimulation sessions were pre (1.11 ± 1.14), mid (2.27 ± 1.16), post (3.04 ± 1.32).
There were no adverse events reported for Participants 1, 2, and 3. For Participant 4, there were 3 adverse events reported out of 28 visits, but none were deemed related to the study intervention. For skin integrity, Participant 1 had 1 report out of 25 visits and Participant 4 had 6 reports out of 28 visits of skin integrity issues. However, the skin integrity noted included minor and impermanent redness of the skin at areas where EMG and IMU sensors were placed and were unrelated to stimulation sites on spinal column.
Normalized stimulation time analysis showed a significant Mode effect (p-value = .03), with Open-loop having a higher mean duration (Open-loop: 467.59 ± 148.99, Closed-loop: 410.77 ± 118.69 per task. The minimum and maximum number of tasks performed in any one intervention session was 3 and 6 respectively.
Analysis of muscle activity
A Shapiro-Wilk test revealed a non-normal data distribution for the muscle activity data. Hence, a non-parametric approach was adopted to assess factor effects on the dependent variable. Due to the limited sample size, each assessment session was treated as an independent observation. Our focus in this analysis was not on pre- and post-effect of stimulation on muscle activity but rather the immediate effect of stimulation types on muscles. Consequently, in subsequent analyses we grouped tasks (LPU and RPF) and sides (Right and Left) owing to hypothesized non-significance of task/side differences.
Initially, it was confirmed that there were no significant differences on muscle activity between different stimulation levels (NStim, BStim, NBStim) for the rest periods without stimulation.
There was a significant interaction effect between Stimulation-Type and Muscle (H (11, 92) = 81.474, p < .001). Tukey’s HSD method detected significant differences among the three levels of Stimulation-Type variable. This difference was detected only for proximal muscles (Biceps and Triceps) (p < .001), in which the mean of NBStim > BStim > NStim. Distal muscles (Wrist Extensors and Wrist Flexors) showed no significant stimulation-type differences (NBStim ∼ BStim ∼ NStim). The normalized mean rectified muscle values are shown in Figure 5. Mean rectified rest values across all subjects’ muscles during stim-off rest and stim-on rest (Burst and No Burst). Proximal muscles (Biceps and Triceps) showed a statistically significant difference between the stimulation types, with No Stim < Burst< No Burst. This trend was not observed in distal muscles (Wrist Flexor, Wrist Extensor).
For mean muscle activity envelope analysis, among 210 available muscle conditions for analysis, 24 were excluded due to the presence of 60 Hz line noise despite the use of a notch filter, or due to noise introduced by motion, which may have caused sensors to be dislodged or come into contact with the table. This analysis showed a significant interaction effect between Stimulation type and Muscle factors (H (11, 190) = 118.251, p < .001). Tukey’s HSD method revealed significant differences among proximal muscles Biceps and Triceps (p < .001), with NBStim > BStim > NStim. No significant differences among distal muscles (Wrist Extensors and Wrist Flexors) were observed (NBStim ∼ BStim ∼ NStim). The normalized mean muscle envelopes are depicted in Figure 6. Normalized mean muscle activity envelope for various stimulation types (No Stim, Burst, No Burst) and muscles (Wrist Ext, Wrist Flx, Biceps, Triceps), combining RPF and LPU tasks. It revealed a statistically significant difference in Stimulation-Type activation levels for proximal muscles (Biceps and Triceps), with No Stim < Burst < No Burst. However, this difference is absent for distal muscles (Wrist Ext, Wrist Flx), indicating No Stim∼Burst∼No Burst.
Figure 7 depicts BStim and NBStim raw EMG at rest, and power spectrum for stim-off rest (Panel A) and stim-on rest (Panel C) for a single participant. Amplitude of Burst and No-Burst were selected based on the participant’s reported comfortable tolerance level experienced when all channels were delivering stimulation simultaneously. For BStim this amplitude was set at 47 mA and for NBStim was 27 mA for the representative participant (Participant 4). Stimulation frequency was 30 Hz for both types. Panel C reflects the 30 Hz effect, with stim-on amplitude notably higher. It is important to note that y-axis scales are different, indicating greater stim-on amplitude when compared to stim-off values. Illustrates the frequency content analysis as well as raw EMG signal for the rest stim-off and rest stim-on for both Burst and No-Burst stimulation-types. Panels (a) and (b) depicts power spectrum for stim-off rest periods recorded for BStim and NBStim trials respectively. Panels (c) and (d) are depicting raw EMG signal at rest with stim-off (red) and stim-on (Blue) for BStim and NBStim respectively. Panels E and F are dpicting power spectrum of stim-on rest for BStim and NBStim trials respectively. Note the effect of 30 Hz frequency in panels E and F of the figure which suggests the stimulation frequency involvement. Note the differences in units for y-axis which shows much higher amplitude for stim-on w. r.t stim-off conditions.
Preliminary clinical impressions of the study
Scores collected from clinical assessment sessions are provided in Tables 4, 5, 6 and 7 of the supplementary materials. Supplemental Table 4 contains ISNCSCI data with motor scores, Supplemental Table 5 contains pinch and grasp force measurements and MAS scores. In Supplemental Table 6, data collected on quality of life, sleep, vital signs, and pain is shown. And lastly, Supplemental Table 7 contains scores for the COPM. These improvements seen in clinical outcome measures may be a reflection of the study design, potentially reflecting a training effect from the rehabilitation sessions, rather than solely the technology itself. However, it is important to emphasize we did not design the study to evaluate clinical efficacy of the RISES system, nor are we making claims regarding its efficacy.
Discussion
To be safe, the system must not adversely affect skin integrity, heart rate, or blood pressure, or cause adverse events such as autonomic dysreflexia. Furthermore, chronic pain levels must not increase, but rather remain stable or improve. Participant 3 was withdrawn from the study due to adverse event of decreased hand muscle tone, which impacted their ability to hold objects. While the potential of tSCS to affect spasticity had been anticipated as a desired outcome, the loss of function due to a loss of spasticity was not. Although Participant 3 was later cleared by their physician and willing to continue, the delay was too long for study retention. Next, we compared closed-loop and open-loop stimulation blocks, positing that the comparison should reveal no significant differences in vital signs, pain, fatigue levels, and setup time between the two modes.
The safety analysis, in line with our hypothesis, revealed no statistically significant alterations in vital signs (blood pressure, heart rate, oxygen saturation) across pre, mid, and post-stimulation timepoints of a session, irrespective of Closed-loop or Open-loop stimulation. Participant 1’s elevated blood pressure compared to other participants, aligns with his chronic hypertension history and it showed no statistically significant changes across different time-points during each intervention session due to stimulation. Regarding safety outcomes for pain and fatigue, there were no statistically significant differences in pain levels, affirming the safety of stimulation. However, anticipated fatigue increases across three time-points of each intervention session regardless of the stimulation block, linked to the activity-based sessions, emphasizes its potential as a risk factor in similar studies.
No statistically significant differences were observed between the Open-loop and Closed-loop conditions concerning vital signs, pain, and fatigue scale scores. There was no significant difference in setup time across two blocks. Closed-loop automation can simply be achieved by performing a task once at the beginning of the closed-loop session to set the trigger parameters. The decision to start with an Open-loop block was made to align with common practices in the literature and to assess the feasibility of the Closed-loop block compared to this established approach. Furthermore, there was no specific wash out period between two stimulation blocks. We acknowledge there could be carryover effects. However, we were focused on investigating safety, and feasibility of the new technology along with immediate effects of the two types of electrical stimulation waveforms incorporated in the system on muscle activities, and the focus was not on clinical efficacy. Therefore, such a study limitation was not deemed critical. In other words, we do not hypothesize that prior exposure to open-loop would have carryover effects on the instantaneous response to a subsequent stimulation.
For analysis of instantaneous effects of the two types of waveforms on muscle activities, proximal muscle activation increased during movement episodes and rest, with NBStim showing notably higher muscle activity during rest periods. Specifically, NBStim stimulation consistently elicited at least twice the average rest muscle activity compared to BStim in proximal muscles, despite having lower amplitude than BStim for all participants. Supplemental Table 8 represent the maximum comfortable tolerance levels reported by each participant for baseline, midpoint, and endpoint assessment sessions. While acknowledging the need for more controlled experiments, it’s important to note that the observed increase in muscle activity is not attributed to voluntary engagement. However, additional exploration is warranted to elucidate the pure effects of muscle activity. We acknowledge that the EMG signals reflect a combination of physiological and non-physiological phenomena when tSCS is delivered,43,44 and we conducted standard EMG filtering and did not filter out tSCS artifacts. Addressing this would require techniques beyond the scope of this study. At this juncture, it appears that NBStim stimulation induces higher stimulation noise (non-physiological) or a more direct contraction effect on muscles (physiological) when compared with BStim with reported parameters.
Furthermore, participants demonstrated higher tolerance for BStim amplitudes, with maintained voluntary control over movements and reduced risk of spasticity episodes compared to NBStim stimulation. This observation aligns with previous literature suggesting the benefits of BStim, including improved tolerability and potential enhancements in function. 19 This might be attributed to reduced spastic movements, an effect of stimulation that we observed in this study. However, since the two types of stimulations differ in parameters such as pulse width and inclusion of carrier frequency, it is not conclusive that BStim provides higher tolerance levels. With suggested parameters in this study however, NBStim provided higher muscle activity and less comfortable tolerance levels.
Conclusion
The RISES system has been shown to be feasible and safe for tSCS application to be incorporated in clinical settings. Participant 3 was withdrawn from the study due to adverse event of decreased hand muscle tone. This impacted their ability to hold objects. Potential of tSCS to affect spasticity had been anticipated. The closed-loop stimulation mode now offers personalized and task-specific capabilities, allowing for the modulation of parameters based on the specific tasks and the level of injury of the patients. Additionally, the RISES system provides a platform that integrates wearable sensors to drive the stimulation control and objectively measure neurophysiological and kinematic responses, surpassing mere clinical observation.
In analyzing muscle activity, while we observed effects of stimulation solely on proximal muscles and not on distal muscles, it is important to note that nerve-conduction measurements were not conducted in this study. Consequently, damage to lower motor neurons could have gone undetected, potentially influencing motor improvements or resulting in no observable change in distal muscles due to the stimulation.
Given that the mechanism of neurophysiological or therapeutic changes upon application of tSCS is still under investigation, the research team is developing a more comprehensive and targeted method to optimize stimulation parameters based on task and/or patient’s specific requirements. Improvements will be introduced in future studies. The next step for the research and development of the RISES system will mainly focus on the precise measurement of immediate neurophysiological or kinematic effects. This will be done alongside objective measurements of movement changes, aligning with more well-controlled clinical assessments to explore the potential efficacy of tSCS as a modality for neuromodulation.
Supplemental Material
Supplemental Material - Initial feasibility evaluation of the RISES system: An innovative and activity-based closed-loop framework for spinal cord injury rehabilitation and recovery
Supplemental Material for Initial feasibility evaluation of the RISES system: An innovative and activity-based closed-loop framework for spinal cord injury rehabilitation and recovery by Shirin Madarshahian, Tatiana Guerrero, Phyo Thuta Aung, Kristin Gustafson, James S. Harrop, Dana R. Johnson, Mehdi Khantan, Yunsoo Lee, Caio Matias, Michael McCurdy, Namrata Grampurohit, MaryJane Mulcahey, Alessandro Napoli, Alessandro Napoli1, Alexander Vaccaro and Mijail Serruya in Journal of Rehabilitation and Assistive Technologies Engineering.
Footnotes
Acknowledgements
The authors express gratitude to the Raphael Center for Neurorestoration members for their dedicated assistance. Special thanks to Erica Jones for trial logistics, and Megan Vesey for clinical collaboration. The authors also appreciate the participants’ valuable time and engagement in the study.
Declaration of conflicting interests
The author(s) declared no potential conflicts of interest with respect to the research, authorship, and/or publication of this article.
Funding
The author(s) disclosed receipt of the following financial support for the research, authorship, and/or publication of this article: This study is supported by Reynolds Innovative Spinal Electrical Stimulation Program.
Supplemental Material
Supplemental material for this article is available online.
References
Supplementary Material
Please find the following supplemental material available below.
For Open Access articles published under a Creative Commons License, all supplemental material carries the same license as the article it is associated with.
For non-Open Access articles published, all supplemental material carries a non-exclusive license, and permission requests for re-use of supplemental material or any part of supplemental material shall be sent directly to the copyright owner as specified in the copyright notice associated with the article.