
Abstract
Keywords
Introduction
In children with spinal cord injury (SCI), lack of trunk control due to neuromuscular paralysis/paresis increases the risk of secondary conditions, e.g., scoliosis and compromised lung function.1–5 Recent research shows that activity-based therapy (ABT) is effective at improving trunk control in this population. 6 In order to address the need for children to continue to activate trunk muscles in the home, a prototype rocking chair designed for children with SCI and compromised trunk control, was designed, built and tested for safety and utility. 7
To validate that rocking in this rocking chair activates muscles, typically developing (TD) children and children with SCI rocked in the chair while muscle activity was recorded using electromyography (EMG). Comparisons were drawn between muscle activation patterns in the two cohorts, and it was established that muscle activity during rocking is significantly higher than at baseline for muscles in arms, legs, and trunk. 8
This paper will build on this previous work by incorporating various sensor technologies into the chair to provide feedback to therapists about user activity while rocking in the rocking chair. Factors such as rocking duration and amplitude can be tracked easily with the use of simple sensors incorporated into the rocking chair. More advanced analysis techniques are required to gain information about patterns of muscle activity during rocking. Electromyography (EMG) is the accepted standard used to detect muscle activation, but there are many contexts in which its use is impractical. A rocking chair with appropriately located force sensors, when paired with machine learning techniques, has the potential to infer muscle activity of the limbs and trunk during rocking. Information about the which muscles are employed by the child to make the chair rock, as well as insight into the ways muscle use patterns change over time would provide useful information for therapists interesting in longitudinal tracking of improvements provided by muscle activation activities. By adding multiple sensors in strategic locations to measure forces applied to the rocking chair and body movements initiated by the child, a variety of rocking activity data can be collected and interpreted.
Study rationale and objectives
In this study, data recorded from sensors embedded in the prototype rocking chair will be used to quantify chair and participant motion, as well as forces applied by users. This data will then be used to create models capable of inferring subject muscle activations using multiple linear regression as well as machine learning techniques including regression learning and neural network modeling techniques.
Objectives that will be pursued are as follows: 1. Sensor integration and data collection a. Incorporate sensors into the rocking chair to track rocking parameters (duration, frequency, amplitude) and forces applied by the user. b. Capture EMG data to quantify muscle activation, and sensor data to detect forces applied to the rocking chair while children (TD and with SCI) rock. 2. Data Processing and Model Creation a. Process data into forms suitable for use in regression and machine learning models. b. Create models using data from chair sensors to predict muscle activation during rocking. Three models will be created using (1) multivariate regression, (2) regression learning, and (3) neural networks. 3. Performance evaluation and assessment for clinical utility a. Evaluate the efficiency and accuracy of the predictive models by comparing them against actual muscle activity data. b. Compare model performance to determine which models perform best at delivering predictions with clinical utility for therapists. c. Assess how rocking chair sensors contributed to muscle activity predictions. d. Discuss model performance and practical utility of the inferred muscle activation data for therapists, including its potential for long-term monitoring and intervention planning.
Machine learning application to chair sensors
Biomechanical modeling using inverse dynamics calculated from three-dimensional motion capture and force-plate data has been used to assess loads on internal anatomical structures including joints and muscles. 9 In the context of rocking in the home, however, biomechanical modeling cannot easily be used to quantify muscle activation forces. This challenge stems from multiple factors, including the requirement for costly motion capture systems, which are not available in the home or even in most clinical settings, and the need for accurate measurements of multiple reaction forces on the rocking chair. Additionally, factors such as the need for custom biomechanical modeling for each child, and complicated setup procedures for each rocking session complicates this approach.
For similar situations where motion capture and/or force plate data cannot be obtained, machine learning methods have been used to aid in biomechanical analyses. 9 Examples include estimation of ground reaction forces based on body-worn accelerometer data 10,11 and estimation of voluntary elbow torque based on EMG and kinematic data. 12 In addition to analysis of biomechanical problems, machine learning techniques may draw inferences based on data from sensors embedded in equipment used by patients. An example of this is the use of Logistic Regression and Feed Forward Neural Networks to categorize the orientation of patients in bed based on data from load cells positioned under the legs of the bed. This system could then help to reduce the incidence of pressure sores by alerting caregivers when the position of a patient has not changed after a prescribed period of time. 13
Regression learning
Regression learning is a supervised learning technique that is used to find the correlation between independent input variables and a dependent output variable. In this work, ensemble learning, which utilizes multiple regression models to learn relationships between a set of features and a response, will be used. 14 These models are then combined to produce a stronger learner with improved generalization performance. The base learner that was selected for this work is the decision tree, and boosting was chosen as the approach to constructing the composite learner. Boosting is an incremental learning process for constructing the composite learner, in which new learners compensate the error from previous learners. 15
Neural networks
Briefly, a neural network is a common machine learning model built from layers of interconnected artificial neurons. A typical neural network consists of an input layer, an output layer, and one or more hidden layers. Neurons in each layer are interconnected nodes with neurons in neighboring layers, and weights are assigned to these connections. 16 Training of a neural network involves adjusting these weights to minimize the error between the predictions and the actual targets. Learning algorithms, such as backpropagation, where errors are propagated back through the network from the output layer to reduce overall error, are used to adjust weights. Regularization techniques can also be applied to prevent overfitting, a situation where a model performs well on training data, but poorly on new data. Regularization can help maintain smaller weights and produces models that are better at generalizing to new data. 17
Using these techniques, models in this study will be trained to infer muscle activation in 12 individual muscles in the arms, legs, and trunk of each subject. Finally, the performance of the model will be compared against individual sets of activity data to evaluate the efficiency of predicting activation of specific muscles during rocking by SCI patients.
Materials and methods
Participants
Participant characteristics.
Rocking chair instrumentation
Sensors used to collect data for training machine learning models.
FSR = force sensing resistor; CoP = center of pressure
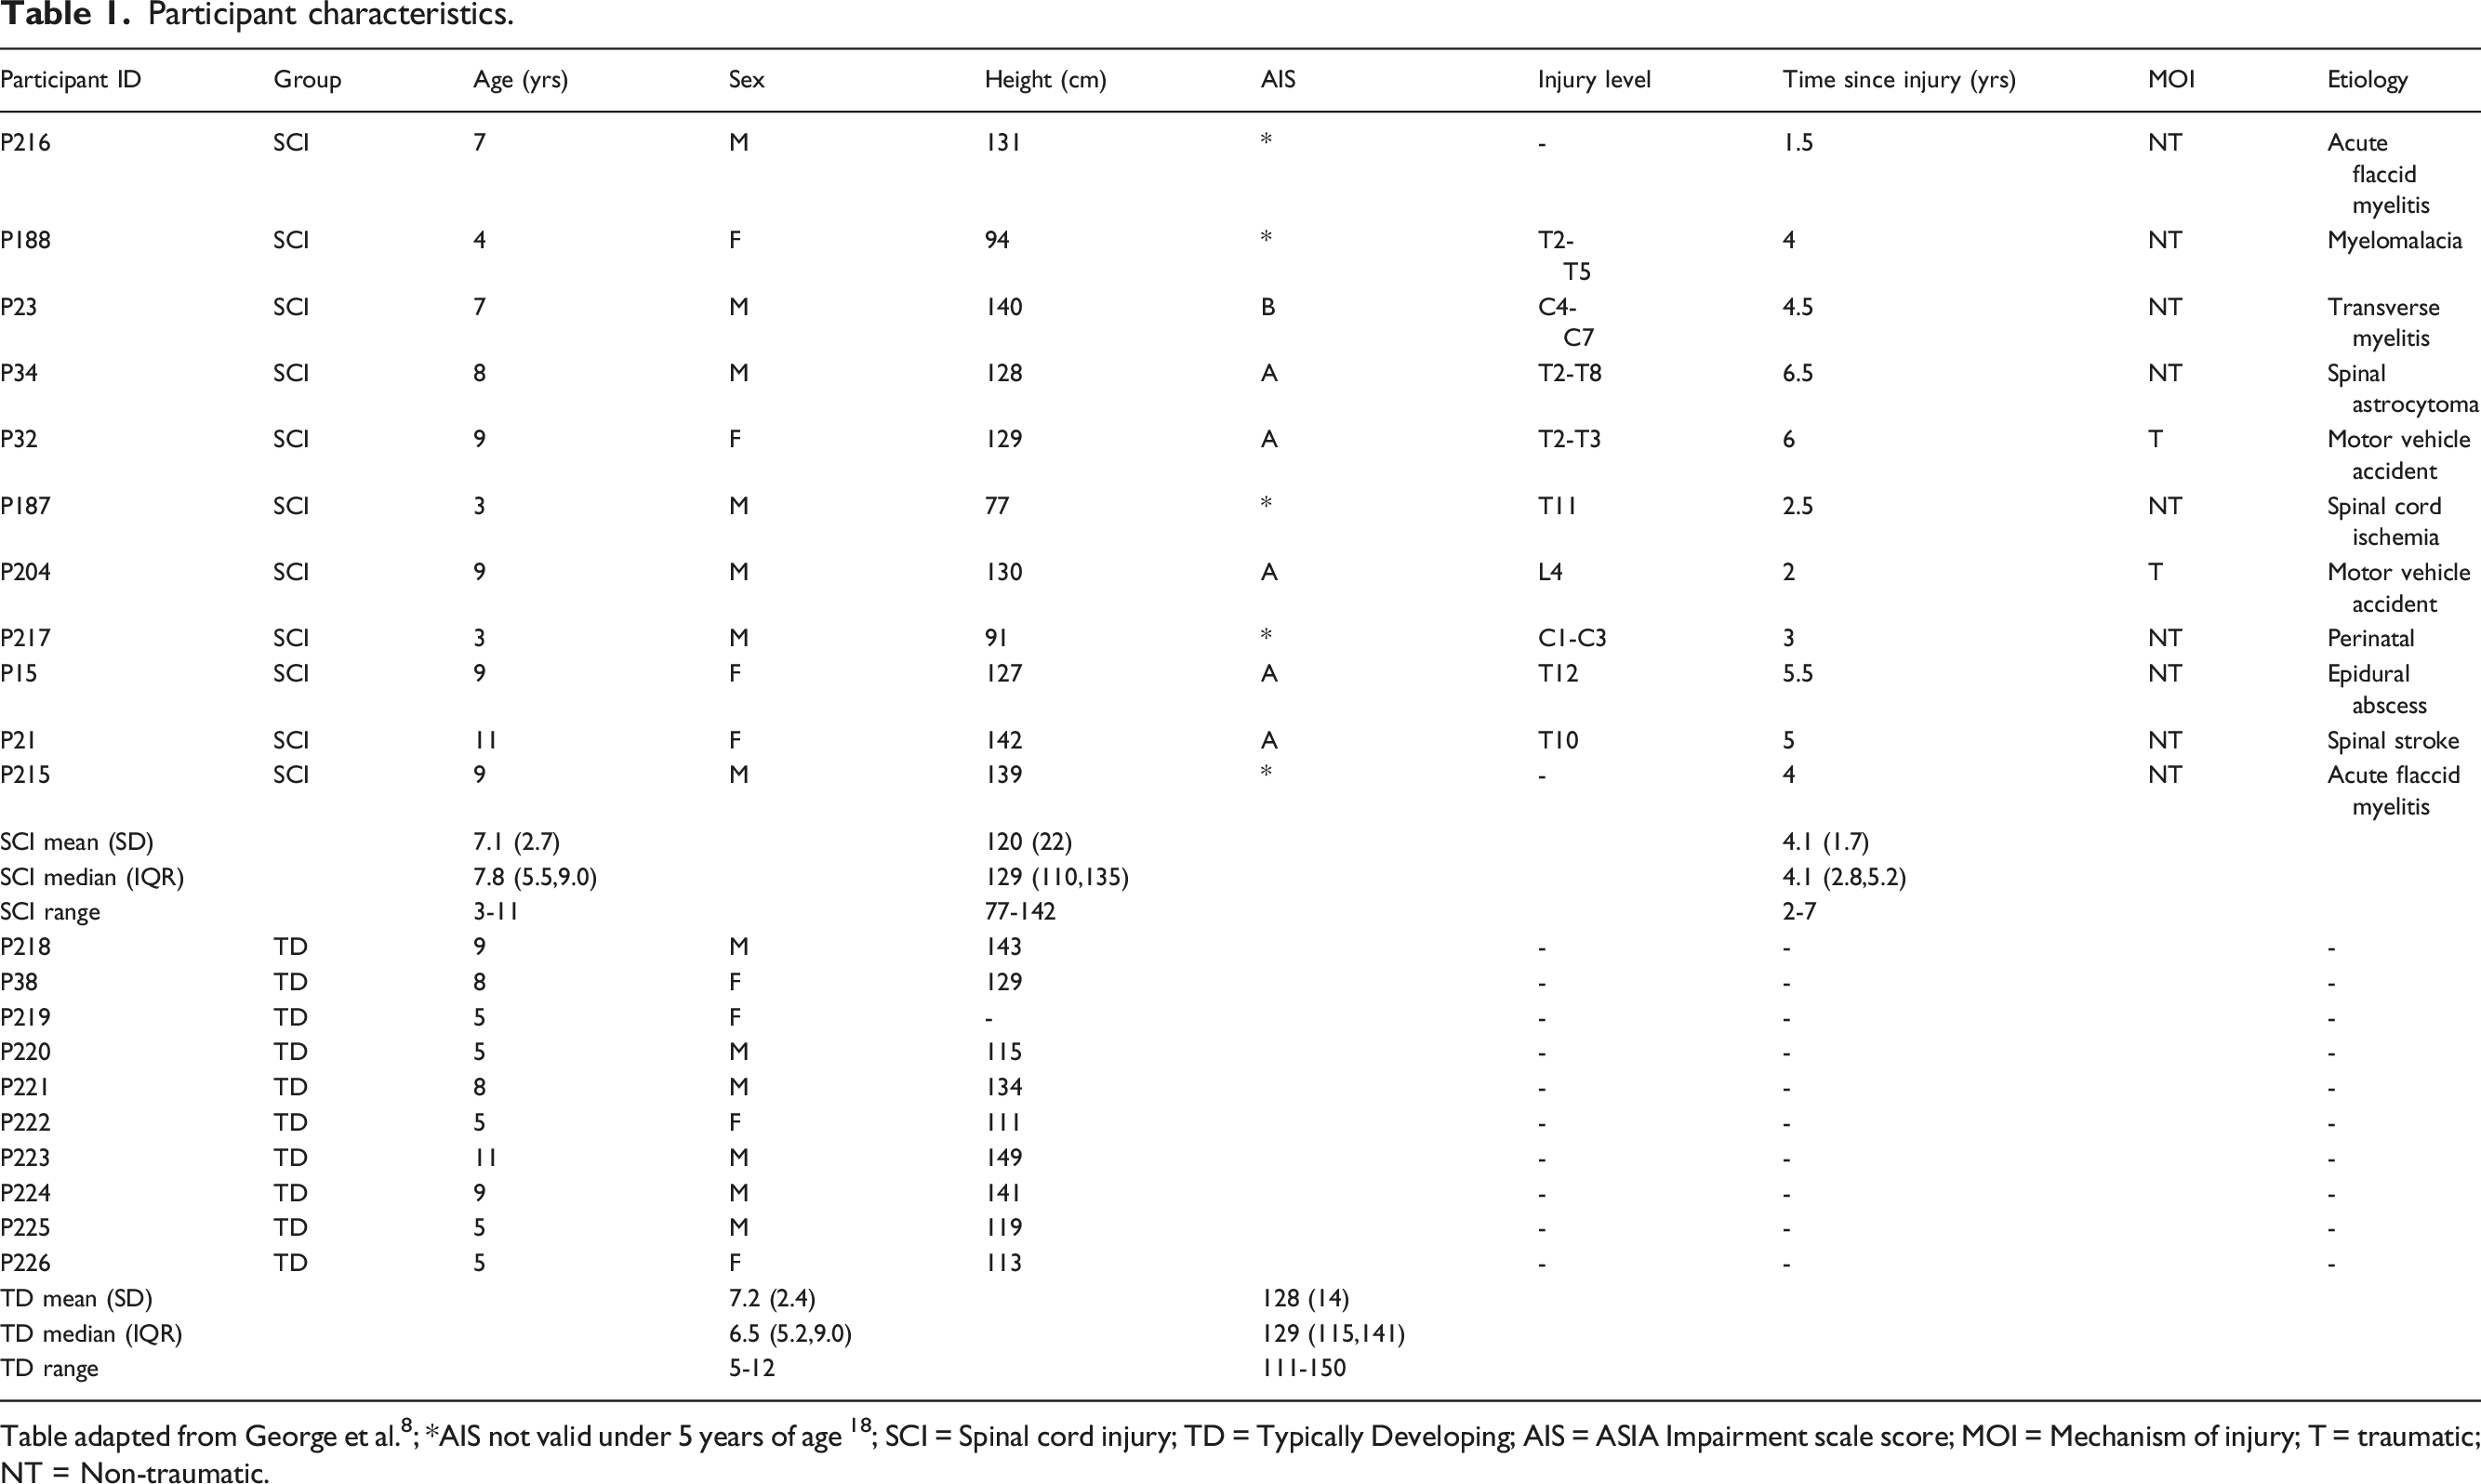
Single zone, force sensitive resistors were installed on the arm rests (Walfront SF15-150 Force Sensitive Resistor, sensitivity range 0.1 – 100N), and in the seat of the chair (Interlink Electronics FSR® Model 406, sensitivity range 0.1 – 10N) to track forces applied during rocking. In order to increase the sensitivity of the FSRs, actuators were designed and 3D printed to concentrate the applied force. For instance, the actuator for the arm rest FSR (Figure 1) sat between the armrest cushion and the FSR and helped to ensure that force applied to any part of the cushion would trigger a similar response from the FSR. Force Sensing Resistor with 3D Printed actuator on armrest of chair.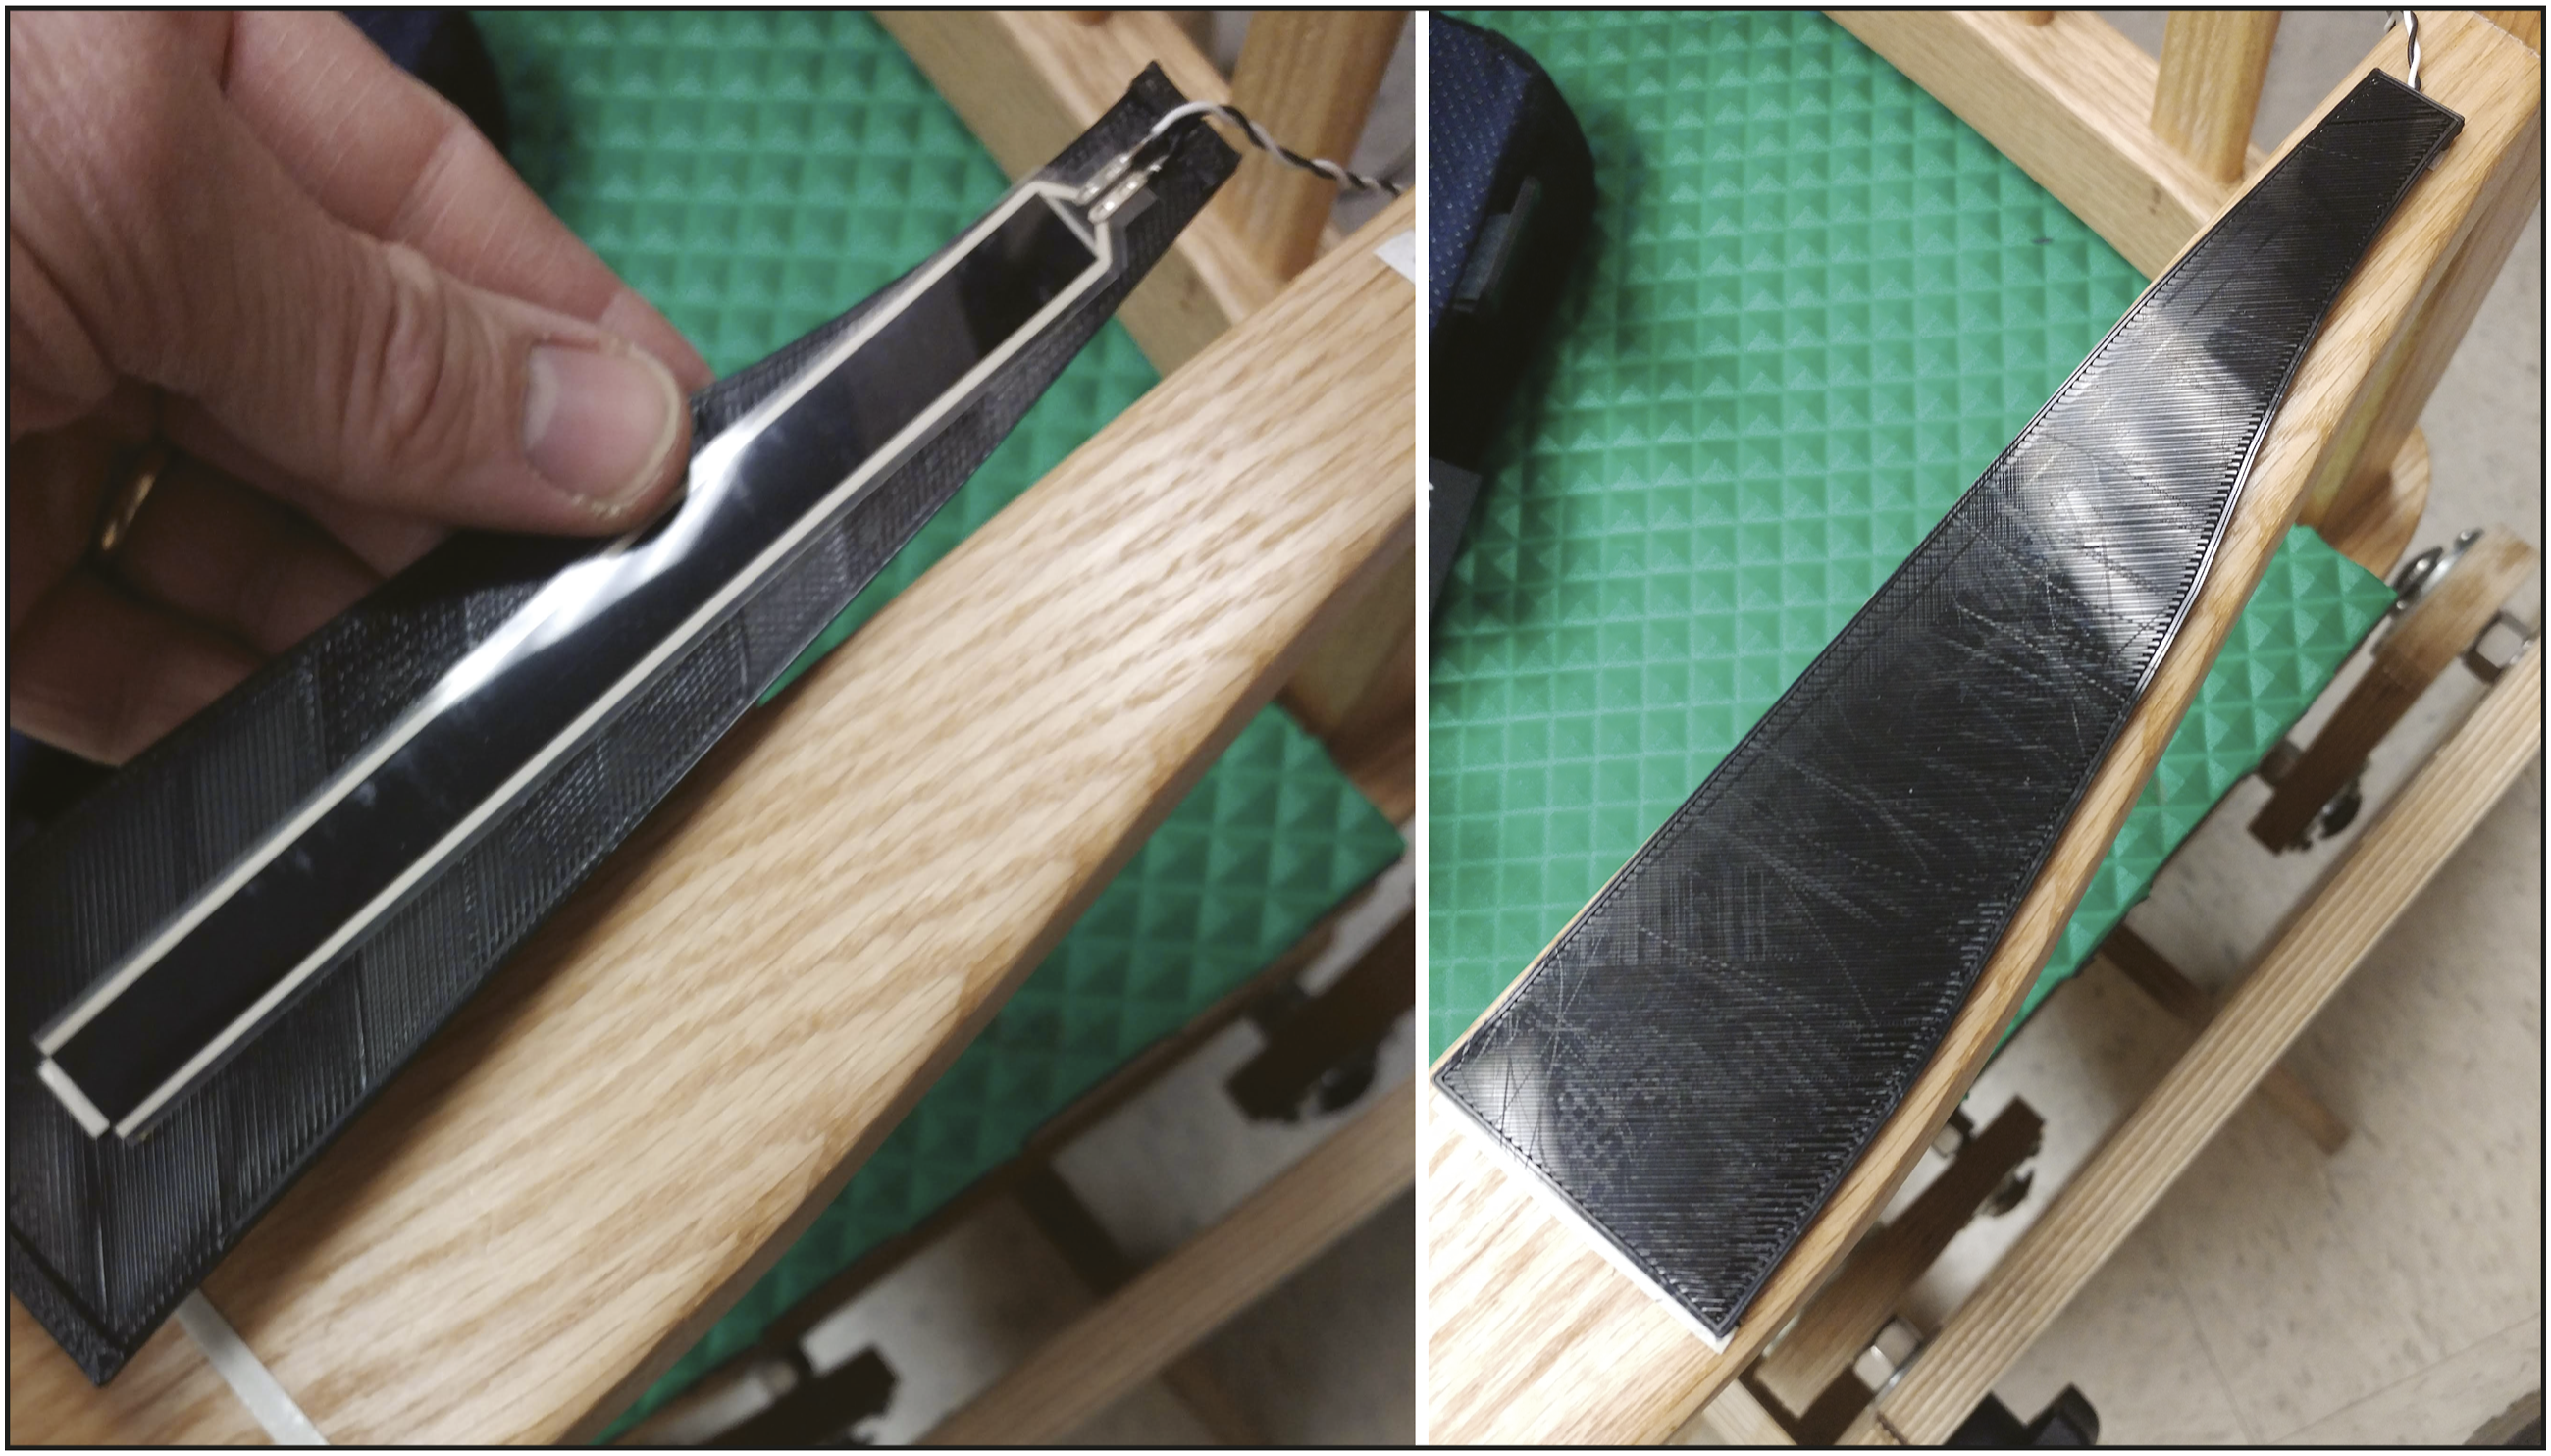
Similarly, the seat FSRs were mounted on a flexible 3D printed mat and 3D printed actuator positioned over them to enhance their sensitivity to forces applied to the seat padding overlaying them.
The footrest was constructed of two sheets of Baltic Birch plywood, with four recesses cut in the lower piece and load cells (SMAKN® Half Bridge Body Load Cell Electronic Scale Weighing Sensor 50 Kg) set into each. The top sheet of plywood was then placed on the load cells and attached with screws which passed through holes drilled in the lower sheet of plywood, which allowed the upper sheet to move vertically, but constrained horizontal motion. This allowed any load placed on the footrest to actuate the sensors, which were connected in an eight active element Wheatstone bridge configuration. Changes in voltage output were amplified and saved to quantify applied loads on the footrest.
A position sensor was constructed using a rotary linear potentiometer (TT Electronics, P160KNP) installed on the base of the chair and coupled to one of the chair rocker arms via spur gears. This setup was used to track the position of the chair throughout its entire range of motion. The potentiometer was configured as a voltage divider (5V input, 10k ohm fixed resistance, 10k ohm variable resistance), and the voltage read from the center pin of the potentiometer corresponded to the dynamic position of the chair.
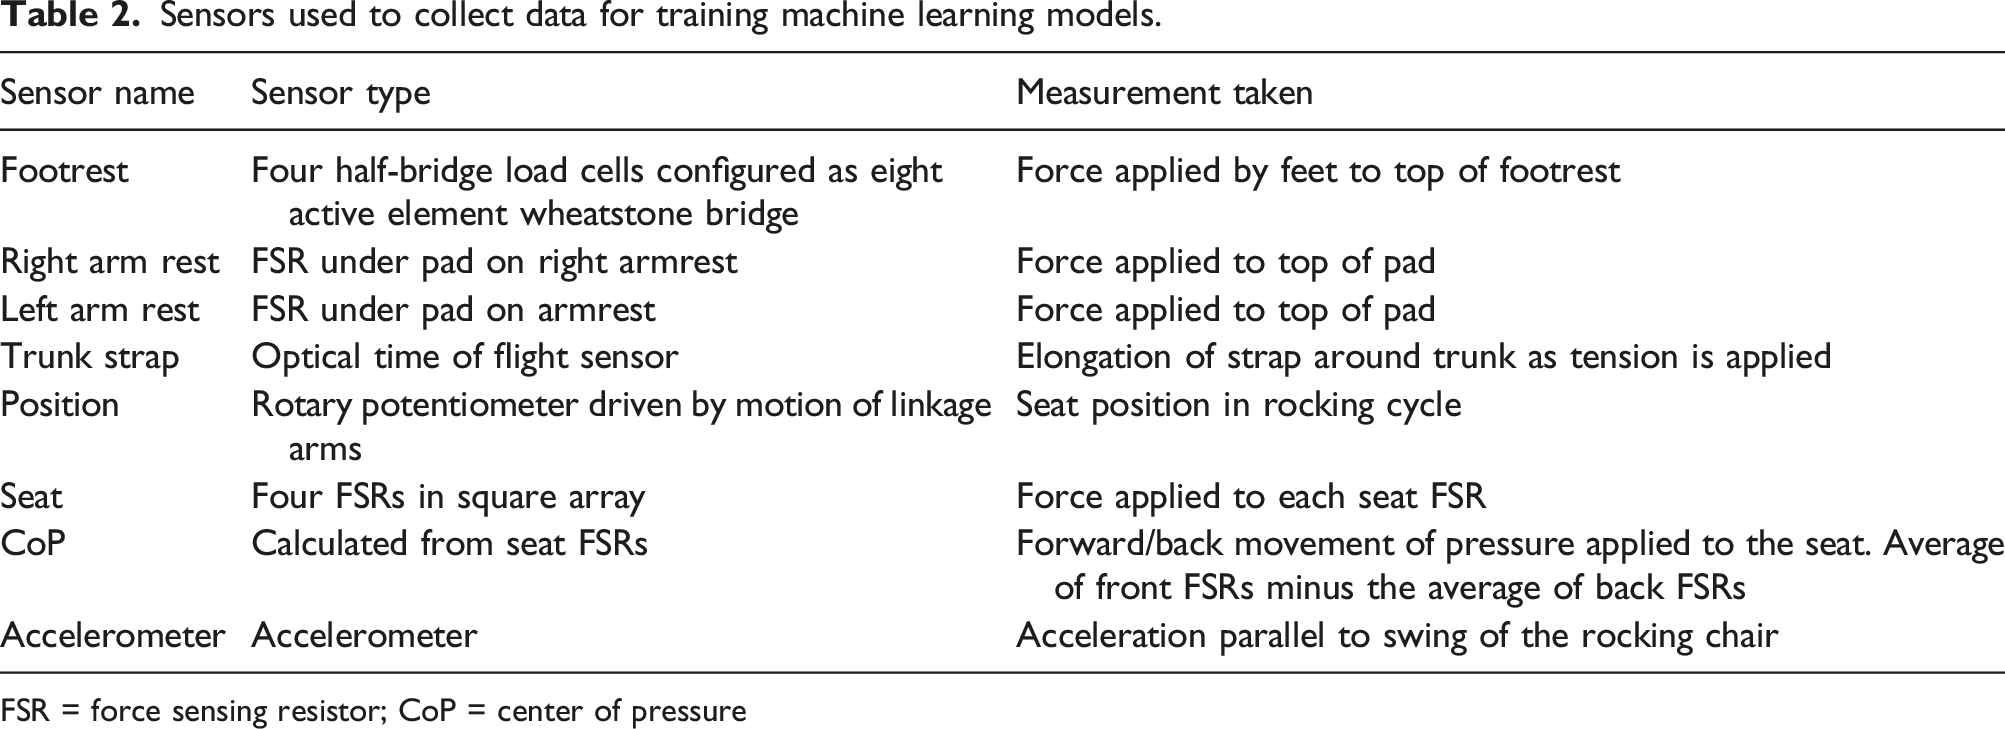
To track trunk motion, a novel force sensor was incorporated into a chair safety strap. This sensor has been described in detail in Lin et al.,
19
but briefly, consists of stretchable fibers with a urethane core and a silicone cladding sandwiched between two pieces of elastic fabric with the ends routed, via a 3D-printed mounting block, to a 5 × 5 mm mirror oriented to couple the fiber ends to the ports of a miniature time-of-flight (TOF) sensor for light detection and ranging (LIDAR) (Pololu VL53L0X ToF sensor, Pololu Robotics and Electronics). This arrangement allows the TOF chip to detect elongation of the optical fiber as the fabric is stretched. This sensor was attached to a belt (AliMed® Pediatric Walker Belt) using hook-and-loop fasteners at each end, so that the elastic portion of the fabric would elongate when tension was applied to the belt. This belt was attached to the seat back of the chair as shown in Figure 2 and fastened around the trunk of the subject during rocking so that trunk movement would stretch the optical fiber, producing a signal from the TOF chip which was recorded. It should be noted that this sensor became available after data had been collected from the first seven children with SCI. Data from the strap is available for the last four children with SCI who were tested, and for all TD children. Optical stretch sensor on belt mounted to rocking chair.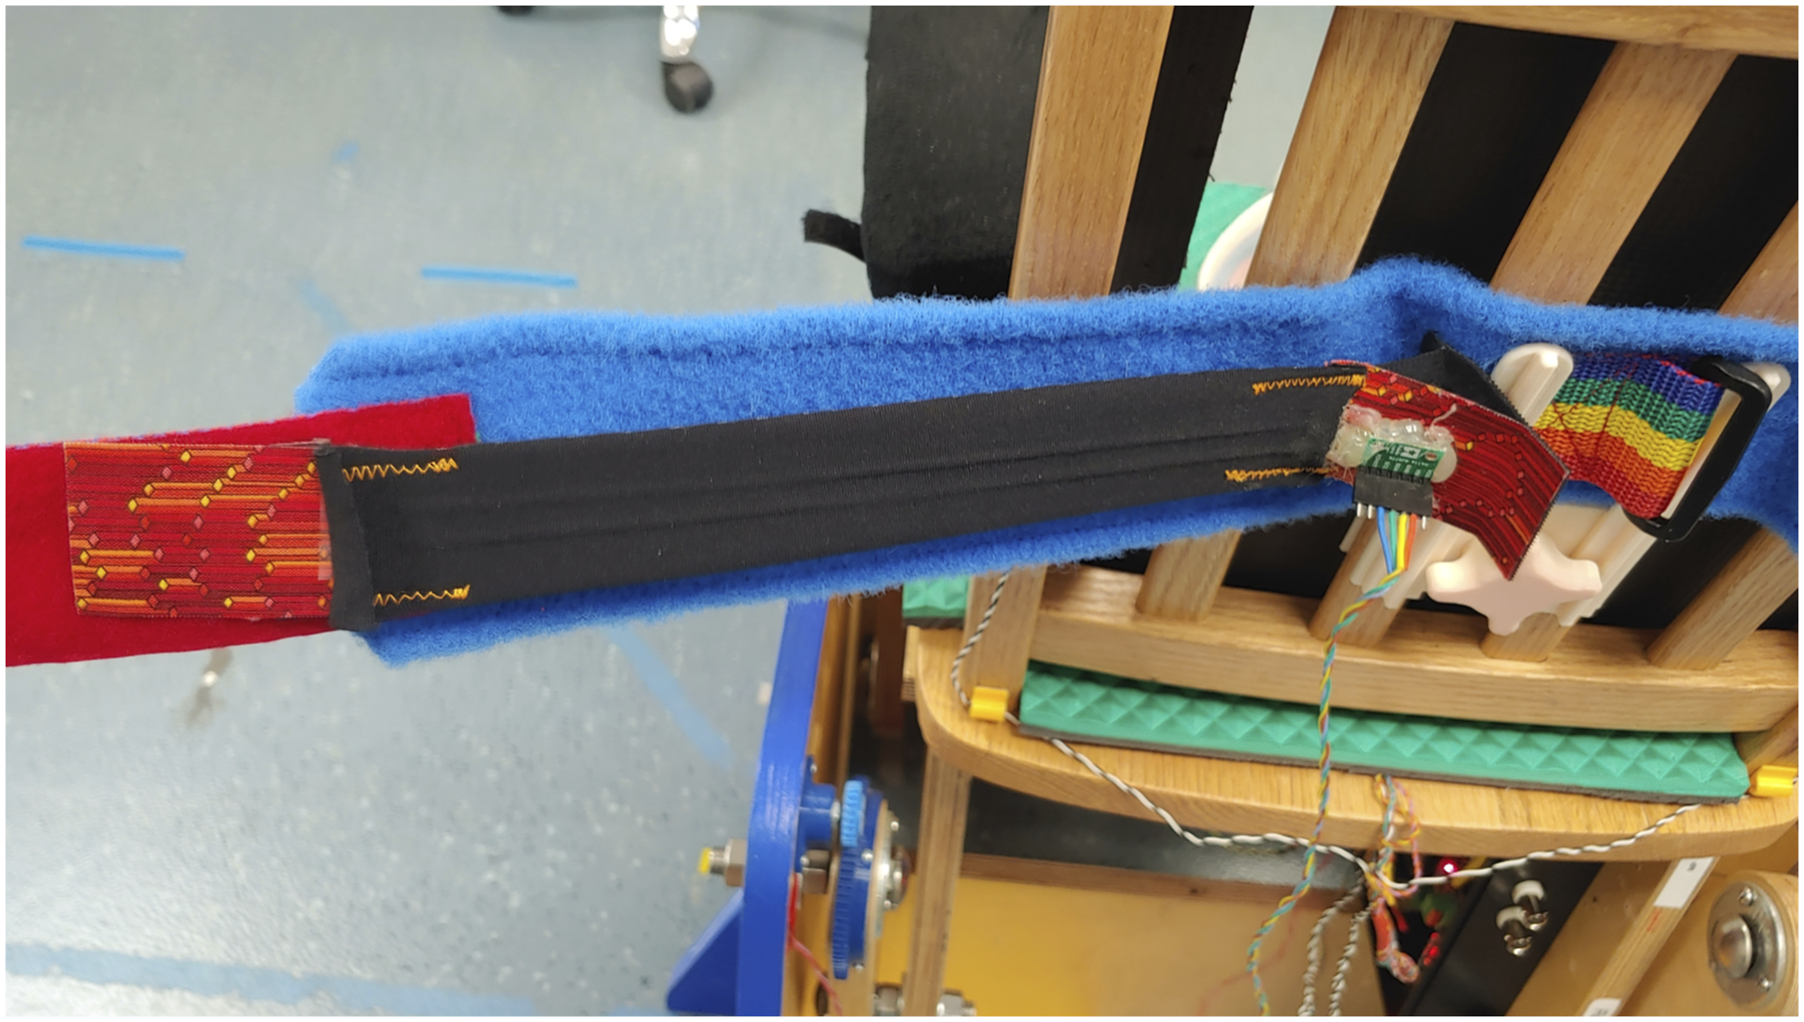
All sensors were connected to a custom PCB, which was designed to plug into IO ports A and B on an NI myRIO 1900-(National Instruments, Austin, Texas) as shown in Figure 3. A load cell amplifier (SparkFun Qwiic Scale NAU7802, Sparkfun Electronics, Niwot CO) was mounted on the PCB to acquire data from the load cells in the footrest. Serial I2C data from the load cell amplifier and the TOF sensor were acquired by an Arduino Nano (Arduino.cc) mounted on the custom PCB and relayed to the myRIO-1900 where all data was saved to file for later analysis. Custom PCB for data collection.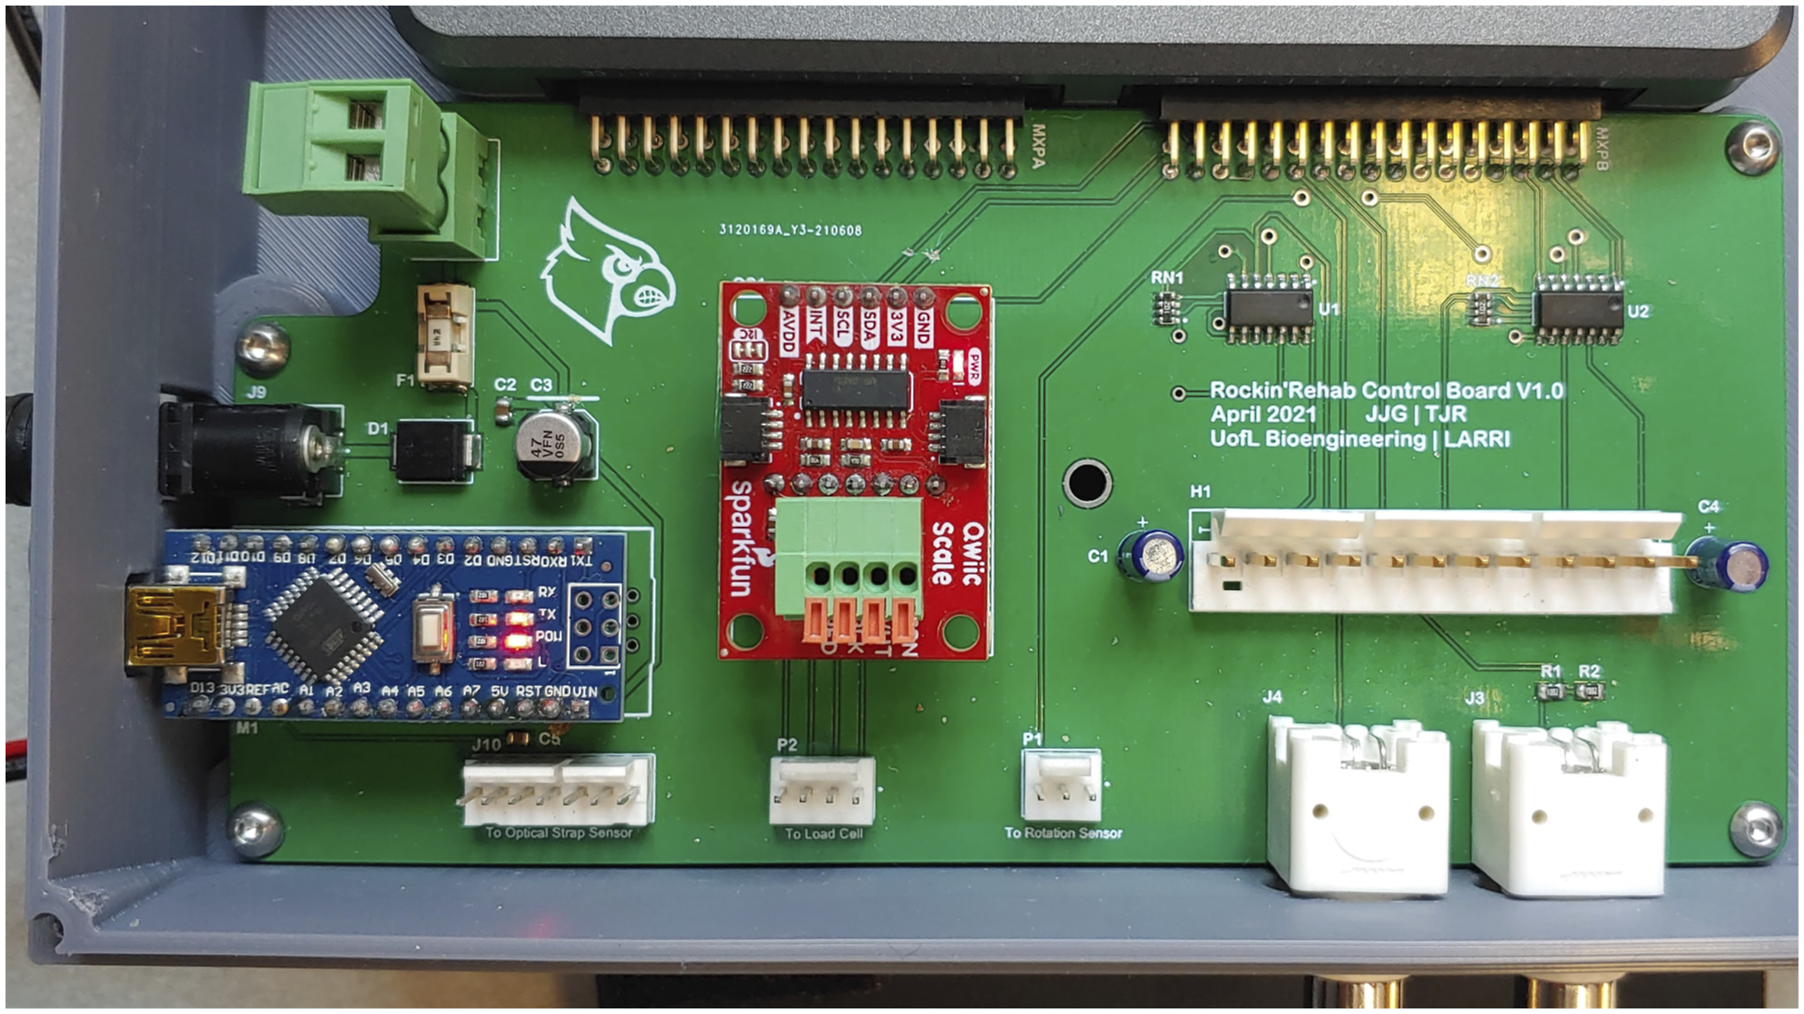
Data collection
Muscles targeted for EMG data collection.


EMG and Sensor data collection session.
Data from sensors embedded in the rocking chair was acquired at 40 Hz, and a pulse signal was recorded at the beginning and end of each data capture session to facilitate synchronization between the 2000 Hz sEMG data and the sensor data.
Regression model development
Data Processing and feature extraction
Four FSRs in the seat of the chair positioned in a square array were used to generate an approximation of the center of pressure applied to the seat. This was calculated by taking the average of the front FSRs minus the average of the back FSRs. This generated a measure of fore-aft changes in pressure as the child rocks and can be used to detect weight shifts due to trunk movement. This data was treated as a separate sensor output, and features were extracted from it as well as from the individual seat sensors.
To synchronize the sEMG data with the sensor data, it was necessary to increase the data rate of the sensor data to match the 2000 Hz rate of the sEMG data. This was done with a custom MATLAB script which identified the beginning and end of each data collection in both data files using the synchronization pulse, and linear interpolation was used to match sensor data to the data rate of the sEMG data.
Artifact removal and rocking cycle creation
Data was imported into MATLAB, where cardiac artifacts were removed, and data was separated into individual rocking cycles. Each rocking cycle was standardized to 1000 data points in length, and sensor data was normalized to the peak-to-peak amplitude of the corresponding cycle using equation (1) as described in Elamary et al.20,21
Features extracted from sensor data to use when training machine learning models.

Regression models
Due to challenges encountered when normalizing the EMG readings in SCI patients, where no maximum exertion is possible, selecting the normalization method that best corresponds to the amount of force exerted by the muscles was challenging. Several normalization techniques were trialed, including normalization by subtracting the baseline EMG reading before rocking started, using the peak-to-peak amplitude of the EMG readings during rocking, and normalizing by dividing each reading by the maximum reading recorded during rocking. Ultimately, training targets were based on EMG readings which were normalized by subtracting the baseline reading from each data point.
For training, data was segmented into a training data set and test datasets. First, data from each participant was segmented in half, and the first half of the data from all participants was assembled into a training dataset. The second half of the data for each participant was used to test the trained regression model.
Two regression models were developed. The first was developed using multiple linear regression in Prism 10 (GraphPad Software, San Diego, CA, USA). First, predictors were standardized by scaling to have a mean of zero, and a standard deviation of 1. Variance inflation factors (VIF) were then calculated and were used along with a correlation matrix to manually remove predictors with a high degree of multicollinearity. Once all predictors had a VIF <10, p-values of the remaining predictors were used to manually eliminate predictors which contributed little to the model. Multiple linear regression was then performed, and β values were produced for each predictor. This procedure was repeated for each muscle. A custom MATLAB script was then used to test the models using testing data from each child.
Another regression model was also created, using the MATLAB regression learner. To evaluate for the optimal training method, sample datasets were trained all available methods including linear regression, regression trees, support vector machines, Gaussian process regression, kernel approximation regression, and ensembles of trees. Models were initially screened by comparing mean squared error (MSE) for sample datasets. A custom MATLAB script was used to train the model using the ensembles of trees method, with the boosted trees option.
Neural network model development
A nonlinear input-output time-delay neural network was created and trained in MATLAB, using sensor data as the predictors and EMG data as the targets. As with the data for the regression model, to standardize the length of a rocking cycle across subjects and cycles, and to ensure that time delayed inputs would always be representative of the same point in the rocking cycle relative to the target, data were interpolated to 1000 data points per rocking cycle. To optimize network parameters, several models were trained, altering input delays and the number of layers.
EMG and sensor data from each subject was split into training, testing, and validation datasets, with training data comprising the first 60% of the data and testing and validation data comprising the 20% immediately following the training data, and the final 20% respectively. Since muscle activation, which provided the target data for training the neural network in the form of EMG data, was driving the sensor output, the sensor data was offset from the EMG data, so that the inputs used to predict a specific target value were taken from the rocking cycle immediately following the target as well as the rocking cycle previous to the target time point.
The network was trained using Bayesian Regularization backpropagation, a network training function that uses Levenberg-Marquardt optimization to update weight and bias values. By minimizing a combination of squared errors and weights, it penalizes large weights and produces a network that generalizes well.21,22
The network was set to 8 hidden layers, 11 inputs based on the 11 sensor values, and 12 outputs for muscle activation targets. Input delays were between 0 and 2000 with a step-size of 100, giving an array of 21 values for each input (1 at the same time point as the target, 10 from the previous cycle, and 10 from the subsequent cycle). Maximum number of training epochs was set to 100, with a stop condition of 10 consecutive validation failures. Separate models were trained for each child, and trained models were tested using the prepared testing datasets.
Model evaluation
The multiple linear regression model, ensemble regression model, and the NN model performance were tested using the test dataset previously created. Several measures of model performance were calculated based on the predictions produced by the entire test dataset. These include R2, Mean Absolute Percentage Error (MAPE), Mean Squared Error (MSE), Root Mean Squared Error (RMSE), Mean Absolute Error (MAE), and Sum of Squares (SS), 23 which were calculated for each model and compiled into a table for comparison.
Another measure which may be useful to therapists is which of a child’s muscles are most active and which are least active during rocking. Knowledge of these relative muscle activation patterns could enable therapists to evaluate the effectiveness of rocking for a child even if absolute predictions of muscle activity were not sufficiently precise. To investigate the utility of the models in predicting relative muscle activation patterns in individual children during rocking, the test data for each child in the SCI group was used to predict muscle activation with each model. Correlation of the means of predictions with targets for each muscle was calculated to evaluate how well the activation patterns identified by the predictions matched the observed muscle activation. Many of the datasets failed normality tests, so Spearman correlation analysis was selected, and results were compiled into a table.
Evaluation of sensor data correlations
To investigate which sensors produced useful data for predicting muscle activity, features were evaluated for correlation with muscle activity using the Minimum Redundancy Maximum Relevance (MRMR) algorithm in the MATLAB regression learner. For each muscle, the feature that was rated highest was tabulated, and cross-referenced with the sensor it was derived from. These results were compiled into a table showing which sensors were most correlated with trunk, arm, or leg muscle activity.
Results
Model comparison
Comparison of error for muscle activity prediction models.

R=2 R squared; MAPE = mean absolute percent error; MSE = mean squared error; PS = paraspinals
R2 and MAPE were the primary metrics used to compare models, due to their ability to compare models with outputs that are scaled differently from each other. By both these measures, the neural network outperformed both regression models, with the decision tree regression receiving a higher R2 value than the neural network for only three muscles (thoracic paraspinal, biceps, and gastrocnemius) and multiple linear regression scoring worst in both measures for all muscles except the triceps, where it scored very slightly (751% vs 775%) better than decision tree regression.
Muscle activation pattern prediction
Spearman correlation analysis of predictions for SCI group.

Spearman r (95% confidence interval) p-value of correlation between the mean muscle activation predictions and targets for each child in the SCI group; *Significant (p < 0.05) correlation between predictions and targets
To demonstrate the potential utility of this result, Figure 5 compares predictions from each of the three models for one of the participants with SCI (P188). For this example, which showed significant correlation for all models, one can see that, although the distribution of predictions for a given muscle is often different than that of the targets, the predictions tend to show a similar pattern with respect to which muscles are highly active and which display low activity relative to the others. Thus, a therapist looking at these predictions would be able to get an idea of which muscles were primarily being activated during rocking, even if the exact magnitude of activation was uncertain. Example of muscle activation pattern predictions vs. target muscle activations for one participant with SCI (P188). Note that targets for Neural Network predictions differ from regression models due to target calculation methods. †Cervical sensors not used due to participant discomfort.
Sensor correlation with muscle activity
Minimum redundancy maximum relevance analysis of correlation between features derived from each sensor and muscle activity in trunk, arms, and legs.

Count of how many features based on each sensor were the most correlated with different muscle groups; CoP = center of pressure
Discussion
The results of this study demonstrate that the neural network model consistently outperforms both the multiple linear regression and decision tree regression models in predicting muscle activation in children using the rocking chair. This finding is significant as it suggests that more complex machine learning algorithms may offer superior predictive capabilities compared to simpler statistical methods, especially in the context of multifactorial data such as muscle activation.
Model performance
The neural network model exhibited the highest R2 values across most muscles, indicating a stronger ability to explain the variance in muscle activation compared to the other models. Spearman correlation analysis also showed the neural network to be better at predicting patterns of muscle activation for individual children, further reinforcing its superior performance in this task. Decision tree regression achieved higher R2 values than the neural network for three muscles (thoracic paraspinal, biceps, and gastrocnemius) suggesting that decision tree regression can occasionally match or exceed neural networks in certain specific cases, but that it generally falls short in overall performance. Multiple linear regression performed worst by almost all measures, suggesting that this method may be insufficient for capturing the complex relationships between input features and muscle activation.
Additionally, while the neural network model demonstrated superior performance in most cases, the instances where decision tree regression outperformed it indicate that there may be specific scenarios where simpler models can also perform well. Future work should attempt to identify these conditions and optimize the choice of predictive models accordingly.
Model utility
The gold standard for muscle activity detection would be to reliably predict the magnitude of activation for each muscle during rocking. While the models developed in this study do not yet achieve this level of accuracy, it may be achievable in the future. The current neural network model, however, is able to rank a patient’s muscle activation patterns well enough to enable therapists to discern which muscles are most and least active during a rocking session. This information can inform therapists about whether muscles they wish to target are being activated, and may also allow them to tailor therapeutic exercises to target specific muscle groups that are underutilized. The capacity to track relative muscle activation could also provide a tool for monitoring changes in activation over time. By comparing activation patterns across multiple sessions, therapists can assess changes in muscle use, identifying improvements or areas that require further attention.
Models that are able to reliably distinguish between active and inactive muscle states would also provide useful information to therapists. This capability could help to ensure that children engage the appropriate muscle groups during rocking, thereby maximizing therapeutic outcomes. With respect to this metric, the neural network model performed well, accurately predicting very low activation (arbitrarily set to <5 µVRMS for purposes of this analysis) in 34 out of 41 cases, and only incorrectly predicting low activation in two cases. The regression models, on the other hand, tended to overestimate leg muscle activity for most children, while also underestimating activity in those with significant leg muscle activation.
Sensor relevance
In addition to the predictions produced by the models, the MRMR analysis provided valuable information about the contribution of each sensor to predictions. Importantly, sensor data was found to be most relevant to activity in muscles that they interacted more closely with. For instance, force sensors in the footrest produced data that was relevant to leg muscle activation, while sensors near the trunk (strap, armrest) produced data more correlated with trunk muscle activation. This helps to reinforce the conclusion that the sensor data contains information about muscle activation, and that the machine learning models are using this to create their predictions, rather than simply overfitting based on unrelated data. Knowledge of how sensors contribute to the models for each muscle can also guide future sensor placement and feature selection decisions.
Limitations
The predictions made by these models are based on test data gathered in the same session as the training data so, while the data used for testing had not been specifically seen by the model during training, it was relatively similar to training data. Thus, it is likely that at least some of the results are based on the model learning to recognize the sensor data unique to a particular child and making predictions consistent with muscle activation typical for that child. Until data can be collected across several sessions in which there are differences in muscle activation patterns and in sensor data collected, it will be difficult to tell how well the model is able to detect changes in muscle activation across time and across rocking sessions. Similarly, we cannot at this point quantify how well this model would generalize to other subjects who had not had the model trained on their data.
Future work
To enhance the generalizability and robustness of the current models, future work should focus on collecting additional data across a more diverse cohort of subjects and over extended periods. These expanded datasets will enable evaluation of the models’ accuracy on new data and extend their predictive capabilities to a broader range of scenarios.
A comprehensive analysis to determine the required levels of accuracy and reliability for practical use is also needed. This will entail systematically investigating the specific thresholds and criteria that will make the predictions clinically meaningful. Understanding these parameters will guide the refinement of the models to meet clinical needs.
Future investigations should also expand on the work done on correlations of different sensors with muscle activation to explore alternative types and locations for sensor placement, such as the back of the seat, to enhance the accuracy and precision of predictions. Further refinement of data features extracted for machine learning, and investigations of which model types are best suited to specific scenarios should also be pursued.
To translate these findings for clinical use, it will be necessary to continue to work with therapists to define the best measures to machine learning algorithms toward, and to develop tools to provide the collected data to therapists in ways that are, convenient, timely and useful.
Conclusion
This study demonstrates the potential use of sensor-augmented rocking chairs to predict muscle activation in pediatric SCI patients. Current models demonstrate that machine learning techniques can be used to extract information about muscle activation from inexpensive force and motion sensors embedded in a rocking chair. While questions remain about how well these results can scale across time and subjects, further research is warranted to refine and validate these models for a broader population of pediatric SCI patients. Ultimately, if models become accurate and reliable enough, the application of low-cost sensors and machine learning to various types of rehabilitation equipment may provide therapists with muscle activation data that will reduce the reliance on EMG to obtain this type of information. By exploring these avenues, future research can advance the efficacy and applicability of predictive models in clinical settings.
Footnotes
Acknowledgements
The authors would like to express gratitude to the children and families who participated in this study. Additionally, we would like to acknowledge the contributions of the research staff of the Kosair for Kids Center for Pediatric NeuroRecovery including Molly King, Research Manager; Lisa Clayton, Research Manager; Parth Parikh, Biomedical Engineer, the activity-based technicians at the Pediatric Neurorecovery clinic at Frazier Rehab Institute; Goutam Singh, PhD, Assistant Professor, Spalding University, and the Kentucky Spinal Cord Injury Research Center. ChatGPT was used for proofreading and for suggesting alternative phrasing.
Author contributions
JG and TR conceived the study. AB developed data collection protocols and IRB approval. JG collected and analysed data and drafted the manuscript. All authors reviewed and edited the manuscript, and approved the final version.
Declaration of conflicting interests
The author(s) declared the following potential conflicts of interest with respect to the research, authorship, and/or publication of this article: AB is the Volunteer President, NeuroRecovery Learning, Inc; Co-author text, Locomotor Training: Principles and Practice, Oxford University Press, 2011; Current grant funding: Craig H. Neilsen Foundation, Kentucky Spinal Cord and Head Injury Research Board, Kosair for Kids. AB and TR: UofL licenses medical devices: pediatric treadmill/body weight support system. JG has no potential conflicts of interest to declare.
Funding
The author(s) disclosed receipt of the following financial support for the research, authorship, and/or publication of this article: This work was supported by the National Science Foundation under Cooperative Agreement No. 1849213; Kosair for Kids; Todd Crawford Foundation to Cure Paralysis.
Guarantor
TR