
Abstract
Introduction
Accelerometry-based activity counting for measuring arm use is prone to overestimation due to non-functional movements. In this paper, we used an inertial measurement unit (IMU)-based gross movement (GM) score to quantify arm use.
Methods
In this two-part study, we first characterized the GM by comparing it to annotated video recordings of 5 hemiparetic patients and 10 control subjects performing a set of activities. In the second part, we tracked the arm use of 5 patients and 5 controls using two wrist-worn IMUs for 7 and 3 days, respectively. The IMU data was used to develop quantitative measures (total and relative arm use) and a visualization method for arm use.
Results
From the characterization study, we found that GM detects functional activities with 50–60% accuracy and eliminates non-functional activities with >90% accuracy. Continuous monitoring of arm use showed that the arm use was biased towards the dominant limb and less paretic limb for controls and patients, respectively.
Conclusions
The gross movement score has good specificity but low sensitivity in identifying functional activity. The at-home study showed that it is feasible to use two IMU-watches to monitor relative arm use and provided design considerations for improving the assessment method.
Keywords
Introduction
Impairment reduction following rehabilitation of hemiparetic patients often does not translate to an equivalent increase in functional arm use.1–4 This results in poor recovery in activity and participation levels of International Classification of Functioning, Disability and Health (ICF). 5 Studies have shown that monitoring real-world arm use and motivating patients through feedback can improve actual arm use. 6 The conventional method for tracking daily arm use is through descriptive diary entries by the patient/caregiver, structured questionnaires (e.g., Motor Activity Log (MAL) 7 ) or in-clinic observation of spontaneous arm use during selected activities (e.g., Actual Amount of Use Test- AAUT 8 ) However, these approaches have several limitations: (i) the questionnaires and diary logs have reporter bias and high variability in self-judgment of movements; 9 (ii) the tests administered in a clinic for a short duration do not necessarily measure arm use during activities of daily living (e.g., bilateral arm use test 10 ) and (iii) AAUT can only be administered once and cannot be used for longitudinal tracking of arm use. Therefore, there is a lack of an ecologically valid and objective method to quantify arm use in patients' homes. The increasing availability of low-cost wearable movement sensors and advancements in data analysis algorithms can be leveraged for carrying out quantitative assessment of arm use inside and outside the clinics. This would address the shortcomings of existing assessment approaches and can provide deeper insights into arm use behavior in natural settings.
Wearable sensors help in the continuous, uninterrupted, and objective measurement of arm movements in natural settings.11–14 Popular wearable sensors like inertial measurement units are attached to the forearm,15,16 upper arm,17,18 or fingers19,20 of the participant to record its linear acceleration and angular velocity. The recorded sensor data is generated from both functional movements like activities of daily living, and non-functional movements like arm swing during ambulation. Measurement of activity level improvements in upper limb neurorehabilitation should focus on functional arm use or goal-directed movement of the upper limb. Thus, a necessary first step in the appropriate analysis of this sensor data is to detect periods of functional movements, which can then be used for further detailed analysis. Any qualitative analysis of the sensor data (e.g., estimates of arm range of motion, velocity, duration etc.) without considering the functional utility of a movement will result in overestimating arm use through the inclusion of non-functional movements (e.g., walking). Accelerometery-based activity counts are currently the most popular method for measuring arm use.21–25 Activity counts detect all types of movements failing to isolate functional movements from non-functional ones due to their high sensitivity and low specificity.26,27 Activity counts assume that the effect of ambulation is negligible because most patients with upper limb impairments due to neurological conditions have accompanying lower limb, posture, and balance impairments. This assumption can lead to overestimation of arm use, especially in patients with good mobility.28–30 Some accelerometry based data-driven approaches using machine learning algorithms to classify functional or non-functional movements yield higher classification accuracy but are restricted to specific tasks used in the laboratory setting.31–33 Other methods to accurately measure arm use require multiple sensors which can lower patient compliance, or optical tracking which are impractical for the natural settings. Hence, there is a need for wearable devices with high sensitivity and specificity to detect functional and non-functional movements, along with good generalisability to estimate arm use in natural settings using minimum number of sensors.
A simple, elegant, and general algorithm to detect the upper limb's functional use using single inertial measurement unit (IMU) on the wrist was proposed by Leuenberger et al.
15
Previous studies have shown that most functional movements like object manipulation on a table-top, grasping, and moving objects around happen in the sagittal plane at around the waist and above.
34
On the other hand, the forearm's orientation is perpendicular to the ground during non-functional movements like arm swing during ambulation.
28
A single wrist-worn IMU can estimate the pitch and yaw of the forearm in an earth-fixed reference frame. Leuenberger et al. developed a binary score – gross movement score – which is computed as 1 for a 2 s long window if the total change in forearm yaw and pitch angles is more than 30
In this paper, we present a two-part study on the quantification of arm use of hemiparetic patients in the natural setting using a pair of IMU-based wearable sensors and the gross movement score algorithm. In the first part, we characterized the gross movement score algorithm by investigating the types of functional movements detected by this algorithm. For this, two human assessors identified functional movements from the video recordings of a group of healthy and hemiparetic participants performing a set of activities of daily living. The functional movements identified by the human assessors were compared to the gross movement score from the IMU sensors. In the second part, we explored the feasibility of using two wrist-worn IMUs for tracking relative arm use at home in hemiparetic patients through a week-long pilot study.
Methods
The study aimed to develop, characterize, and evaluate the feasibility of IMU-based arm use assessment of hemiparetic patients in the natural setting using the gross movement score algorithm. The institutional review board of Christian Medical College Vellore (CMC) approved this study. The study has two parts: (a) an in-clinic characterization of the gross movement score with a video recording of the patients performing various activities of daily living while wearing the IMU sensors (IRB Min. No. 12321 dated 30.10.2019), and (b) pilot feasibility evaluation of seven-day monitoring of arm use at home using IMUs (CTRI/2018/09/015648, IRB Min. No. 11,303 dated 18.04.2018).

IMU watch.

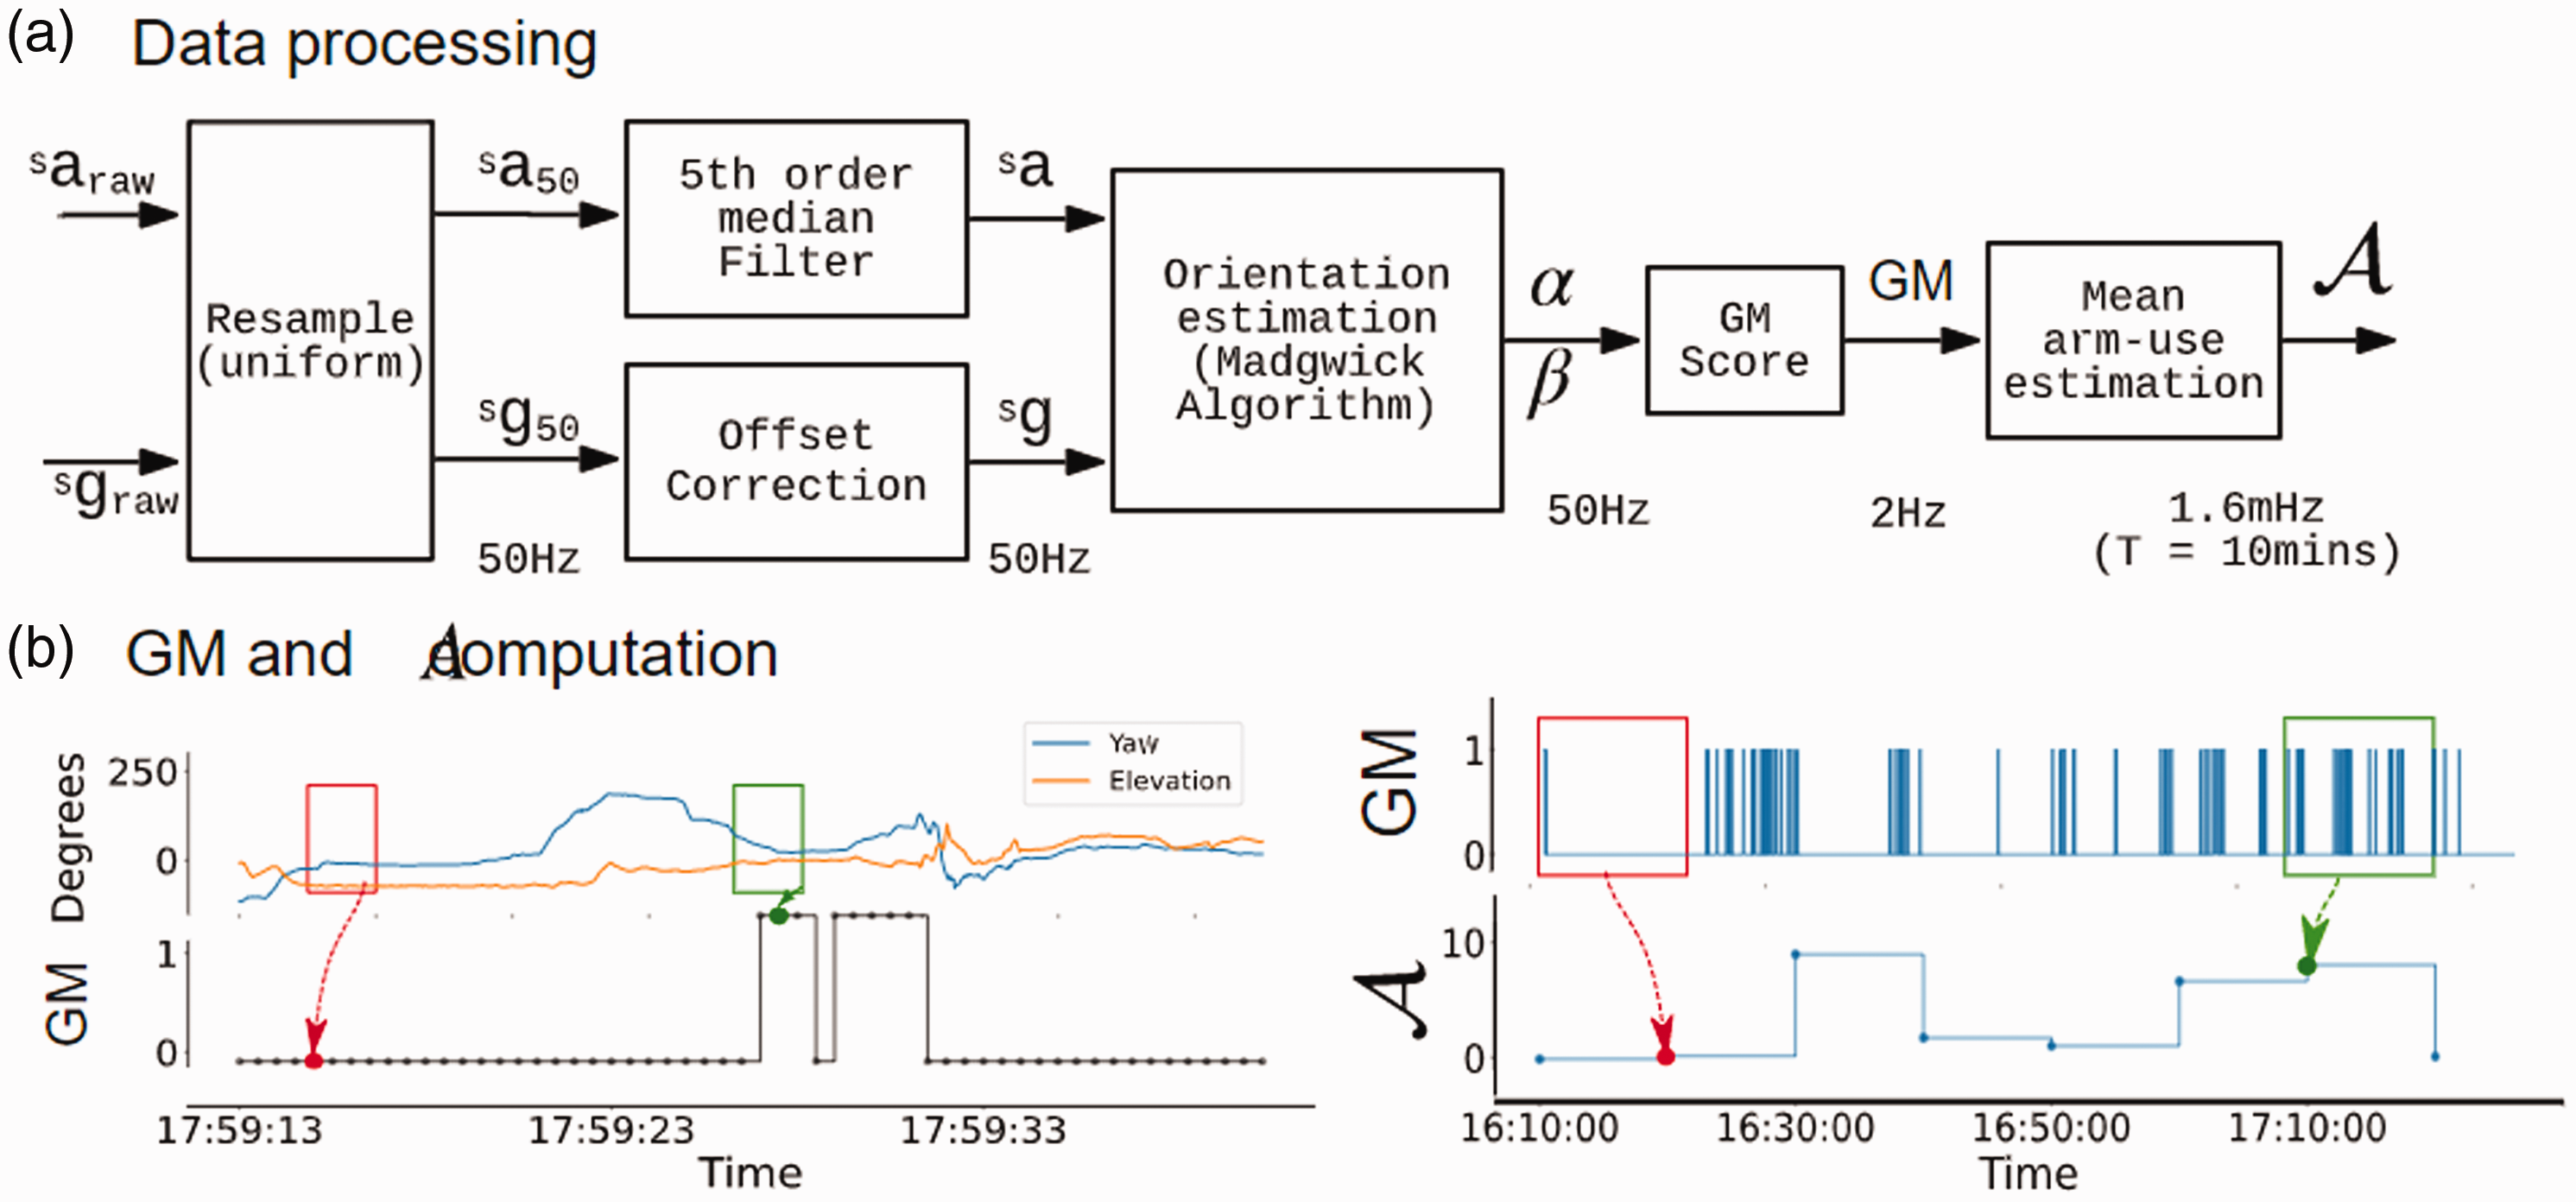
Data processing pipeline, and demonstration of the computation of gross movement score (GM) and mean arm-use
A scatterplot between the mean arm use time-series of the two arms over an observation period (e.g., 12 hours of data from a day) was used to visualize relative arm use as shown in the left panel of Figure 3. The x-axis

The left panel shows the scatter plot of the mean arm use of the two arms; the mean arm use of the right hand is plot along X-axis, and the left hand long the Y-axis. The first quadrant of the plot is partitioned into sectors of width 5° (ϕ) and the median value of the sector is calculated as ρ(ϕ). The points in sector ϕ = 35° are shown in violet. The grey contours in the background refer to the kernel density estimate of all points on the graph. The right panel shows the plot of ρ(ϕ) against ϕ. ρ(ϕ = 35°) is computed as the median distance of points from the origin (marked in red).
To visualize the intensity of arm use

The area under the curve

Part 1: Characterization of the gross movement score
This is an in-clinic study designed to characterize the gross movement score algorithm by investigating the types of functional movements detected by this algorithm.
To characterize the quality of the detection of different types of functional activities identified by the gross movement score algorithm, the annotators further classified functional activities into three categories. The first category, called the hand activities, consists of functional activities primarily carried out by the hand, including typing, writing, etc., where the arm is mostly maintaining a posture. The second category, called arm + hand activities, includes folding a towel, opening a water bottle, drinking from a cup, etc. These activities involve both gross arm movements and fine finger manipulations. The final category includes non-functional or no activity like arm-swing while walking, resting one arm on the table while drinking water from a cup, etc. A detailed description of the three categories is given in the supplementary material. We analyzed the overall and category-wise agreement between
where,

Part 2: in-home arm use assessment of hemiparetic patients
This is a home-based study designed to evaluate the feasibility of tracking arm use for up to 7 days in patients with hemiparesis.
Results
Part 1: Characterization of gross movement score
Five patients with mild-to-moderate hemiparesis undergoing therapy at CMC Vellore (Table 1) and 10 healthy right-handed controls participated in the study. The average age of hemiparetic patients was 35.4
Demographic details of hemiparetic patients in the in-clinic study.

TBI: traumatic brain injury; CVA: cerebrovascular accident.
Figure 4 shows four activities, the time plots of their corresponding

Video frames with FA (orange) and GM (blue) score during activity execution. The red vertical lines correspond to the time at which the frame was captured for (a) writing, (b) folding a towel, (c) walking, (d) Eat from a bowl using spoon activity. The GM identifies gross movements of the arm while removing non-functional movements.
The FA score had good consistency between and within the two assessors, with an inter-and intra-rater mean AC1 agreement of 0.91 ± 0.02 and 0.94 ± 0.02, respectively.
For control subjects, the median accuracy of the
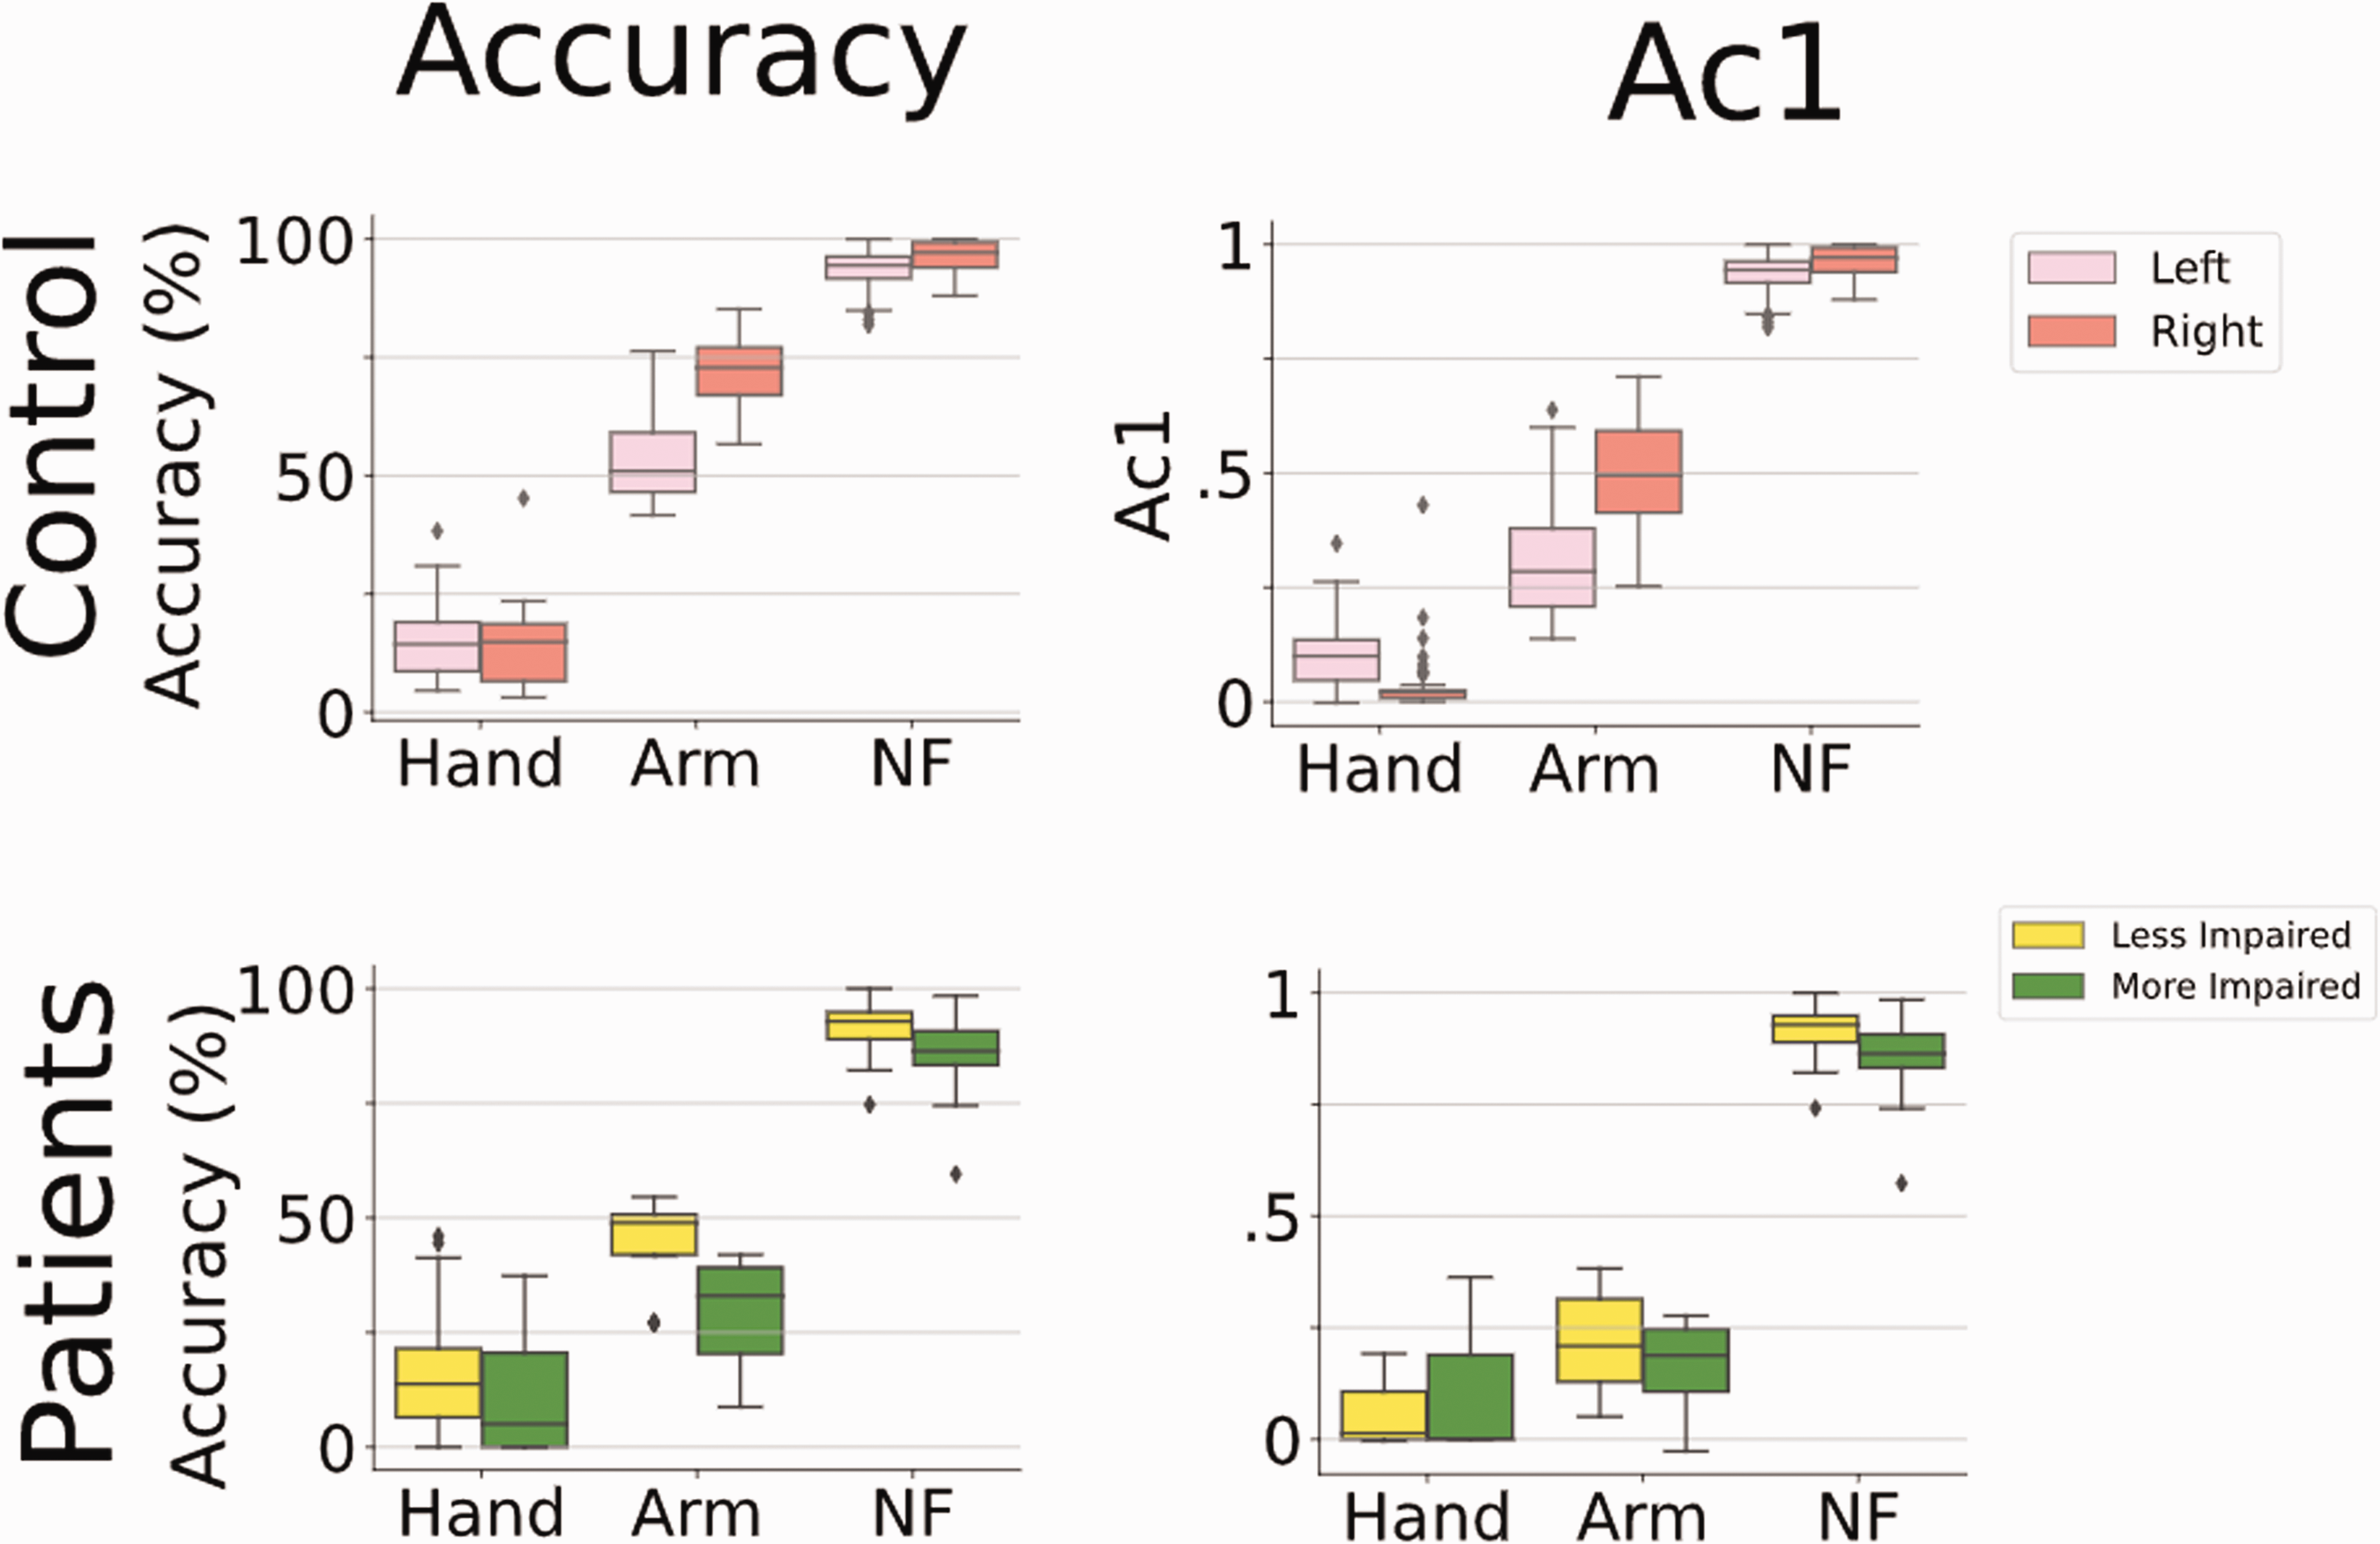
Agreement analysis (Accuracy, and Gwet's AC1 scores) of GM with FA score for all subjects. In each plot, the y-axis represents the agreement score, while the x-axis represents the different categories of activity. (NF refers to non-functional activity).
For hemiparetic patients, the median accuracy for the
Part 2: In-home arm use assessment of hemiparetic patients
Five patients with hemiparesis due to stroke and five control subjects participated in this study. The patient demographics are given in Table 2. All patients were at least 3 months post-stroke, mild-to-moderately impaired as measured by the FMA-UE, with MAL scores that appeared to be related to their impairment level. For the AAUT, patients could complete all activities in the no-choice condition, but all patients except P1 showed some level of arm non-use during the spontaneous condition.
Demographic details of hemiparetic patients in the in-home study.

aNumber of additional incomplete days of recording is given in the brackets.
MMSE: Mini-mental State Examination; FMA-UE: Fugl-Meyer Assessment – Upper Extremity; MAL: Motor Activity Log; AAUT: Actual Amount of Use Test; RAU: Relative Arm use; AUC: Area Under Curve.
All patients, except P2, completed 7 days of data recording at home. On average, subjects wore the watch for about 11.91 ± 3.96 hours each day. If there was a technical issue with the watches (e.g., improper time synchronization between the watches due to loss of power), patients informed the investigators. The watches were replaced on the same day. In such cases, the days with incomplete recordings were not considered for analysis, and an additional day of recording was performed to complete 7 days of recording, when possible.
Figure 6 shows the time-series plot of the mean arm use of the left (red) and right (blue) arms for a single day for two subjects. Patient P1 (Figure 6(a)) who showed high overall arm use for the two arms had high FMA-UE, high MAL, and low AAUT scores. For P1, despite the non-dominant side being more affected, his overall arm use was comparable to the dominant arm. In contrast, for patient P4, the overall arm use of the more-affected dominant right arm was much lower than the other arm; P4 had lower FMA-UE and MAL and higher AAUT. We also observed an overall reduction in the mean arm use graphs in P4 compared to P1.

Change in arm use during a day. The red and blue colors represent left and right arm-use, respectively (a) Data from P1 (left impaired) (b) Data from P4 (right impaired). A near-normal overall activity with balanced use of both arms is seen in P1. The total activity level is less for P4 with relatively more use of the less-affected side. (RAU: Relative arm use, AUC: Area under the curve which represents total arm use.).
Figure 7(a) to (f) depict the arm use scatterplots for healthy controls and patients. Figure 7(a) shows the pooled scatterplot of arm use data for the entire recording duration from all five healthy controls. Figure 7(b) to (f) shows the scatterplot for the five patients individually, where each plot displays the entire data collected from a patient during the 5 to 7-day in-home assessment. In these plots, the background (in blue) is the kernel density estimate of the controls' scatterplot in Figure 7(a), which serves as an indicator of the expected normative behavior. This allows one to quickly identify deviations from normal arm use behavior in a patient's data. An asymmetry/bias in arm use results in points clustering towards the x-axis (less affected side). A reduction in overall arm use leads to higher density clusters closer to the origin.

The graph shows the distribution of arm-use between the left and right arm and the ρ(ϕ) for (a) control subjects and (b-f) patients. The control data is shown as background for reference in the scatterplots. Note that the kernel density background is mirrored about the x = y line for patients with left-hemiparesis. (g) Box plot of relative arm use and total arm-use of patients and controls.
Figure 7(a) to (f) also display the corresponding
Discussion
The current work presented: (a) a characterization study to examine the nature of the information gathered by the gross movement score, and (b) the feasibility of using two wearable IMUs to track relative arm use in hemiparetic patients at home. Unlike previous work that had used acceleration thresholding 24 or activity counting, 29 the current work used the gross movement score algorithm to track functional arm use. The study provides an independent characterization of the gross movement score algorithm proposed by Leuenberger et al., 15 identified issues in using wearable technology to track arm use at home, and proposed new analysis and visualization methods to assess relative arm use.
What does the gross movement score measure?
The
For control subjects, the accuracy of It uses a velocity threshold of 15°/s to detect movements. Hence very slow arm movements or postures are not detected, e.g., arm postures used for object stabilization or supporting the body, very slow movements of patients with high disability (Figure 4(d)), etc. Some of the erroneous detections by
The
Pointers for improving arm use detection
Though the gross movement score rejects non-functional movements and detects many gross functional movements, it performs poorly in detecting fine motor activities. There are some possible improvements to the gross movement score algorithm and other possible approaches which can address some of its shortcomings:
The functional range can be increased from ±30° to between –30° to +90°, provided the watches are designed to ensure patients wear them with the correct orientation. This can improve the detection of activities like drinking water, turning on a switch, etc. The threshold for angular velocity (15°/s) can be lowered for patients with lower FMA scores. However, this should be done with care as it could lead to overestimation of arm use in high functioning patients and compromise its superior specificity. Dedicated algorithms could be used for identifying and eliminating periods of non-functional movements like ambulation and tremor. The activity counting and gross movement score algorithms could be combined to improve the overall accuracy of arm use detection. For instance, activity counting could be used to detect arm use when the arm is in the functional range of gross movement score algorithm. The use of patient-specific parameters (e.g., range, velocity, etc.) for the algorithms can improve performance.
We suspect that the aforementioned changes will only lead to moderate gains in the overall detection accuracy for arm use, which is likely to be lower than detection performances achieved in other fields employing cutting-edge machine learning approaches.42,43 Recent work using supervised machine learning algorithms, have shown promising results in detecting arm use.27,31–33 Although the performance of these machine learning approaches in patients are not as good as those in healthy subjects, they still perform better than activity counting or the gross movement score algorithms. Thus, these approaches are likely to gain traction in the coming years with an increasing focus on patient-specific models. The development and use of such individualized models have several challenges that need to be overcome, including (i) generating enough annotated training dataset for each patient, (ii) including sufficient variety of ADLs for training machine learning models, and (iii) the choice of appropriate algorithm for detecting arm use and different types of activities.
Measuring, visualizing, and interpreting relative arm use measures
The arm use scatterplot approach for visualizing relative arm use of the two upper limbs has a similar flavor to the one proposed by Bailey et al.
29
The scatterplot provides a measure of the overall relative arm use in a given observation period devoid of temporal information. However, care must be taken when trying to infer bilateral arm use from this plot. We define bilateral arm use as the simultaneous, coordinated use of the two upper limbs to accomplish either a common goal or independent goals.
44
Thus, bilateral arm use requires both arms' gross movement scores to be 1, simultaneously. For example, a point
The scatterplots and their accompanying
Patients had lower total arm use than healthy controls, similar to the observations made in the Bailey et al. study.
29
One possible contributor to the difference in motor ability and actual arm use is a behavioral phenomenon called learned non-use.45,46 A common manifestation of learned non-use is through the over-use of the less-affected arm. Patients P3, P4, and P5 showed a bias towards the less-affected arm as seen in the scatterplot and their corresponding
In addition to measures and visualization of overall arm use and its symmetry, we firmly believe that temporal plots of arm use, as shown in Figure 6, are essential for understanding how the patients incorporate their upper limbs in daily life over time. Such plots can help identify periods of high and low upper limb usage and provide clues about the nature of arm use, e.g., the arm use pattern for eating during usual mealtimes. Most previous studies have removed temporal dependence when obtaining an overall measure of arm use 16 and visualizing arm use data.16,29
Practical considerations for tracking arm use at home
The current study identified several areas to improve the feasibility of using IMU-watches at home for tracking arm use. The following are some of the design considerations identified based on the feedback from the study participants:
Limitations
The gross movement score detects functional movements with approximately 50%–60% accuracy while it is robust to non-functional movements. The characterization study revealed three main limitations of gross movement score in its current form. Firstly, it is insensitive to activities involving only hand movements. This issue can be solved by either increasing the sensitivity of the algorithm or by using additional sensors like IMUs on fingers and electrophysiological recordings. The former method may lead to high false positives, while the latter might lower patient compliance. Secondly, the
One limitation of this in-home feasibility study is the small sample size of patients used for tracking arm behavior during daily life which does not allow us to draw general conclusions from the results. However, the study did serve its purpose of evaluating the feasibility of home-based tracking and has provided important technical modifications required for conducting a more extensive study for assessing arm use. Finally, we note that the measures and visualization methods proposed in the study are preliminary ideas, and the current work did not carry out a direct comparison with existing methods.16,24,25 All these will be the focus of our future work in developing objective, robust, and practical tools for assessing upper limb movement behavior in natural settings.
Conclusion
The current work proposed an approach for relative arm use assessment based on detecting functional movements different from the common activity counting approach. The characterization study provides a qualitative and quantitative analysis of functional movements identified by
Footnotes
Declaration of conflicting interests
The author(s) declared the following potential conflicts of interest with respect to the research, authorship, and/or publication of this article: Dr. Varadhan SKM has a financial interest in Kriya Neurotechnologies Private Limited, a company that makes IMU-based Neurorehabilitation devices. The study was not funded by the company. The company had no role in the study design, data collection, or analysis. All other authors declare that there is no conflict of interest.
Funding
The author(s) disclosed receipt of the following financial support for the research, authorship and/or publication of this article: This work was supported by the Fluid Research Grant from CMC Vellore (grant number: IRB Min. No 11303), and partly by the National Hub for Healthcare Instrumentation Development, Anna University (Grant number: TDP/BDTD/11/2018/General).
Guarantor
SB.
Contributorship
AD, SR, SK, AK, HPM, VK, SB designed the study. AD and SB designed and developed the IMU-watch. AD, SR, SG, SJA performed the data collection and analysis for the in-home study. AD, SR, SG performed the data collection and analysis of the in-clinic gross movement score characterization study. AD, SR, SK, HPM, VK, and SB interpreted the results. AD and SB wrote the manuscript with all authors reading and approving the manuscript.
Acknowledgements
We thank Dr AT Prabhakar for his critical feedback about the work. We also acknowledge P Jayashree and K Mahesh for technical assistance.
Supplemental material
Supplemental material for this article is available online.