
Abstract
Abstract
Introduction
The benefits of physical activity for manual wheelchair users are well-known. The purpose of this study was to validate actigraphy to objectively measure physical activity intensity among manual wheelchair users.
Method
An experimental design was used. Adult manual wheelchair users wore a GT3X actigraph on their non-dominant arm while completing eight physical activities of low (reading), moderate (propelling -- flat) and high (propelling -- steep ramp) intensity. Heart rate and rating of perceived exertion were collected at the end of each physical activity. Distribution of data were examined and used to determine the type of repeated measures (parametric vs. non-parametric). A categorical principal component analysis was performed to determine the amount of variability explained by actigraphy, heart rate and rating of perceived exertion. Activity count cut-points were estimated using bootstrapping methods.
Results
Twenty-eight manual wheelchair users completed the study. Actigraphy, heart rate and rating of perceived exertion co-varied as physical activity intensity changed. Activity counts for low-intensity and medium-intensity physical activities were estimated to be 0 to 45 and 45 to 100 activity counts per second, respectively. Activity counts' ranges for high-intensity physical activities were not clear.
Conclusion
Combining actigraphy and rating of perceived exertion could be an easy and reliable method to measure the intensity of real-world activities. Further research is needed confirm cut-points for physical activity intensity.
Background
The health benefits of physical activity (PA; e.g., reduced risk of chronic disease, increased pulmonary function, increased muscle endurance, reduced anxiety and depression, improved socialization) are well established for all populations, including individuals who use wheelchairs.1–3 PA is arguably even more important for manual wheelchair (MWC) users, who are at risk of the negative impact of prolonged sitting. 3 It is recommended that MWC users engage in aerobic PAs (minimum of 20 to 30 min of moderate intensity 2× per week) and strengthening PAs (resistance training 2× per week), depending on diagnosis, 4 but even small increases in PA can reduce cardiovascular risk and have health benefits. 5 However, 38% of adult MWC users engaged in no moderate intensity PA, 6 and 92% of MWC users over the age of 60 reported no PA of any kind. 7
Valid measures of PA are needed to determine how MWC users are currently meeting the PA guidelines, to create individualized PA programmes and to determine the effectiveness and adherence to PA interventions. While self-reports of PA have been validated for use among MWC users,8–10 subjective outcomes are prone to social desirability bias and recall problems.11,12 Moreover, since MWC users often engage in low-intensity PA through activities of daily living, accuracy of PA recall may be further limited. 13
In recent years, activity monitors (e.g., accelerometers, data loggers) have become an increasingly common method to objectively measure MWC movement and PA. A systematic review confirmed that various activity monitors could accurately assess movement of MWCs users, but they were less valid for predicting energy expenditure. Fifteen studies were included in the review, and PA was objectively quantified among MWC users using Actigraph GT3X (n = 6 studies), SenseWear (n = 3 studies), and Polar Heart Rate Monitors (n = 3 studies). 14 Actigraph activity monitors (i.e., GT3X) represent one type of commercially available accelerometers that are small, lightweight and waterproof, which do not impede bodily movement and can easily be worn by MWC users during all types of PA.6,15–17 Tri-axial data collected from actigraphs can be converted to activity counts through a process called actigraphy, which results in an interpretable and objective measure of PA.
Seminal articles using actigraphy to objectively measure PA in MWC users with spinal cord injury (SCI) documented moderate correlations (r) between activity counts and three MWC propulsion speeds (r =0.52–0.66)18 and self-reported PA intensity (r = 0.60). 15 Activity counts during active tasks were also significantly different from activity counts during inactive tasks (p = 0.003), suggesting that actigraphs may be able to discern between intensity of movement. 15 More recently, two studies reported that energy expenditure estimates from activity counts (from GT3X actigraphs) were highly correlated with criterion energy expenditures for housework activities, arm-ergometry and propulsion (r = 0.86)16 and deskwork (r = 0.93). 17
While actigraphy has been shown to accurately estimate PA intensity among ambulatory individuals with multiple sclerosis, 19 there is limited documentation discriminating between low, moderate and high intensity during variable PAs among MWC users with various diagnoses. A recent study by Learmonth et al. 20 found a strong linear association between actigraphy and oxygen consumption during steady-state MWC propulsion on a treadmill. Cut-points’ estimates, defined as the value of activity counts per second (AC/s) associated with various PA intensities, for moderate to vigorous PA were suggested based on correlations between actigraphy and energy expenditure during MWC propulsion. However, all activities were performed on a treadmill, thus correlations and cut-points may not be representative of PA tasks that require MWC propulsion in the real world. 20 Establishing normative data for the use of actigraphy to discern PA intensity will contribute to a better understanding of PA among MWC users in their natural environments. Additionally, further validation of actigraphy for use with MWC users will help to establish feasibility for using actigraphs in future trials.
The purpose of this study was to further validate actigraphy for objectively measuring PA in MWC users in the real world. The specific objectives were to evaluate the hypotheses that: (1) mean levels of heart rate (HR), perceived exertion and activity counts (i.e., actigraphy) would co-vary according to the classification of intensity for each activity (i.e., low-intensity, moderate-intensity and high-intensity); and (2) compared to HR and perceived exertion, activity counts (i.e., actigraphy) would have better co-variation with the classification of PA intensity.
Methods
Research design and setting
An experimental design was completed at a rehabilitation research centre in Quebec, Canada. Ethical approval for this study was obtained from the Institut de réadaptation en déficience physique du Québec and all subjects provided informed consent.
Participants
Participants were recruited from an existing research database (i.e., individuals who previously gave their consent to be contacted for research were contacted by a study investigator), and by word-of-mouth (e.g., posters, snowball effect). To be included in the study participants had to: be 18 years and older; live in the community; use a MWC for at least one year; and be able to self-propel their own MWC for at least 5 min. Individuals who propelled their MWC using their feet or who had any medical conditions preventing them from doing PA (e.g., ALS) were excluded. Individuals were also excluded if they were not ready to participate in PA for health reasons (i.e., presence of a medical condition that could be aggravated with PA), as screened for using the PAR-Q+. 21
Procedures
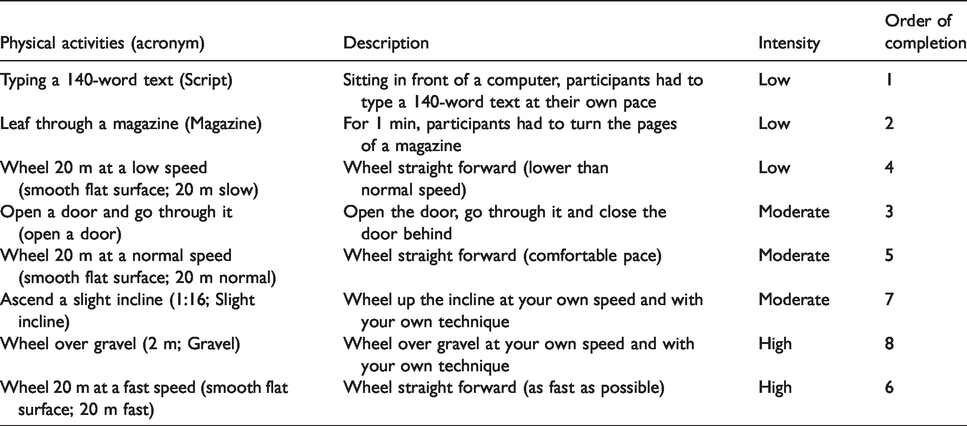
All participants performed eight consecutive PAs using their own MWC for one 90-min session. PA intensities (i.e., low, moderate and high intensity) for the eight tasks were classified a priori based on previous classifications and energy expenditure estimates for similar activities.16,22 The activities selected had a wide-range of intensities and were representative of typical activities performed by MWC users. Participants completed PAs in order from low to high intensity, except opening a door and wheeling at a fast speed for convenience of location of testing. The recruitment of experienced MWC users reduced the likelihood of a learning effect, but fatigue may have impacted the results, especially among participants where fatigue is a common issue (e.g., multiple sclerosis). The PAs classified as low intensity were chosen to represent tasks that do not require a great deal of movement of the MWC, but that require movement of the arms. The remainder of the PAs was chosen to represent various manoeuvres that are commonly performed when using a MWC in the real world. The PAs and estimated intensities are described in Table 1.
Description of physical activities with the classification of intensity for each activity.
Outcome measures
Two testers, who were trained in the study protocol administration by a study investigator in one 2-h session, completed all data collection procedures. Participants were screened for inclusion using the PAR-Q+ to ensure no contraindications to PA. 21 Sociodemographic information was collected (i.e., age, sex, previous MWC experience, annual household income and education level).
Actigraphy: Objective PA was measured using a tri-axial accelerometry-based activity monitor (Actigraph GT3X-BT, Actigraph Corp, Pensicola, FL), which is a small (4.6 cm × 3.3 cm × 1.5 cm), lightweight (19 g) device that can be worn on the arm and does not impede arm movements (https://www.actigraphcorp.com/). The actigraph GT3X-BT contains a microelectromechanical system-based accelerometer with a minimal sensitivity of 4 mG/least significant bit and a dynamic range of ± 8 G. Movement information is collected along three orthogonal axes (X, Y and Z). Information about motion direction and speed are integrated to produce an electrical current with variable magnitude and duration (https://www.actigraphcorp.com/).
Electrical current data are stored in the monitor as activity counts, and converted from analogue to digital output where each filtered sample is multiplied by the sample window of 0.1 s to achieve a resolution of 0.001664 g/count (1 g = 1 unit of gravity).15,23 As explained previously by Tryon,
23
this number was obtained through an analogue to digital conversion inside the GT3X-BT that transforms the ‘g’ into levels of acceleration, resulting in the resolution of 0.00164 g/count.
23
Therefore, each activity counts represents 0.01664 G/s (G = 9.81 m/s2). The resulting vector from the three axes, called the vector magnitude, can be mathematically defined as

For the purpose of this study, only the vector magnitude data were analysed to standardize movement characteristics of each participant. One vector magnitude therefore represents the vector summation of activity counts in three dimensions. Because data were collected over a period of time in seconds, the VM was calculated in terms of Activity counts per second.
Participants wore an actigraph between the elbow and shoulder on their non-dominant arm. 17 The non-dominant arm was selected, as wearing the actigraph on the dominant arm may result in an overestimation of PA due to extraneous arm movement. 16 Activity counts were sampled at a frequency of 30 Hz, meaning that the actigraph recorded data at every 1/30th of a second. The sampling unit (epochs) was then converted to 1 s to facilitate data analysis and to ensure enough sensitivity for low-intensity activities. In previous studies with MWC users, concurrent validity between actigraph and self-reported PA was established 15 and instrument reliability of six monitors was high (coefficient of determination, r2 = 0.96), 6 meaning that 96% of the variation was explained by the actigraphs.
Heart rate: Participants wore a Polar heart monitoring system (Polar RS800CX, Polar Electro, Finland) during testing. Participants secured the HR monitor using a chest strap, and one of the testers wore the watch on their wrist to ease the collection of HR at the end of each activity. HR (beats per minute) was recorded at the end of each of the eight activities. The Polar RS800CX HR monitoring system has been validated for discriminating between variable PA intensities 24 and has been successfully used to capture HR data in MWC users. 25
Rating of perceived exertion (RPE): RPE was assessed using a modified Borg scale of perceived exertion. 26 Participants rated their perceived level of perceived exertion at the end of each activity on a scale from 1 to 10, where 1 corresponded with ‘no effort at all’ and 10 corresponded with ‘maximal exertion’. The potential for the use of Borg’s RPE scale to assess and monitor daily wheelchair propulsion intensity in individuals with SCI has been documented. 26
Data analysis
Descriptive statistics were calculated for participant characteristics and sociodemographic information (i.e., mean (SD) for continuous variables, frequency (%) for categorical variables). HR and RPE for each task were recorded in Microsoft Excel 2011 (Microsoft Corporation, 2010). Raw data from the actigraphs were downloaded to Actilife proprietary software where data were filtered by task and time. These data were then exported to the statistical software SPSS (25.0.0.1) and R (3.5.0).
To test the first hypothesis, distributions were first examined with the DISTFIT procedure created for SPSS. The best fit distributions were normal for activity counts (.081 ≤ p ≤ .977) and HR (.231 ≤ p ≤ .993) for all eight PAs, and Poisson for RPE (.276 ≤ p ≤ .662) for seven activities. No theoretical distribution was found for RPE while reading a magazine. Even though the shapes of distribution appeared relatively constant across activities, the standard deviations differ considerably. For this reason, the differences in performance (activity counts, HR or RPE) across activities were tested with a non-parametric repeated measures ANOVA (nparLD package, R software), which allowed a change in shape or variance across conditions. According to Noguchi et al., this analysis, designed specifically for ordinal data, is robust with outliers, makes no assumption about the covariance structure between the repeated measures and accounts for missing data without a need to impute. 27 Instead of F ratio, nparLG calculates ANOVA-type statistics (ATS) with only one degree of freedom (df). Activity counts were further investigated with a visual inspection of a scatterplot of all individual data according to the eight activities. For each activity, the normative range (80% confidence interval) of individual data was estimated with bootstrapped confidence intervals of the boundaries of this normative range. p values were calculated with statistical significance set at α = 0.05.
Hypothesis 1 examines the association between the classification of intensities with either the activity count, the HR or the RPE by the way of differences between means. This does not allow a direct comparison between these three last variables. What makes a difference in means in activity counts is not necessarily what makes differences in means of HR or RPE; thus, a factor analysis was required. Consequently, the second hypothesis was tested with a categorical principal component analysis (SPSS, proc CATPCA). 28 While a simple correlation coefficient assesses the combined association of all factors, this analysis is apt to check if the association covers all factors individually. Instead of a classical principal component analysis, this procedure was required due to the use of ordinal data (i.e., classification of PA intensity). Furthermore, the CATPCA does not require a linear relationship between the variables. The classification of PA intensity, activity count, HR and RPE were the only dependent variables included in the CATPCA.
Results
As detailed in Table 2, the 28 MWC users included an equal proportion of women and men with averages of 51.3 years of age and 16.9 years of experience using a MWC. For one participant, the actigraph did not capture enough movement information due to wheeling at a very slow pace. There were problems with collecting HR data for two participants. Five participants declined to attempt the gravel activity.
Personal and sociodemographic description of the 28 participants.

MWC: manual wheelchair; SD: standard deviation; MS: multiple sclerosis; PD: Parkinson’s disease.
Table 3 displays the descriptive statistics for each dependant variable (i.e., activity count, HR and RPE) according to the eight PAs. For activity counts, the nparLD analysis indicated an increase of activity count according to the classification of intensity (ATS = 146.4, df = 5.089, p < .00001). However, no statistical differences were found between 20 m slow, Open a door, and 20 m normal, or between Slight incline and Gravel (see Table 4 for post hoc comparisons, see Figure 2).
Activity counts, heart rate, and RPE fluctuations according to the intensity of the activity.

HR: heart rate; RPE: rating of perceived exertion.
Post hoc comparison.

AC: activity counts; HR: heart rate; RPE: rating of perceived exertion; DV: Dependent variable.
HR was also sensitive to differences in intensities (ATS = 44.33, df = 4.145, p < .00001), with two incoherencies: (1) 20 m normal was significantly smaller than Open a door and (2) Gravel was significantly smaller than Slight incline while the reverse was expected (Table 4 should not include a > symbol).
RPE was similarly sensitive to differences in intensities (ATS = 42.43, df = 4.066, p < .00001), but also showed two incoherencies: (1) magazine was significantly smaller than Script and (2) Gravel was significantly smaller than Slight incline. The 20 m fast activity was also significantly smaller than Slight incline, which was the peak response for RPE.
Activity count was the only variable that approached a monotonous increase with the classification of PA intensity. Post hoc findings are described below.
Figure 1 depicts a single testing session for one participant. Each peak represents the amount of PA (intensity) for one epoch. The unit to measure PA with the actigraphs is AC/s.

Example of peaks activity counts over time during one testing session recorded by the actigraph worn on the arm.
Figure 2 depicts mean activity counts during each task for each participant. Contrary to the classification of PA (see Table 1), 20 m slow appeared as a moderate intensity and Slight incline as a high activity. According to these data, low-intensity PAs ranged from 0 to 45 AC/s, moderate-intensity PAs ranged from 46 to 100 AC/s, and high-intensity PAs were estimated to be greater than 100 AC/s. The continuous line under the dots indicates what may be considered as grossly normative data (80% confidence intervals of individual data). In order to check the stability of these boundaries, the confidence intervals were bootstrapped (resampling N = 1000). This procedure estimated a 95% confidence interval for each boundary of the 80% confidence interval. As depicted by the dotted lines, the higher boundaries of the more intense activities were uncertain, while the lower boundaries were more stable.

Representation of participants’ mean activity counts per second (solid black line) for each task. Each point on the graph represents one participant, except darker points indicate that multiple participants had the same value for activity counts. The vertical lines depict the estimated cut-points of PA intensity. The continuous lines represent 80% confidence intervals of individual scores for each activity. The dotted lines indicate the bootstrapped 95% confidence intervals of the boundaries of the 80% confidence intervals.
Once it was established that the means of the three measures co-varied with the classification of intensities, hypothesis 2 aimed to determine if the differences in means were caused by the same factors. The CATPCA procedures revealed that two factors explained 87% of the variance, respectively, 67% and 20%. Figure 3 shows the graphical representation of the association between classification of PAs and each of the three dependent variables (i.e., activity count, HR, RPE).
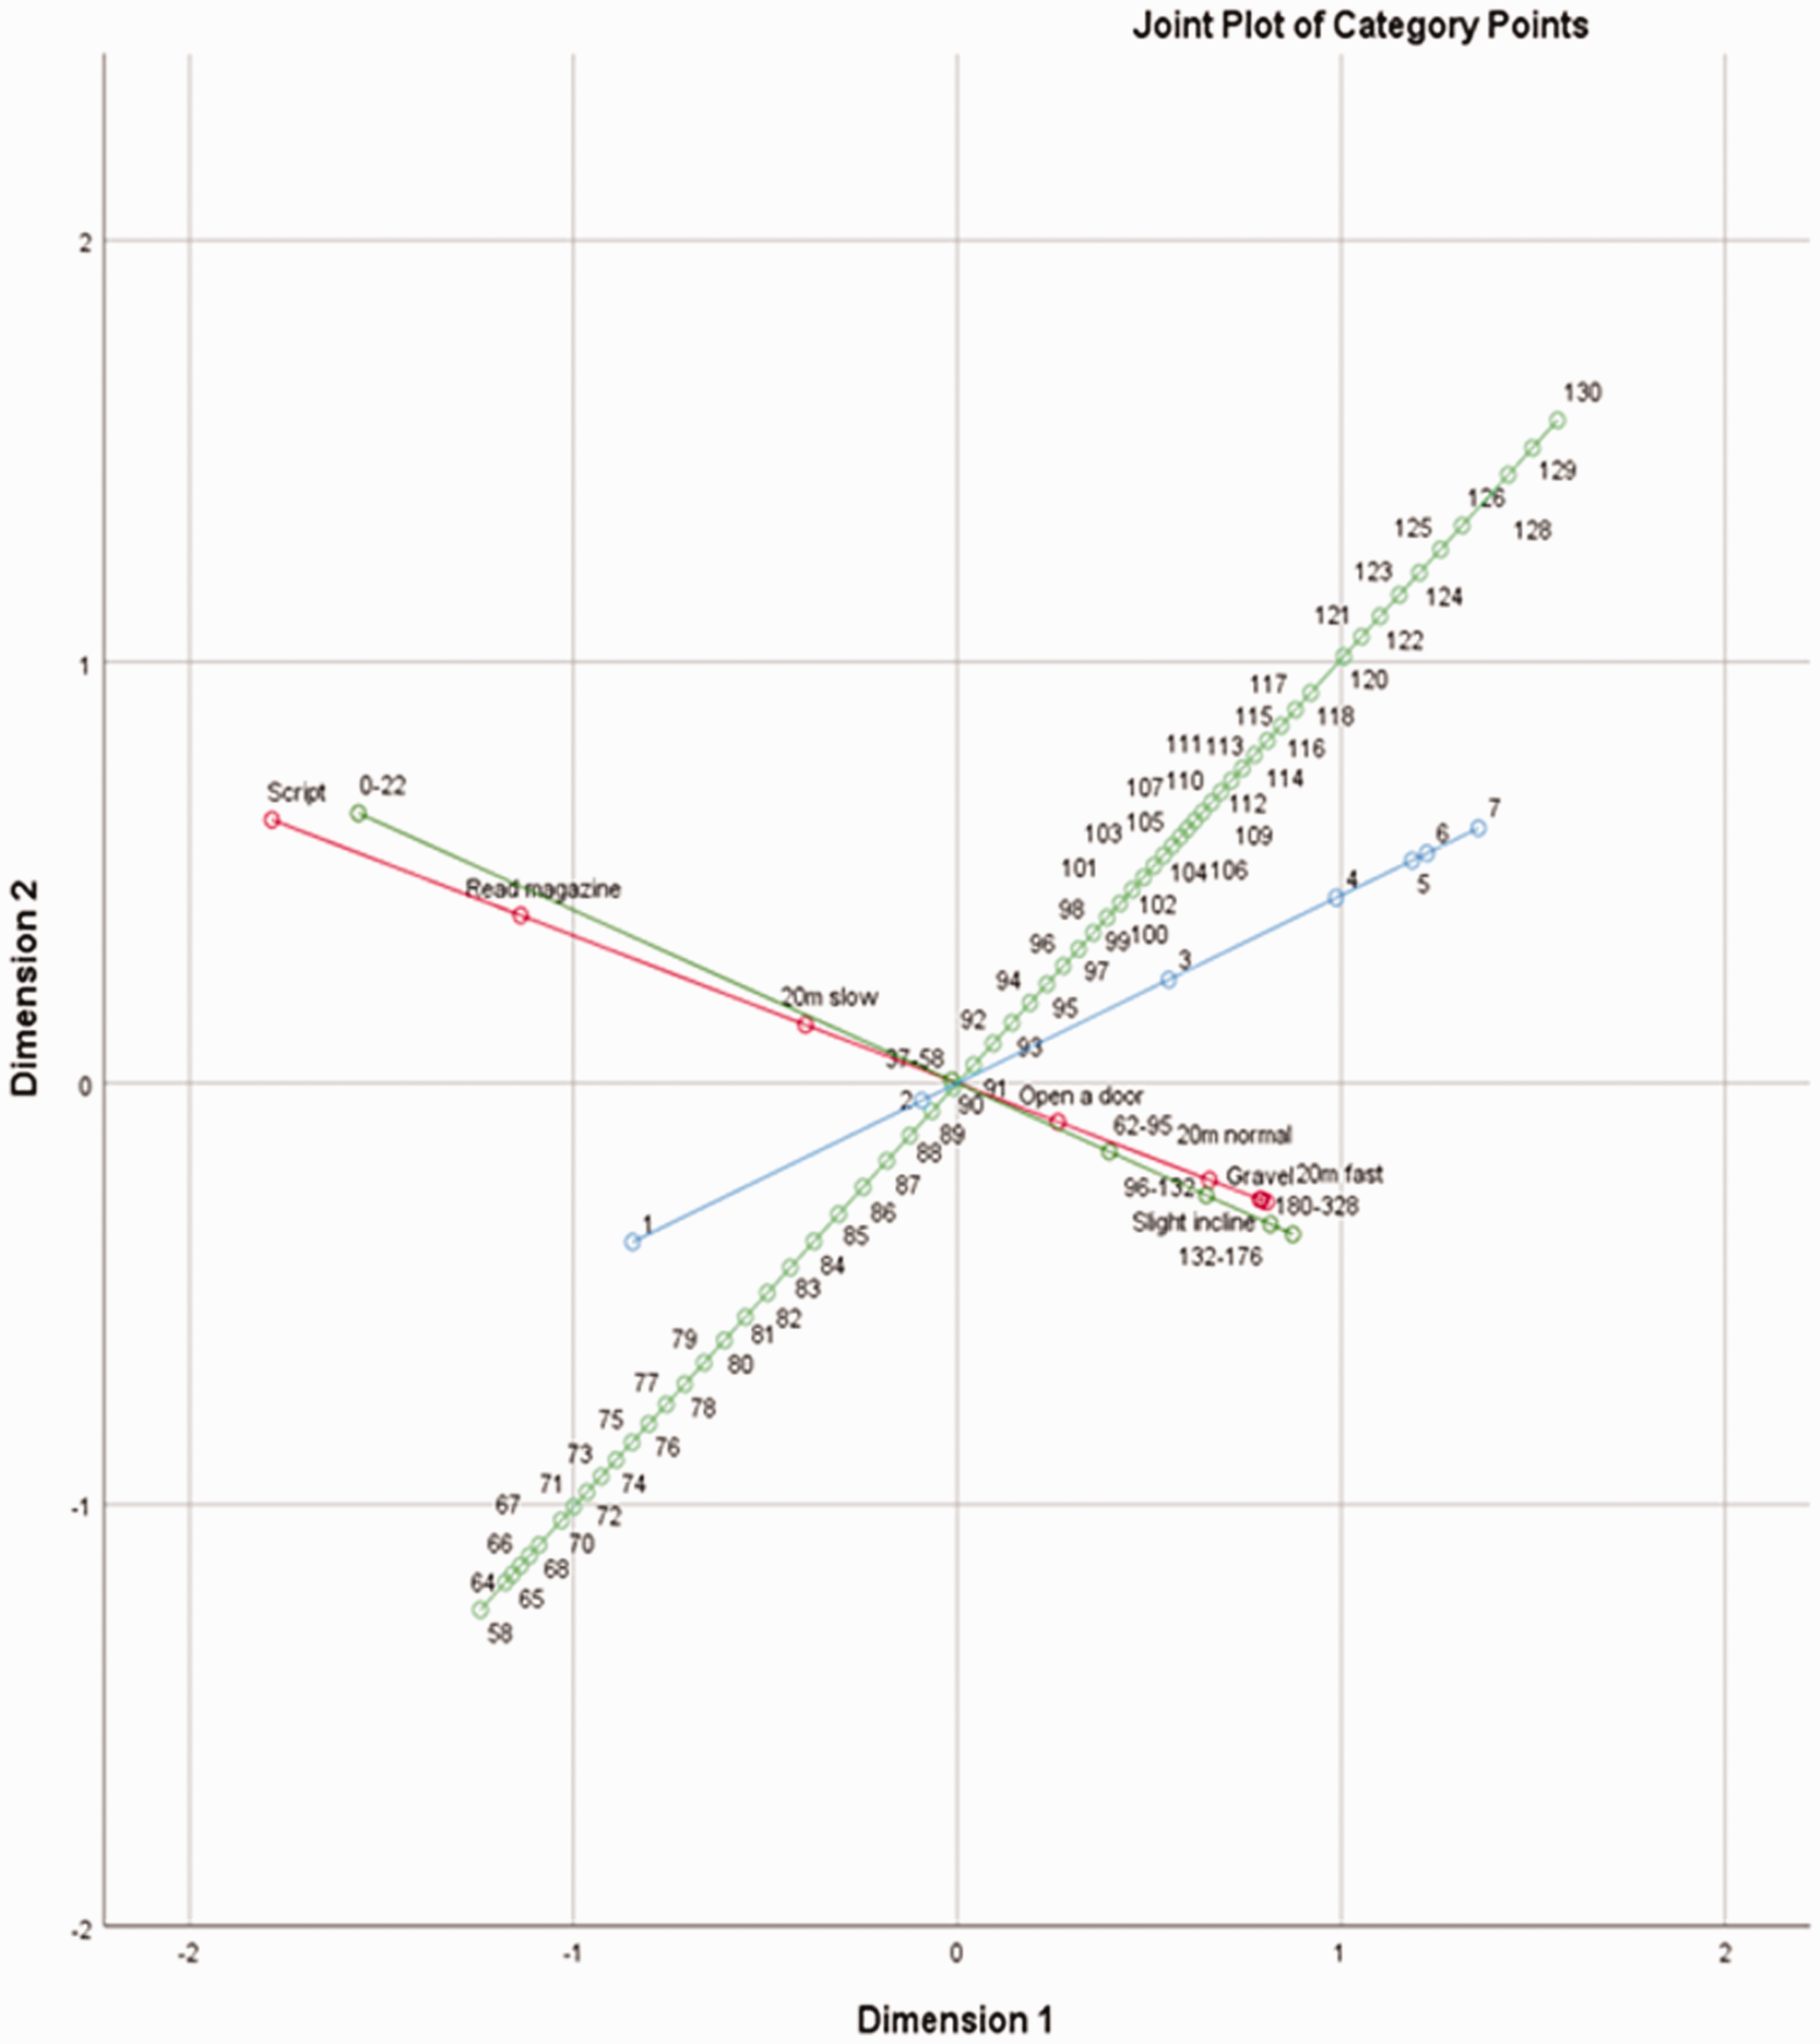
Graphical representation of the association between the classification of intensities (red line), the activity count (dark green line), the heart rate (light green line), and RPE (blue line) according to categorical principal components analysis for the entire sample (n = 27).
Discussion
The first hypothesis was partially supported, as the means of the three dependent variables (activity counts, HR, and RPE) co-varied with the classification of PA intensity. The second hypothesis was partially supported, as two factors (i.e., activity count and RPE) explained 87% of the variance, respectively, 67% and 20%. As shown in Figure 3, three most intense PAs (i.e., Slight incline, Gravel, and 20 m fast) were almost superposed, suggesting that the continuum was determined more by the first dimension, but also appreciably by the second dimension. Similarly, the activity counts were distributed on a continuum (dark green line) closely related to the intensity continuum. Therefore, activity count appears similarly influenced by the two first dimensions, suggesting that activity count is a better predictor of PA intensity over HR and RPE.
Interestingly, HR was influenced by the two dimensions within the CATPCA. However, while the highest rates are associated with the more intense activities on the first dimension, the contrary happens on the second dimension. In such a case (positive slope), the factors linked to dimension two counteract the association between the factors linking dimension 1 to the intensity of the activity. As an intensity measure, the HR may be influenced by uncontrolled factors. Although at a lesser degree, the same reversed association was observed with RPE.
Findings from this study demonstrate that activity count and RPE may be good indicators of PA intensity among MWC users. Consistent with the literature, there are large individual variations in HR data that cannot be explained solely due to changes in PA intensity.29,30 Previous studies report that fluctuations in HR with varying PAs can be attributed to multiple physiological factors, especially among individuals with SCI who experience altered cardiometabolic function. 29 Therefore, individual calibration of HR in some populations (i.e., SCI) has been suggested for accurate assessment of objective PA for research purposes. 31
While RPE alone may not be truly predictive of PA intensity, simply monitoring RPE may provide an easy and affordable way to self-monitor PA that could positively influence uptake and adherence of healthy behaviours. 32 With advancing technologies in actigraphy, it is suggested that activity counts combined with RPE may generate a reliable measure of PA intensity. Therefore, actigraphy and RPE in combination may provide an easy, unobtrusive and inexpensive method to assess PA intensity for future research or for personal knowledge.
Accurate measurement of objective PA is necessary from a research perspective to better understand the link between PA and health in MWC users and to establish dose–response relationships. 33 Actigraphs worn on the arm provide a relatively unobtrusive method for collecting objective PA data in MWC users, 15 and a promising alternative to subjective self-reports measures for accurately predicting PA intensity in the real world. 34 Algorithms for actigraphy have been developed specifically for the individual and for MWC users in general, and have demonstrated considerable prediction of PA and energy expenditure during controlled laboratory protocols. 34 However, only one study has suggested cut-points for moderate to vigorous PA using actigraphs in MWC users, which was estimated to be 3644 ± 1339 activity counts per minute when shifting from moderate-intensity to high-intensity PA. 20 Findings from the current study suggest that low-intensity PAs can be considered within a range from 0 to 45 AC/s, moderate-intensity PAs within a range from 46 to 100 AC/s, and high-intensity PAs are those greater than 100 AC/s.
This is the first study to our knowledge to estimate activity count cut-points from actigraphy for low and moderate PA, which is particularly important among MWC users who often take part in low-intensity PAs. 13 Results of this study also highlight the issue that simple activities of daily living (e.g., easy wheeling, opening a door) often border on moderate-intensity PA for some MWC users, which raises the potential issue of bias. For example, it is likely that actigraphy counts were too noisy to discern between PA intensity for those who found wheeling the most difficult, and difficulty with these relatively easy PAs may have influenced mean HR and RPE scores. Future analyses should consider stratification by fitness level and diagnoses.
Due to altered movement patterns and variations in physiology and metabolism, it has been suggested that predicting PA intensity in MWC users might be intrinsically more challenging. 34 Since actigraphy does not capture intensity information related to the resistance of PAs, it is hard to determine a true objective measure of PA intensity. New commercially available devices have strived to integrate physiological and kinematic data through user-friendly platforms that encourage self-monitoring of PA (e.g., Apple watch, smartphone applications, chaotic moon). However, the psychometric properties of these devices have not yet been confirmed and the devices themselves are still relatively expensive and inaccessible for many MWC users. Improved assessment of PA in the real world would permit appropriate cross-sectional comparisons, allow researchers to comment on the efficacy of PA interventions, and potentially inform PA guidelines. 35
Future studies are needed to confirm the precision of actigraphy-predicted PA intensity cut-points among MWC users. This may help MWC users to achieve the PA recommendations to stay healthy. Actigraphy coupled with RPE could capture leisure-time PA on a day-to-day basis, which could facilitate MWC users to determine more precise PA objectives. Since wearable technology is one of the top fitness trends for 2016, future studies may also consider how commercially available wearable devices could be integrated into PA interventions for MWC users. 36
Study limitations
This brief report is limited by a small sample size with variable diagnoses. While a larger sample may have allowed for diagnosis-specific analyses, this brief report provides results that are generalizable to a heterogeneous group of MWC users. A larger sample size would have provided a higher concentration for mean activity counts and reduced the Bootstrap intervals, therefore increasing the precision of cut-point estimates.
While the PAs chosen for this study were representative of tasks competed in the real world, there is a need for inclusion of higher intensity PAs. The moderate-intensity and high-intensity PAs in this study were too short in duration and not of high enough intensity to obtain an obvious delimitation between moderate and high intensity PAs. Therefore, the PAs that were classified as high-intensity in this study were not truly representative of high-intensity PAs in the real world. For example, wheelchair rugby or wheelchair basketball may provide a better representation of high-intensity PA over a longer duration. Moreover, since the PAs completed in this study were of very short duration, RPE and HR may not be truly reflective of the same tasks performed over longer periods of time.
Finally, this study recruited only individuals who used a two-handed MWC propulsion method. Therefore, findings from this study may not be generalizable to individuals who also use other methods of MWC propulsion (e.g., two-feet, one-hand and one-foot).
Conclusion
Actigraphy provides a good indication of PA intensity among MWC users, which may be useful for self-monitoring of PA. HR and RPE do not seem to be good indicators of PA intensity among MWC users, especially among individuals with SCI (likely due to altered cardiometabolic functions). Moreover, HR is influenced by many factors (e.g. level of fitness, individual physiological responses), and cannot be used as the sole predictor to assess PA intensity. Preliminary results from this suggest that actigraphy may be able to discriminate between low-intensity and moderate-intensity PA, but further research is needed to confirm cut-points for low, moderate and high intensity PA. Combining actigraphy with RPE could be an easy and reliable method to measure intensity of real-world activities.
Footnotes
Declaration of conflicting interests
The author(s) declared no potential conflicts of interest with respect to the research, authorship, and/or publication of this article.
Funding
The author(s) disclosed receipt of the following financial support for the research, authorship, and/or publication of this article: This work was supported by the Canadian Disability Participation Project (![]() ). Salary support was provided to Sophie Bourassa by the Canadian Institutes for Health Research, to Krista Best by the Craig H Neilsen Foundation and the Fonds de Recherche du Québec—Santé (FRQS), to Maxence Racine by the Centre for Interdisciplinary Research in Rehabilitation and Social Integration (CIRRIS), and to François Routhier by the FRQS.
). Salary support was provided to Sophie Bourassa by the Canadian Institutes for Health Research, to Krista Best by the Craig H Neilsen Foundation and the Fonds de Recherche du Québec—Santé (FRQS), to Maxence Racine by the Centre for Interdisciplinary Research in Rehabilitation and Social Integration (CIRRIS), and to François Routhier by the FRQS.
Guarantor
FR.
Contributorship
SB collected the data, assisted with analyses and interpretation, and drafted the manuscript. KB conceptualized the study, designed the study protocol, assisted in obtaining project funds, assisted with analysis and was the secondary author for drafting the manuscript. MR and JL performed data synthesis and analysis and assisted with interpretation of results. JB contributed to the design of the study, assisted with interpretation of data, and contributed to the final manuscript. FR co-conceptualized the study, contributed to the design of the study, assisted with obtaining project funds (primary investigator), oversaw the project, assisted with interpretation of data, and contributed to the final manuscript.
Acknowledgements
The authors would like to acknowledge Ms Emilie Lacroix for her assistance with recruitment and data collection, and the Canadian Disability Participation Project team for their leadership and guidance is conducting research to better understand the physical activity needs of individuals with physical disabilities.