
Abstract
Introduction
Thoracolumbar braces are used to treat Adolescent Idiopathic Scoliosis. The objective of this study was to design and validate a mechanical analog model of the spine to simulate a thoracolumbar, single-curve, scoliotic deformity in order to quantify brace structural properties and corrective force response on the spine.
Methods
The Scoliosis Analog Model used a linkage-based system to replicate 3D kinematics of spinal correction observed in the clinic. The Scoliosis Analog Model is used with a robotic testing platform and programmed to simulate Cobb angle and axial rotation correction while equipped with a brace. The 3D force and moment responses generated by the brace in reaction to the simulated deformity were measured by six-axis load cells.
Results
Validation of the model’s force transmission showed less than 6% loss in the force analysis due to assembly friction. During simulation of 10° Cobb angle and 5° axial rotation correction, the brace applied 101 N upwards and 67 N inwards to the apical connector of the model. Brace stiffness properties were 0.5–0.6 N/° (anteroposterior), 0.5–2.3 N/° (mediolateral), 23.3–26.5 N/° (superoinferior), and 0.6 Nm/° (axial rotational).
Conclusions
The Scoliosis Analog Model was developed to provide first time measures of the multidirectional forces applied to the spine by a thoracolumbar brace. This test assembly could be used as a future design and testing tool for scoliosis brace technology.
Introduction
Scoliosis is a three-dimensional (3D) skeletal deformity consisting of a combination of spinal axial rotation (AR) and lateral curvature, or Cobb angle (CA), of 10° or greater. 1 Thoracolumbar braces are commonly used to treat Adolescent Idiopathic Scoliosis (AIS) curves between 20° and 50° with the curve apex below T6 in patients who have significant growth remaining (Risser grade ≤ 2).2,3 Braces serve to maintain, and, in some cases, reduce the spinal curve to prevent progression of the deformity by applying corrective forces.2,4 Until recently, the outcome of bracing treatment has been highly debated. Weinstein et al. conducted a 5-year follow-up study (Bracing in Adolescent Idiopathic Scoliosis Trial, BrAIST), providing evidence that braces are effective (72% success rate) at treating scoliosis. 5
Scoliosis braces can be rigid, flexible, or composite and can utilize passive or active corrective mechanisms. Many braces use a three-point pressure principle as the method of correction, which involves fixation superior, inferior, and at the apex level of the curve. 6 The apical pad is located slightly anterior and two to three rib levels below the apex of the curve in order to engage the ribs and help control AR correction of the spine. The magnitude and direction of corrective forces applied by a brace to the spine remain unknown and are a common concern for clinicians and orthotists who are tasked with making design alterations, such as the addition of Velcro straps, extra pads, and section cut-outs, to improve fit and comfort for the patient. There is no standard of application or common understanding of how these alterations affect the structural properties or the corrective capacity of a brace. The process is largely subjective and follows best judgment and practice, yet these steps are critical and influence how well a brace will work and patient compliance. In-brace imaging is commonly used to measure the degree of spinal correction and determine brace efficacy, however, no force analysis is used during the design phase. BrAIST co-author, Lori Dolan identified a need to determine which forces are applied to the spine and to understand the effects brace alterations have on curve correction and spinal loading. 7 A scientific method is needed to determine the multidirectional force mechanism of scoliosis braces.
Current experimental research of scoliosis bracing mechanics has largely been limited to two-dimensional (2D) and 3D imaging techniques8–15 and computational models.16–36 In vivo imaging methods provide a measure of the angular deformity but no information of the brace mechanics or structural properties. Computational models include empirical models, dynamic musculoskeletal simulations, and finite element models (FEM). The recent literature shows utilization of advanced 3D FEM techniques in combination with in vivo techniques such as hi-resolution and low-dose biplanar radiographs, pressure mapping systems, and compliance tracking devices. However, the majority of published FEM are limited to a few patient-specific applications and ultimately lack validation from empirical data.
A great amount of effort has been put into the development and validation of one FEM for simulation of brace action. Vergari et al.35,36 created personalized parametric finite element beam models of 42 patients diagnosed with AIS. These patient-specific FEMs were generated using 3D reconstructions from bi-planar EOS images (EOS Imaging, Paris, France) of the patient out-of-brace and in-brace in order to simulate clinical indices of 3D spatial deformation related to the deformity. Orthosis action was simulated in the model by applying local displacements at each pad position corresponding to the difference in pad position before treatment and in-brace. The relevant clinical indices of kyphosis, lordosis, CA, vertebral AR, torsion index, and 3D rib hump were calculated in the deformed FEM after simulation. These values were compared with the measured in-brace values for each parameter to determine the error in the model. The FEM showed promising results that support its capacity to simulate brace action with only 87% of the clinical indices presenting error lower than the corresponding measurement uncertainty. This work was focused on simulating the behavior of the trunk’s geometric deformation in response to known brace pad displacements. The authors noted that the FEM was limited by imposing known displacements to simulate the pad pressure, and they expressed the need for explicit brace modeling and analysis of contact forces in order to improve the model.
A number of researchers have been using skin-to-brace interface force distribution and pressures and strap fastener transducers as a method for understanding bracing mechanics.11–14 Mac-Thiong et al. 11 performed an external biomechanical evaluation of the Boston Brace System for the treatment of AIS to relate the brace interface forces at different regions of the trunk with the internal brace strap tension. A custom pressure mapping system made of force-sensing transducers was created for the purpose of this experiment. To measure the internal strap tension, an experimental, in-line load cell was added to the brace design. These techniques showed the relationship between strap tension magnitude and the compressive forces applied by the brace to the critical trunk regions. However, this study was not able to provide any estimation of the biomechanical loads on the spine due to the brace.
Ultimately, none of the existing research on this topic seems to answer the clinical question of “how much force is applied to the spine by a brace?” Current FEM cannot answer that question without generalized assumptions regarding the anatomical stiffness properties, force transmission through the anatomy, and structural properties of the custom brace. Pressure pads and strap fastener transducers can give an estimate of the direct compressive loads applied to the torso, and they are limited in that they do not have the sensitivity to capture multidirectional forces applied by the brace. To our knowledge, no mechanical model of a scoliotic spine or testing assembly is available to study bracing mechanics in scoliosis. The objective of this study was to design and validate a mechanical analog model of the spine to simulate a thoracolumbar, single-curve, scoliotic deformity in order to quantify brace structural properties and force response on the spine.
Methods
An analog model of an adolescent scoliotic spine and a robotic testing platform (RTP) were used to measure the force response of a scoliosis brace over a range of spinal correction. A single-curve, thoracolumbar Boston brace (Avon, MA) was analyzed.
Model design
A mechanically equivalent analog model of the AIS condition was developed, and the force output of the model was validated. 37 The Scoliosis Analog Model (SAM) used a linkage-based system to simulate 3D spinal correction of CA and AR deformity of a single-curve scoliotic spine. The SAM was designed to engage with the interior surface of a scoliosis brace at each of the three spinal levels, superior, inferior, and at the apex.
Characteristics and dimensions from patient records and bi-planar EOS images (EOS Imaging, Paris, France)38,39 (IRB 14-03110-XP reviewed and approved by the University of Tennessee Health Science Center IRB Committee) were used to customize the SAM for use with a unique Boston brace, including height (1.7 m), “out of brace” spinal measures CA (28°) and AR (5°), and “in brace” spinal measures of CA (18°) and AR (0°) (Figure 1(a)). The spatial locations of the critical anatomy, including the apical vertebral body and the superior and inferior junctional vertebral bodies, corresponded to the connection points of the main linkages of the SAM (Figure 1(b)). Each of the three vertebral bodies was represented in the SAM by a linkage assembly. The linkage assembly consisted of a combination of steel linkages and connectors, and plastic arms and shells (Figure 1(c)). Each linkage component had a clevis joint and ball or pin joint at its ends held with a pin connector. The distance between the critical vertebral bodies corresponded to the linkage lengths (D1: 8.1 cm, D2: 6.6 cm). The distance between the outer surface profile of the torso to the center of the vertebral body (D3: 12.8 cm, D4: 10.5 cm, D5: 13.6 cm) corresponded to the length of the arm component, which served to attach the shell to the linkages using the pin connectors. Each shell had a specific geometry that matched and interfaced with the internal contoured surface of the superior, apical, and inferior critical regions of the brace.
Steps in designing the scoliosis analog model. (a) Coronal plane data, (b) critical anatomy corresponding to SAM components, and (c) SAM components.
The model utilized the three-point pressure principle to engage with the inside of the brace at the apical shell and the endpoints of the curve across the entire critical region, as defined by the orthotist. 6 These regions could be directly lateral to the junctional bodies (within the coronal plane), offset superior–inferior, or offset anterior–posterior (out of the coronal plane). The arm-shell components were able to pivot about the pin connector to engage with offset critical regions. The CA corresponded to the angular displacement of the linkages relative to the vertical (caudal-cranial) axis. The AR of the apical vertebral body was used to define the apical connector’s degree of offset from the coronal plane. By using these critical anatomical parameters, the experimental SAM was designed to closely replicate a clinical scoliosis deformity.
Testing assembly
The upper and lower sections of the SAM were attached to the moving actuation system and base of a RTP
40
(Figure 2(a)). The four main components of the RTP used for this study were the Exlar linear actuator (Model GSX-30; Curtis-Wright, Chanhassen, MN), rotary servo actuator (Model FHA-25 C; Harmonic Drive, Peabody, MA), upper load cell (ULC) (Model 100M40 six-axis load cell; JR3 Inc., Woodland, CA), and lower load cell (LLC) (Model 67M25S3; JR3 Inc., Woodland, CA). The upper mounting plate of the SAM was centered and fixed to the ULC that was attached to the vertical actuator and rotary actuator. The lower mounting plate of the SAM was centered and fixed to the LLC that was attached to the RTP lower platform. Since scoliosis is a 3D deformity of the spine, the SAM was aligned to the “deformed” reference plane (offset from coronal plane to the same degree as AR of the apical vertebral body). This reference plane was where the simulations and analyses were performed (Figure 2(b,c)). The reference plane’s vertical axis corresponded to the brace’s axial direction and RTP Z component, and the reference plane’s horizontal axis corresponded to the brace’s radial direction and RTP Y component.
Test assembly. (a) The SAM mounted in the programmable robotic testing platform, (b) front view of the SAM showing anatomical coronal plane and reference plane, and (c) transverse view of the SAM showing anatomical coronal plane and reference plane.
Validation of SAM force output
SAM was tested with a RTP without any input load to ensure the links moved freely. Less than 3 N of vertical force occurred over 40° of linkage rotation. Validation of the transmission of forces acting on the SAM was performed by applying a series of input forces with varying orientation (Figure 3) to the apical connector of the SAM during simulated CA correction. Force components transmitted to the superior connector of the linkage assembly were recorded and compared to results from a computational model. Based on the rigid body design of the SAM, the force response was further verified by theoretical calculations using the trigonometric relation of the known orientations of the linkages and the applied force. The percent error relative to the computational results was calculated for each input force orientation.
Setup for validation of SAM force output.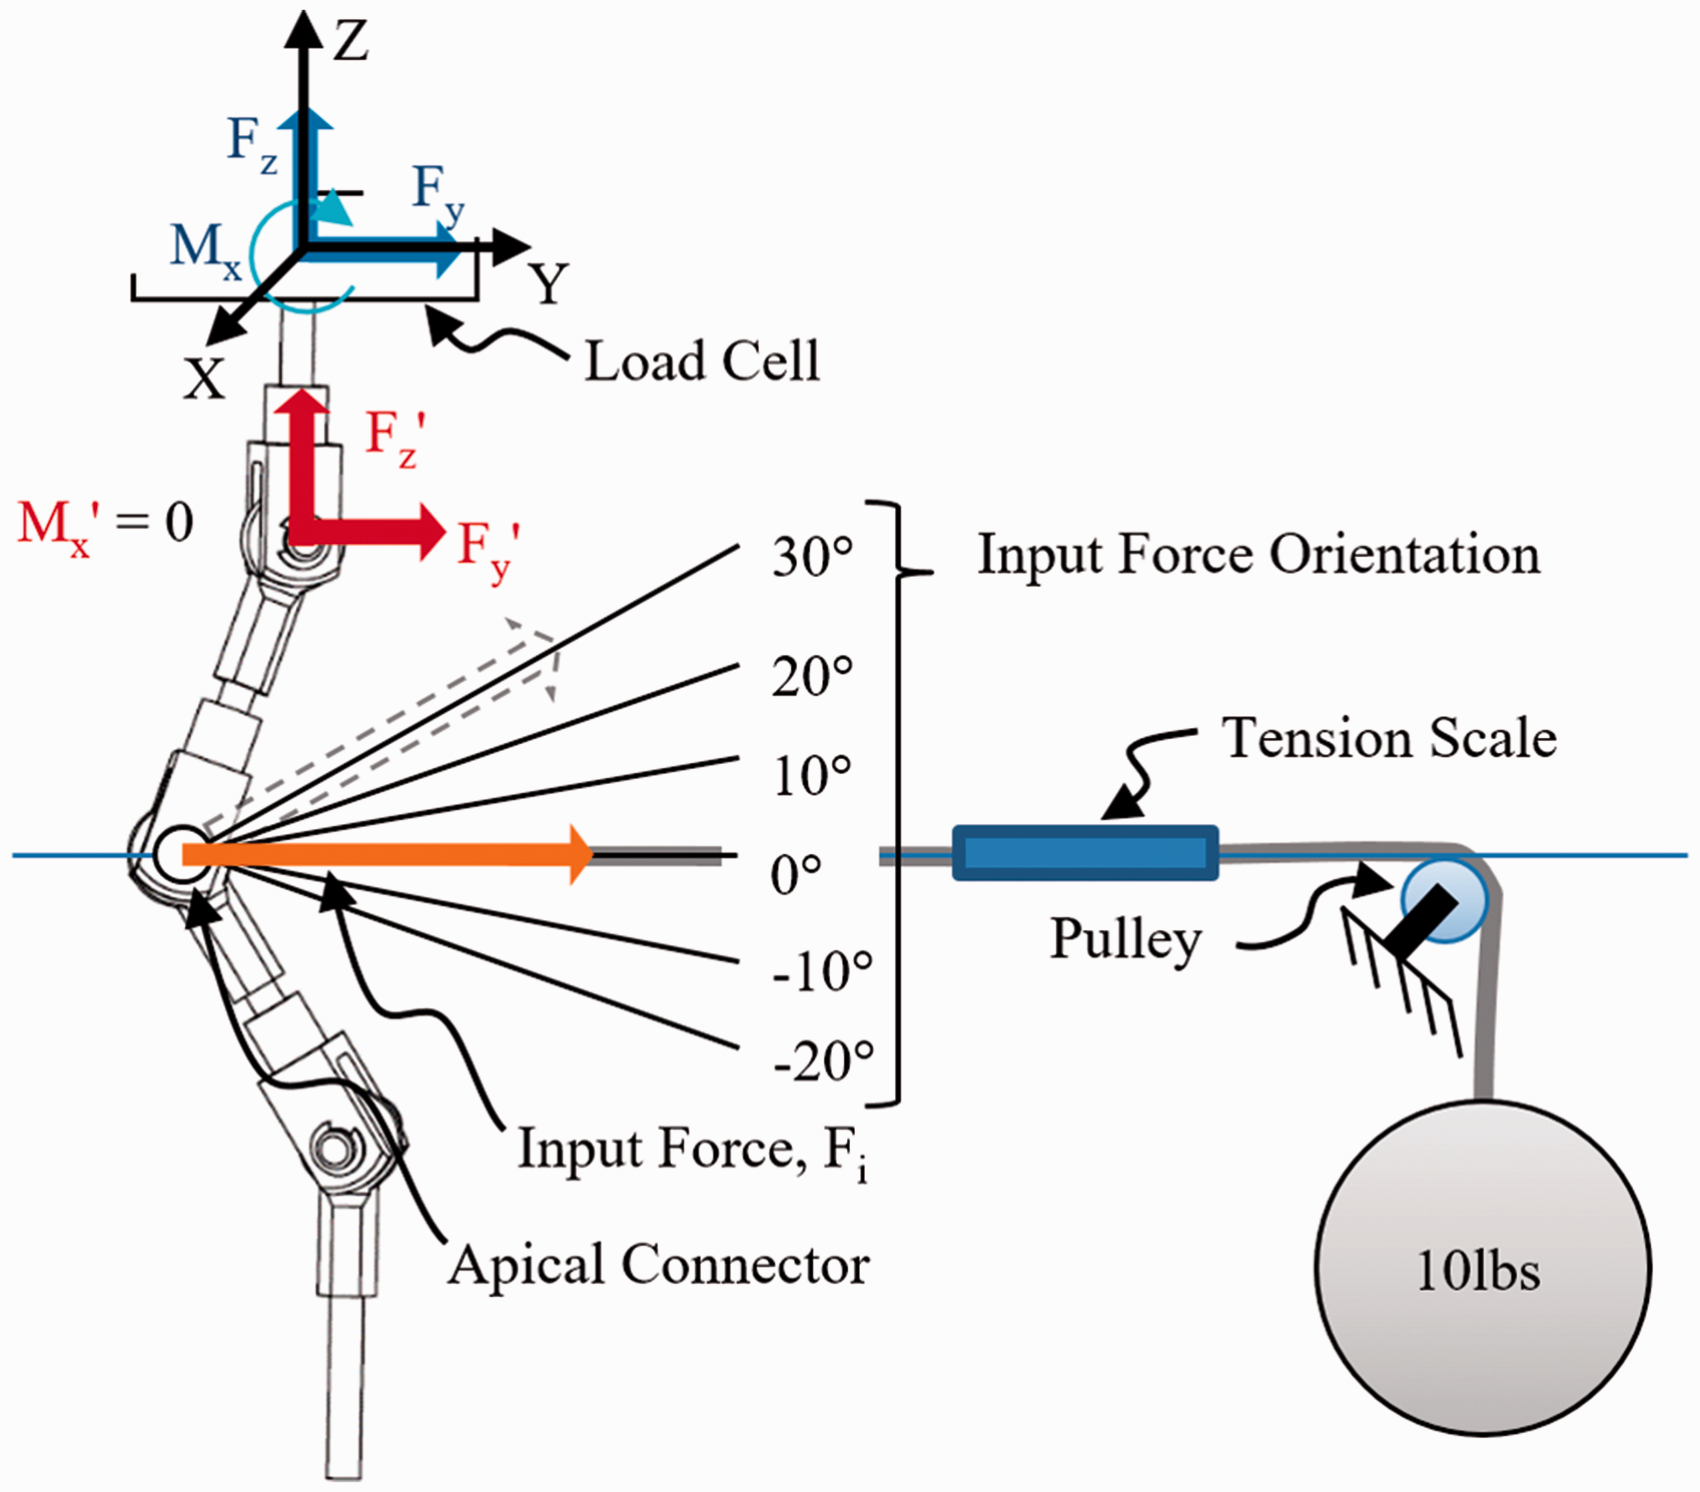
A 4.54 kg (10 lb) weight acted as the controlled force input for the experimental tests. The weight was suspended from a cable that passed over a pulley and connected to the apex of the SAM. A Brecknell digital handheld tension scale (Brecknell, Fairmont, MN) was suspended in line between the attachment at the SAM apex and the pulley and revealed a 10% reduction of the suspended weight (or 4.5 N). For this reason, all tests and theoretical calculations were performed using 40 N as the input force, Fi. Relative to the apex of the SAM, the height of the pulley assembly was adjustable, which allowed the input force to be applied at a set orientation.
The testing platform was programmed to displace along the vertical axis a given distance and speed (4.8 mm/s). Downward movement caused the SAM to simulate a 40° CA change in the spinal curve. Five orientations of the input force relative to a horizontal line along the Y-axis were tested, including −20°, −10°, 0° (horizontal), +10°, +20°, and +30°. In these tests, negative angles are below the horizontal reference and positive angles are above the horizontal reference (Figure 3). Each input load orientation was tested three times. Before each run, the suspended weight was reset and stabilized. The force components, Fz and Fy, and moment, Mx, applied by the weight were measured at the load cell at a sampling rate of 25 Hz. These measured components were transformed to the pinned joint of the superior connector of the linkage assembly (Fz′ and Fy′, Mx′=0) for analysis. Also, the linkage assembly angular displacements (simulated CA) were measured at a sampling rate of 25 Hz. The tests were also performed using a 2D computer aided design (CAD) SAM. An analysis was performed using Working Model 2D (Design Simulation Technologies, Inc., Canton, MI).
The force components measured during the experimental tests were compared to the force components measured during the computer simulations. The axial force components for the experimental and computational tests were plotted against the simulated CA for each input force angle. Using Microsoft Excel (2007), a fourth order polynomial equation was generated for each curve. The percent error relative to the computational results was calculated for each input force orientation. The mean percent error revealed that there was a 6% force reduction within the SAM system over the testing range. This error was attributed to the frictional losses between the components of the linkage assembly.
Test protocol
To measure the force response of the brace, coupled CA and AR motion was simulated. The SAM assembly was mounted on the RTP and the weight of the SAM was zeroed from the load cells. The SAM was first tested without any input load to ensure the links moved freely and registered less than 3 N of force at the ULC and LLC. As instructed by an orthotist, the brace was mounted onto the SAM (Figure 4(a,b)). Using tensiometer devices attached to the Velcro straps, each strap was tightened between 22 N and 45 N (5–10 lb). The tensiometer devices (222 N (50 lb) max capacity, 0.1 N resolution; Berkley Digital Scale) were powered by a D.C. power supply (3 V; BK Precision) and controlled using a National Instruments LabVIEW 2010 VI program. The testing platform was programmed to either displace downward along the Z (vertical) axis or to rotate about the Z axis. Programmed linear movement caused the SAM to transition from the “corrected” alignment (18° CA) to the “deformed” alignment (28° CA), simulating 10° CA change in the spinal curve. Programmed rotation caused the SAM to axially rotate within the brace, which was inferiorly fixed to the platform using a brace fixture, effectively simulating AR correction (0° to 5°). Coupled CA and AR correction was achieved by executing both motions simultaneously (Figure 5(a,b)). Strap tension remained within ±4.5 N (1 lb) of the initially set value. The setup was cycled five times before collecting data to ensure the brace settled onto the model.
Testing assembly. (a) SAM with single-curve thoracolumbar Boston brace and (b) tensiometer attached to strap. Methodology for simulating a changing spinal curve using linkage components. (a) Corrected alignment and (b) deformed alignment.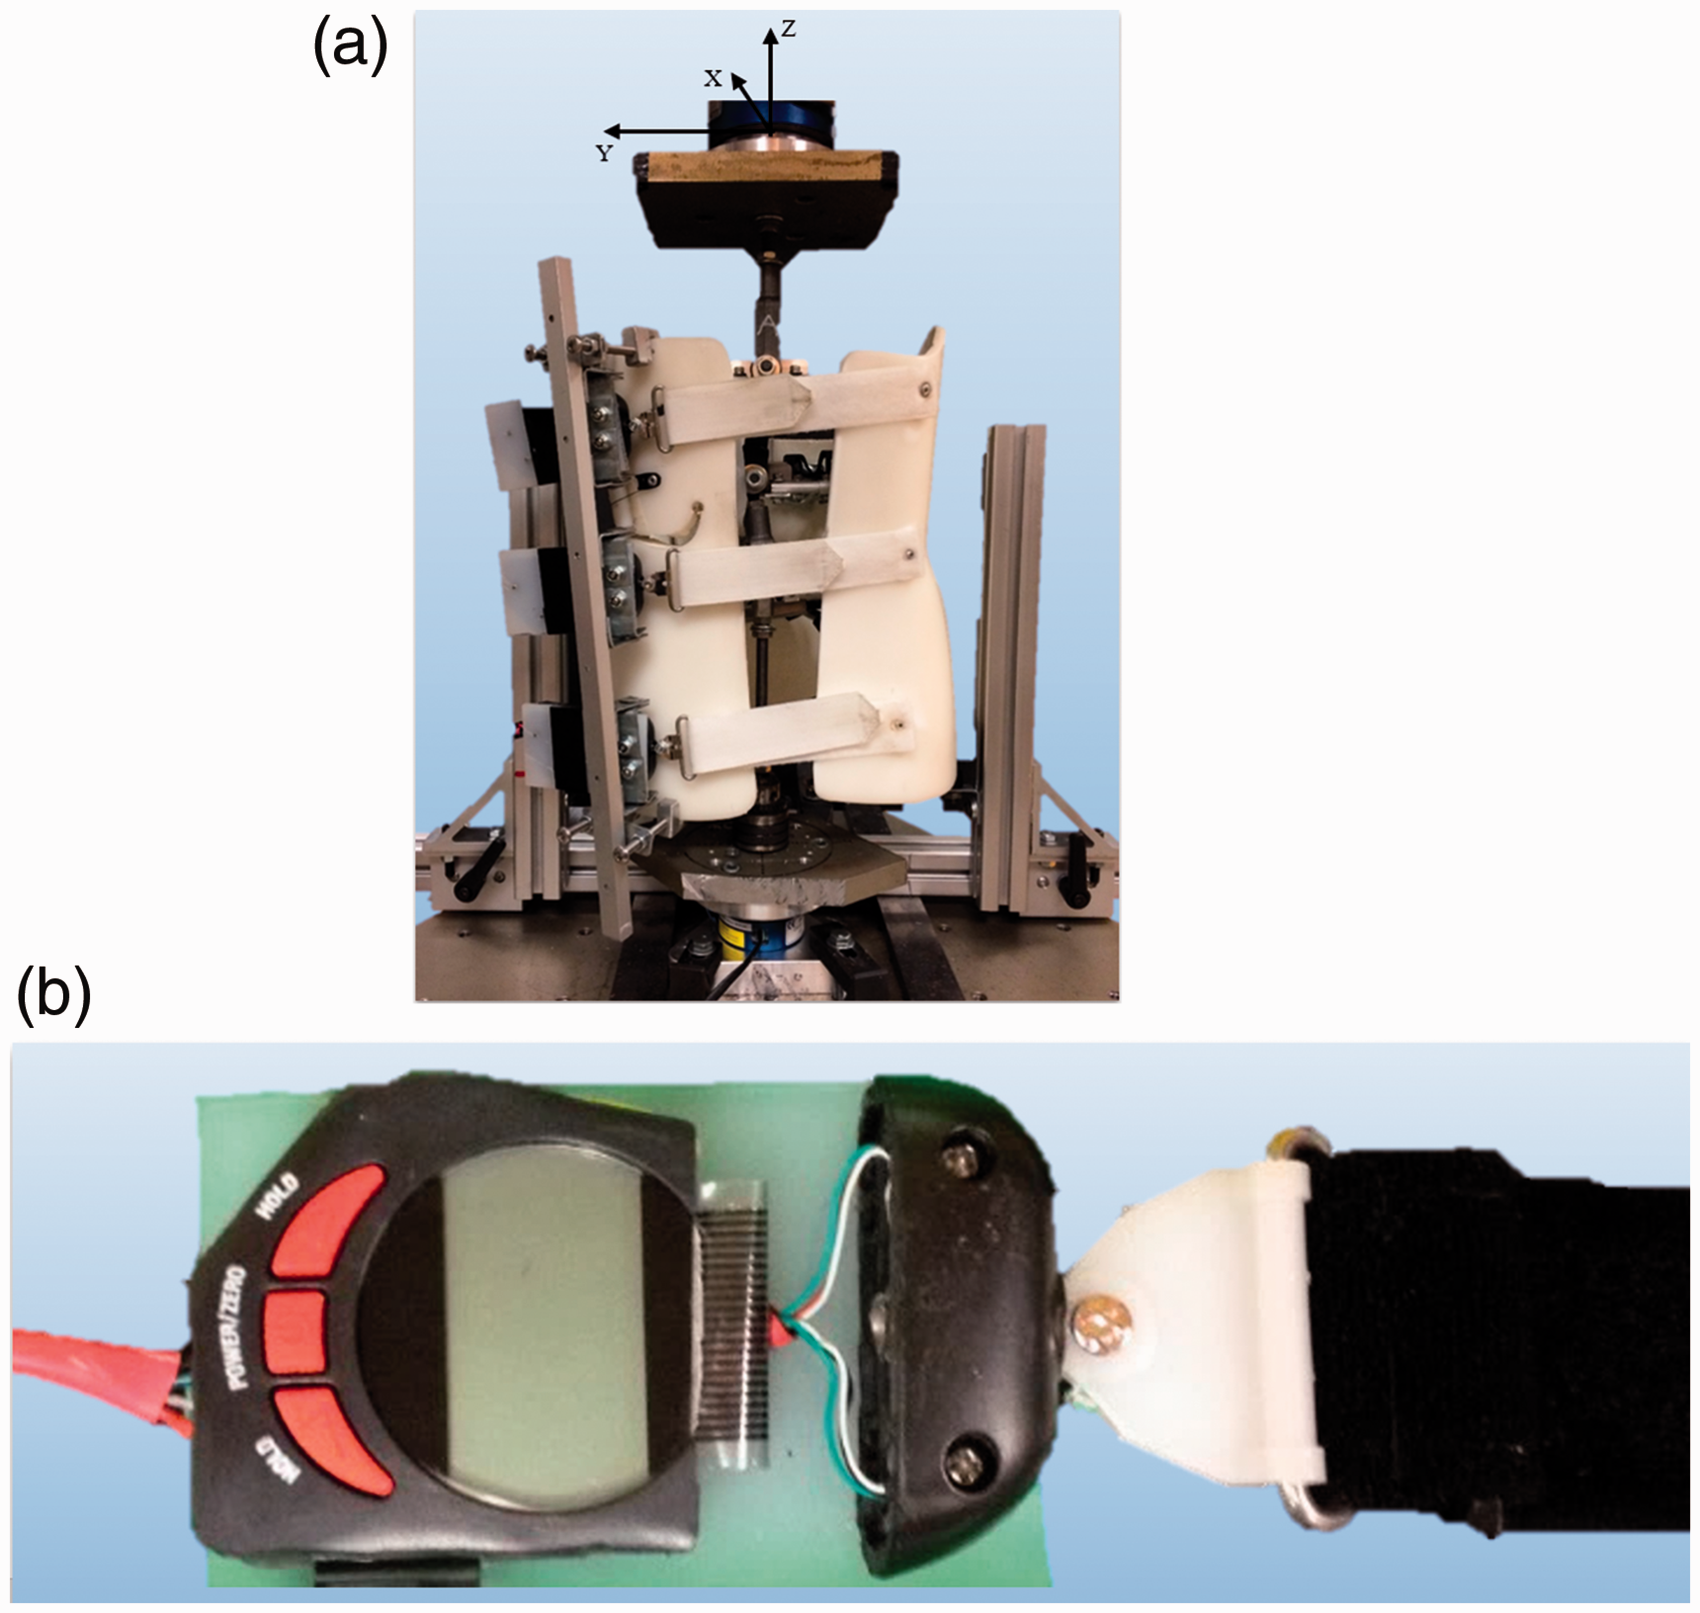

Data management
The 3D force and moment components, which were generated by the brace as a reaction to the simulated deformity, and the linkage assembly angular displacements were measured at a sampling rate of 25 Hz. These 3D forces read at both load cells and CA change were plotted in a force–displacement curve (FDC). The moment about the vertical axis (Mz) read at the ULC and AR change were plotted in a moment–displacement curve (MDC). The FDC and MDC provide a visual representation of the loading behavior of the brace during the simulation. The slope of the curves represented the structural stiffness properties of the brace with respect to the specific loading axis. Stiffness was expressed as a resistive force relative to the angular change of the linkage system. Linear stiffness properties (X, Y, Z) were derived from the 3D force response relative to CA change. This definition was preferred over the traditional linear stiffness measure so that the resultant stiffness values were more easily relatable to the clinical measurements (i.e. it provided a way to normalize the measure relative to the CA and AR deformity). Axial rotational stiffness was derived from the Z-moment relative to AR change. Apical shell loads in the 2D reference plane were calculated by transforming the load cell readings to the spatial location of the apical connector. Using the method of joints, the forces were balanced to determine the magnitude and direction of the load applied by the brace to the model apical connector. This calculation was done assuming that the connectors were frictionless pins and that all linkages were rigid, two-force members.
Results
The brace force response was measured by the ULC and LLC during the simulation of the scoliosis deformity. The 3D force and moment responses are shown in Figure 6(a) (ULC Forces), Figure 6(b) (LLC Forces), and Figure 6(c) (ULC Moment). Calculated brace structural stiffness properties are shown within each figure. With X- and Y-stiffness values between 0.5–0.6N/° and 0.5–2.3N/°, respectively, it can be seen that this brace offers little structural stiffness along those axes. However, with a Z-stiffness between 23.3 and 26.5N/° and AR-stiffness of 0.6 Nm/°, the brace has much greater stiffness along the Z-axis and limited rotational control. The customized SAM replicated the 10° CA and 5° AR correction observed in the patient's EOS X-ray images. Using the data from each load cell, the apical shell loads were calculated for the deformed alignment of 28° CA and 5° AR. The brace applied 101 N upwards and 67 N inwards to the apical connector of the model (Figure 7). Collectively, these results serve to quantify the mechanics and structural properties of the scoliosis brace tested.
Plotted brace force and moment response with derived stiffness properties. (a) Force–displacement curves of the upper load cell, (b) force–displacement curves of the lower load cell, and (c) moment–displacement curves of the upper load cell. Free-body diagram of the SAM at 28° CA and 5° AR.

Discussion
Braces serve to reduce and prevent progression of the spinal curve by applying multidirectional corrective forces. Orthotists generate an expected brace force response through alterations in the brace design, such as apical pad placement and orientation. Specifically, while considering the location of the apical pad of the brace, the orthotist conceptualizes the force vector necessary to correct the spinal deformity. Until now, there has been no experimental model capable of quantifying the magnitude and direction of the corrective forces applied by a physical brace to a torso.
Structural properties provide a means to compare and classify bracing technology. Interpretation of the measured 3D force and moment data provides a basic understanding of the mechanics and structural properties of the particular brace studied. During the fabrication of a brace, an orthotist may desire to change brace structural stiffness to achieve better patient fit, more comfort, or better brace performance. For example, a patient with poor muscle tone and excessive anatomical spinal alignment may require a stiffer brace to achieve and maintain the desired level of correction, and the design changes, such as addition of extra Velcro straps, could provide the increase in brace stiffness required (i.e. increase brace forces applied to the spine). Currently, these design changes are made purely based on the professional judgment of the orthotist. The SAM could also be used as a tool to quantify how these design changes affect the structural properties of the brace and the achieved brace loads applied to the spine. These features include brace pads, pad placement, pad geometry, material selection, material cut-outs, rigid components, and other fitting elements.
Since this research model and testing methodology are new, directly comparable data are not available. Van den Hout et al. measured the magnitude of direct compressive forces at the body brace interface. 13 The forces exerted by the internal lumbar and thoracic pads of a Boston brace were measured in 16 patients with AIS using an electronic pressure measuring system. The mean forces measured at the lumbar brace pad was 214 N (range, 0–727 N) and at the thoracic brace pad was 66 N (range, 4–209 N). These force ranges are comparable to the magnitude of the forces measured by the SAM.
Limitations of study
General limitations that may affect the validity of these results include the simplification of the model compared with in vivo biomechanics, the 2D analytical methods, the lack of directly comparable brace-applied force measures for validation, and design approximations that were made during model development. The model is able to capture the force components, but does not consider the effective area of the applied forces beyond the defined critical regions of the torso. This could have been addressed by measuring the brace-model interface pressure and force distribution. The testing did not account for loss of brace stiffness over longer periods of wear. The elastic nature of the brace material allowed for the brace to return to its corrected alignment after each test. The Boston brace used in this study was an older brace design that provided limited AR correction. Newer brace designs that offer more control of AR correction should be studied in future work.
An important design feature of the SAM is that the “spine” is assumed to have negligible or zero stiffness. In other words, the SAM linkages are rigid and do not reflect the compliant nature of the anatomy. Also, no effect of the ribs was simulated because they were assumed to be rigid. Thus, all reactant forces measured can be attributed to the brace alone. Despite these limitations, this research has resulted in a novel model, methodology, and baseline data for future research on scoliosis bracing technologies.
Conclusions
The SAM and testing methodology enables study of scoliosis bracing technology through the measure of brace structural properties and force response on the spine. Measured force components provided the first evidence of multidirectional force transmission by confirming an upward lifting effect. Future SAM design improvements will permit the 3D study of complex curve types. Future testing may include variable pad and strapping parameters such as orientation, spatial location, size, material, and shape to determine the impact that they have on force transmission. By understanding the effects of removing, adding, or altering the fitting pads and straps, recommended brace design changes may result in improved in-brace correction and treatment outcome.
Footnotes
Declaration of conflicting interests
The author(s) declared no potential conflicts of interest with respect to the research, authorship, and/or publication of this article.
Funding
The author(s) disclosed receipt of the following financial support for the research, authorship, and/or publication of this article: Funding for this research was provided by the Orthopedic Biorobotics and Rehabilitation Laboratory in the Department of Orthopedic Surgery and Biomedical Engineering at The University of Tennessee Health Science Center in Memphis, TN.
Guarantor
DJD.
Contributorship
DJD and CLC researched literature and conceived the study. All authors were involved in protocol development, gaining ethical approval, and patient record review. DJD and CLC analyzed the data and wrote the first draft of the manuscript. All authors reviewed and edited the manuscript and approved the final version of the manuscript.
Acknowledgements
The authors would like to acknowledge Boston Brace and the Center for Orthotics and Prosthetics, Inc. for donating the scoliosis brace used in this study. Early aspects of this work were previously presented at the 2015 Southern Biomedical Engineering Conference in New Orleans, LA, USA.