
Abstract
Introduction
Chronic neck pain results in considerable personal, clinical, and societal burden. It consistently ranks among the top three pain-related reasons for seeking healthcare. Despite its prevalence, neck pain is difficult to both assess and treat. Quantitative approaches are required since diagnostic imaging techniques rarely provide information on movement-related neck pain, and most common clinical assessment tools are limited to single plane motion measurement.
Methods
In this study, the ability of an inertial measurement unit to document the cervical motion characteristics of 28 people with chronic neck pain and 23 healthy controls was assessed. A total of six circumduction metrics and one neck circumduction trajectory model were proposed as identification metrics.
Results
Five metrics demonstrated significant differences between the two groups. The neck circumduction trajectory model successfully distinguished between the two groups.
Discussion
The evaluation of the proposed metrics provides proof of concept that novel metrics can be captured with relative ease in the clinical setting using an inexpensive wearable sensor headband. The derivation of the proposed model may open new lines of inquiry into the clinical utility of assessing the multiplanar movement of cervical circumduction. The results obtained from this study also provide additional insight for the development of a sensitive, quantifiable and real-world neck evaluation strategies.
Keywords
Introduction
Mechanical or non-specific neck pain is common 1 and results in significant personal disability2,3 and global burden. 2 Approximately half of all individuals will experience neck pain over the course of their lifetime, with a mean annual prevalence rate exceeding 30%. 3 Chronic neck pain is particularly challenging to treat as etiology can be difficult to ascertain and even when a clear lesion can be identified, evidence syntheses have generally reported small or moderate effects at best.4–6 Recent efforts to optimize treatment decisions have explored the potential value of diagnostic, prognostic, or theranostic subgroups.7–9 To date, subgroups have been determined using scores on self-report tools, 7 results of quantitative sensory testing 8 or presence of restricted range of motion (ROM) in defined planes of cervical motion (sagittal/frontal/horizontal). 9
Active cervical mobility (ROM) has been traditionally viewed as a useful clinical metric for identifying dysfunction and evaluating outcomes of treatment. It is generally restricted in people with neck pain 10 and certain patterns of restriction may discriminate between people with neck pain of different etiologies, such as articular vs. muscular. 10 Measurement of cervical mobility most commonly occurs in single planes of motion, using analog or digital inclinometers that provide tilt angles in relation to a plumb line with gravity. Straight-plane ROM has demonstrated at best weak associations with patient-reported pain and disability, 11 but these are inconsistent. In one of the largest case-control studies of neck kinematics (n = 4293), Kauther and colleagues 12 found no differences in straight-plane ROM between patients with and without chronic neck pain. Additionally, test–retest and inter-rater reliability of these measures indicates considerable random error and is affected by the initial orientation of the head to gravity.13,14 Cervical rotation is difficult to evaluate and its measurement usually occurs through use of a magnetic compass and a large magnet that is worn around the patient’s neck to orient the needle. Beyond being cumbersome and having measurement issues, such as accuracy and reliability, the clinical utility of such measures has yet to be strongly supported. Moreover, researchers have not consistently found relationships between movement in single cardinal planes and the experience of neck-related disability. For example, Saavedra-Hernandez and colleagues found that of the single planes tested, only cervical extension was significantly associated with self-reported disability, and the association was weak (r = –0.18). 11 This suggests that the tradition of observing straight-plane cervical mobility in clinical practice may have limited value.
Three-dimensional (3D) motion capture systems using optical,15,16 ultrasonic, 17 or magnetic18,19 sensor systems have been used in lab-based settings to quantify and qualify more subtle metrics of deviation in cervical mobility.16–19 For example, Vorro et al. 15 used an optical tracking system to find differences in magnitude and symmetry of neck motions between control group and neck pain group, but with limited reliability. 15 Yang and colleagues used lab-based electromagnetic tracking to quantify the volume of the “cervical workspace” during a circumduction movement, finding reduced volume in people with mechanical neck disorders compared to healthy controls. In a separate study, they also found greater spectral entropy in the clinical group.20,21 Other lab studies have identified that the displacement,22,23 velocity,23,24 acceleration,19,22 and smoothness (jerk index)17,23 of neck motions in people with neck pain are significantly different from matched controls. However, the usefulness of these approaches has been criticized, as the parameters are sensitive to the envelope of motion and velocity18,25 and are not accessible for routine clinical practice.
Embedded inertial measurement units (IMUs) are now common in many connected or “smart” devices and are increasingly accessible to consumers. These motion sensing units are capable of measuring acceleration (accelerometers), rotation (gyroscopes), and orientation to a magnetic field (magnetometers) on a single chip. These offer the potential for capturing sensitive metrics of motion, independent of velocity, across multiple planes simultaneously, using an inexpensive data capture system. This enables quantitative description of more “real-abstract” mobility impairments than what have traditionally been measured in the clinic. The purpose of this paper is to describe the development of new IMU-based metrics extracted from cervical circumduction motion for possible future clinical use, and to describe the creation of a mathematical model of normal motion against which future studies can compare data from people with neck pain.
Materials and methods
Participants
This research included participants with mechanical or myofascial neck pain (at least three months duration) with at least one active trigger point (taut band of muscular tissue which is painful on palpation 26 ) in the cervico-thoracic or shoulder girdle region recruited from a local tertiary care interventional pain center, and healthy university-aged control participants recruited from the student body of Western University, Canada. Exclusion criteria for both groups included radiofrequency ablation of any cervical medial branch within the past year, intra-articular cortisone facet injection within the past four months, trigger point injection into the cervical/shoulder girdle muscles within the past four months, frequent (>1 every two months) migraine, or any problems with vertigo or dizziness with quick head movements. Approval for this study was obtained from the University of Western Ontario's Health Sciences Research Ethics Board prior to the start of the experiments.
Experimental procedure
Upon obtaining formal written consent, all participants completed a self-report questionnaire collecting demographics and neck pain history if applicable. The neck pain group underwent a standardized clinical exam from an experienced physiotherapist or physical medicine specialist that included routine straight-plane observation of active ROM and identification of trigger points through manual palpation. Following this, a rater who was blinded to the clinical assessment findings secured a nine-degree of freedom (DOF) inertial measurement unit (Shimmer3 IMU,
27
Shimmer Research, Dublin, Ireland) to the head using a custom elasticized headband (Figure 1). The accelerometer of the IMU was set to ±2 gravity (g) with resolution of 0.03 mg and repeatability of 98%.
27
The headband was located just above the eyebrow ridge, with the sensor oriented towards the front of the head on the mid-sagittal line. The same headband was used in all trials, having a custom fitting bracket that only allowed the sensor to be attached one way. A coin flip determined the starting direction of the first trial of the circumduction movement. Data collection started with the participant sitting upright on a stool with their head in a neutral position for five seconds. They then flexed their head and neck forward as far as possible and performed one full circumduction movement in the selected direction (clockwise or counterclockwise) with encouragement to move at a steady pace, making as large a circle as possible (rolling the head around the shoulder girdle) until the head returned to the mid-sagittal starting position, then extended back to the neutral starting position (Figure 2). The researchers watched to identify trunk movements that may have been used as a strategy by the participant to increase the apparent range of neck movement, where the trunk appeared to deviate from an upright posture, the trial was discarded and another conducted with the researchers providing manual stabilization of the trunk to isolate movement to the neck as much as possible (n = 1 subject). Following an additional 5 s of upright sitting, the participant then completed another full circumduction this time starting in the opposite direction. The circumduction movement requires cervical movements in all anatomical planes.
19
To assess the effect of trunk motion, the first 10 subjects had a second sensor on the trunk. The data recorded from this sensor showed negligible thoracic movement following the proposed protocol. Considering that the purpose of this study is to create a single sensor system that reduces the barrier to clinical translation, it was not desired for the analysis to rely on the presence of this second sensor, and therefore, no extra sensor was used for the remainder of the trials.
Elastic headband with one Shimmer IMU. The axis directions of the IMU are shown in the Left. The reference system for the head was defined as z+ as anterior, y+ as left and x- as superior. Diagram of the neck circumduction movement and the neck circumduction model. 1 and 5 are neutral positions, 2 and 4 are flexion extremity point, 3 is extension extremity point. The neck circumduction movements started in the neutral position (1), followed by neck flexion (2), followed by an arc-shaped motion through lateral bending, extension (3), and flexion (4). Lastly, the head was returned to the neutral position (5).

Data recording and processing
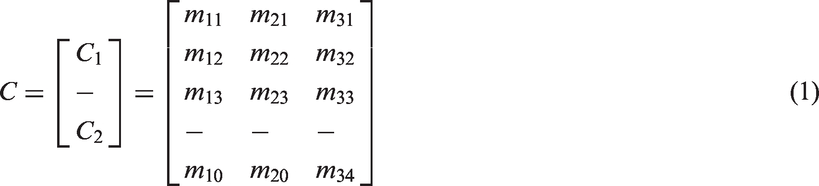
All data were recorded directly to a laptop PC through Bluetooth communication using commercial software (Multi Shimmer Sync for Windows v2.7, Shimmer Research, Dublin, Ireland). Motion data were sampled at 512 Hz. Data processing and analyses were performed offline using MATLAB software (Version R2013a, The Mathworks, Inc., Natick, MA). The first data analysis step involved calibrating the Shimmer sensors with respect to gravity to acquire accurate measurement. This was performed using the following equations


Following the calibration, a preliminary fast Fourier transform (FFT) was performed on all data sets to extract the frequency characteristics of the data (Figure 3). Along with the use of the signal-to-noise ratio FFT of both healthy control group and pain neck group. The red, green, and yellow curves represent the power attenuation contour at 10, 5, and 3% of the peak power. The color bar indicates the signal’s power value.
Quantitative analysis of the kinematic measurement
Six quantitative metrics and one kinematic model are introduced in this paper. The quantitative metrics are: cycle time, magnitude of circumduction vectors (MCV) for flexion/extension and lateral bending, Peak Difference of the Extremity Points (flexion/extension and lateral bending) in relative MCV, and number of jerk peaks (NJP), as discussed below. In addition to these metrics, the peak cardinal plane ROM from neck circumduction motion was calculated as the angle difference between the vectors at an extremity point and the neutral position.
Cycle time
The cycle time was calculated as the duration of the full neck circumduction movement in one direction (Figure 2). For purposes of consistency, these analyses used the data captured from the fastest (shortest cycle time) of the two trials.
MCVs
The MCV was defined as the magnitude of the difference between the vectors at the opposite extremity points on the neck circumduction trajectory (equation (2), 1: flexion/extension, 2: left/right side bend). The intersection points on the filtered circumduction trajectory with the sagittal and frontal planes were chosen as the extremity points.

Since the circumduction trajectory consists of two flexion extremity points (points 2 and 4 in Figure 2), the higher MCVfe value was selected for further analysis. A larger neck circumduction trajectory was expected to have larger MCVfe or MCVlr, therefore, this metric reflects the range of the circumduction motion.
Peak difference of the extremity points in relative MCV
The relative MCV (rMCV) was defined as the magnitude of the difference between each point on the acceleration trajectory and the acceleration at the neutral position


The rMCV for control participants consists of three distinct peaks (Figure 4): the first flexion extremity point, the extension extremity point, and the second flexion extremity point. The lateral bending motions occur between these peaks.
Diagram of the relative circumduction vectors magnitude during the full circumduction motion. The purple curve shows the shape of rCVM during a full circumduction motion, and the black arrows indicate the sequence of a circumduction motion. The green points represent the flexion extremity point, the blue point represents the extension extremity point. The beginning and end of the circumduction motion are denoted t0 and tn, respectively.
NJPs
The NJP was calculated as the number of peaks in the first derivative of the rMCV. The peak was selected as the largest local maxima in the first derivative of the rMCV with a minimum peak-to-peak distance of 20 data points (40 ms). The time window is limited by the beginning time (t0) and finish time (tn) of a neck circumduction motion. For comparison purposes with an established metric, the normalized jerk index (NJI)
28
was also calculated as

Healthy neck circumduction model
Finally, a mathematical model was developed based on a typical conical model in the form of a trigonometric function. To implement the difference between flexion and extension ROM in a neck circumduction trajectory, two half-conical models were used (equations 6 and 7). These two halves are joined together at the extremity positions of the left and right side lateral bendings, as follows


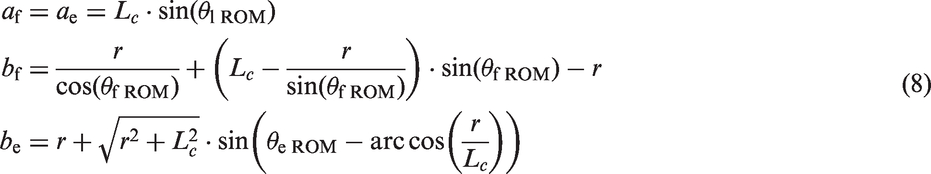
To evaluate the performance of the model, data fitting was conducted using the data from both the control and neck pain groups. The fitting error is calculated as the root mean square magnitude of the difference between the fitted model and the data set.
Statistical analysis
Processed data were first checked for normality using the Shapiro-Wilk test, where p < 0.05 indicated significant deviation from normality. Between-group comparisons were first tested using a two-tailed Mann-Whitney U test with alpha error rate set at 5% (p < 0.05) and no correction for multiple comparisons at this stage of development. Discriminative validity of the quantitative metrics was explored by creating a receiver-operating characteristic (ROC) curve for each metric (plotting Sensitivity against 1-Specificity for discriminating between health and neck pain groups), and the area under the curve (AUC) was calculated. An AUC of 0.50 indicates no ability to discriminate between groups greater than chance, while a value of 1.0 indicates perfect discriminative validity. A t test was used to determine statistical significance. All statistical analyses were performed using the IBM Statistical Package for the Social Sciences (SPSS v.24, SPSS Inc., Chicago, IL, USA).
Results
For this proof-of-concept study, 28 clinical participants with neck pain and 23 healthy controls were recruited. Table 1 presents the characteristics of the two groups. Figure 5 shows the 3D view of the neck circumduction trajectories of a representative control subject and a participant with neck pain. The original orientation of each set was transformed, such that the long axis of the trajectory (green dashed line connecting the flexion and extension extremity points), and the short axis (purple dashed line connecting the two lateral bending extremity points) are in parallel with the x and y axes of the world frame. Since the orientation of each data set in Figure 5 is transformed, the data became unitless and has meaning in relative terms only.
Two exemplar neck circumduction movements from the neck pain and control groups. The starting points of both neck circumduction movements and the axes were aligned to assist with visual comparison. The green and purple dashed lines represent the major axis and minor axis of the neck circumduction movements for the control participant. The top left figure presents the neck circumduction movements in 3D configuration, the top right, bottom left, and bottom right figures present the neck circumduction trajectories projected onto 2D planes. The value of each data point is unitless and has meaning in relative terms only. Demographic features, pain characteristics, and neck disability index (NDI) of participants in the study.

Peak cardinal plane motion
The distribution of ROM for each plane is given in Figure 6. The data were normally distributed according to Shapiro-Wilk test (p > 0.05) but two outliers were present in flexion and one in right bending that were not removed. A t test showed statistically significant differences (p < 0.05) in cardinal plane ROM in all four directions of peak cervical movement. These results were expected and used partly to lend confidence to the measurement tool’s ability to capture important differences between the two known groups before proceeding with subsequent analyses.
Boxplot of the ROMs of both groups. Mann-Whitney U test showed significant difference in each ROM comparison. All differences between groups were significant at the p < 0.05 level.
Cycle time
The neck circumduction completion times (cycle time) are shown graphically in Figure 7. The starting time and finishing time are labeled as t0 and tn (Figure 7, Top). Total self-paced cycle time was significantly greater in the neck pain group compared to the control group (p < 0.05), despite a smaller overall total path of movement in the neck pain group. The AUC for the cycle time was 0.78 (95% CI [0.66, 0.91]).
Metric 1: Cycle time. The top figures (Left: control; Right: Neck pain) show the gravitational accelerations in the three axes during a sample neck circumduction trajectory. The starting time is labeled as t0 and the finishing time is labeled as tn. The bottom figures show the distribution of the cycle time of the two groups, p < 0.05.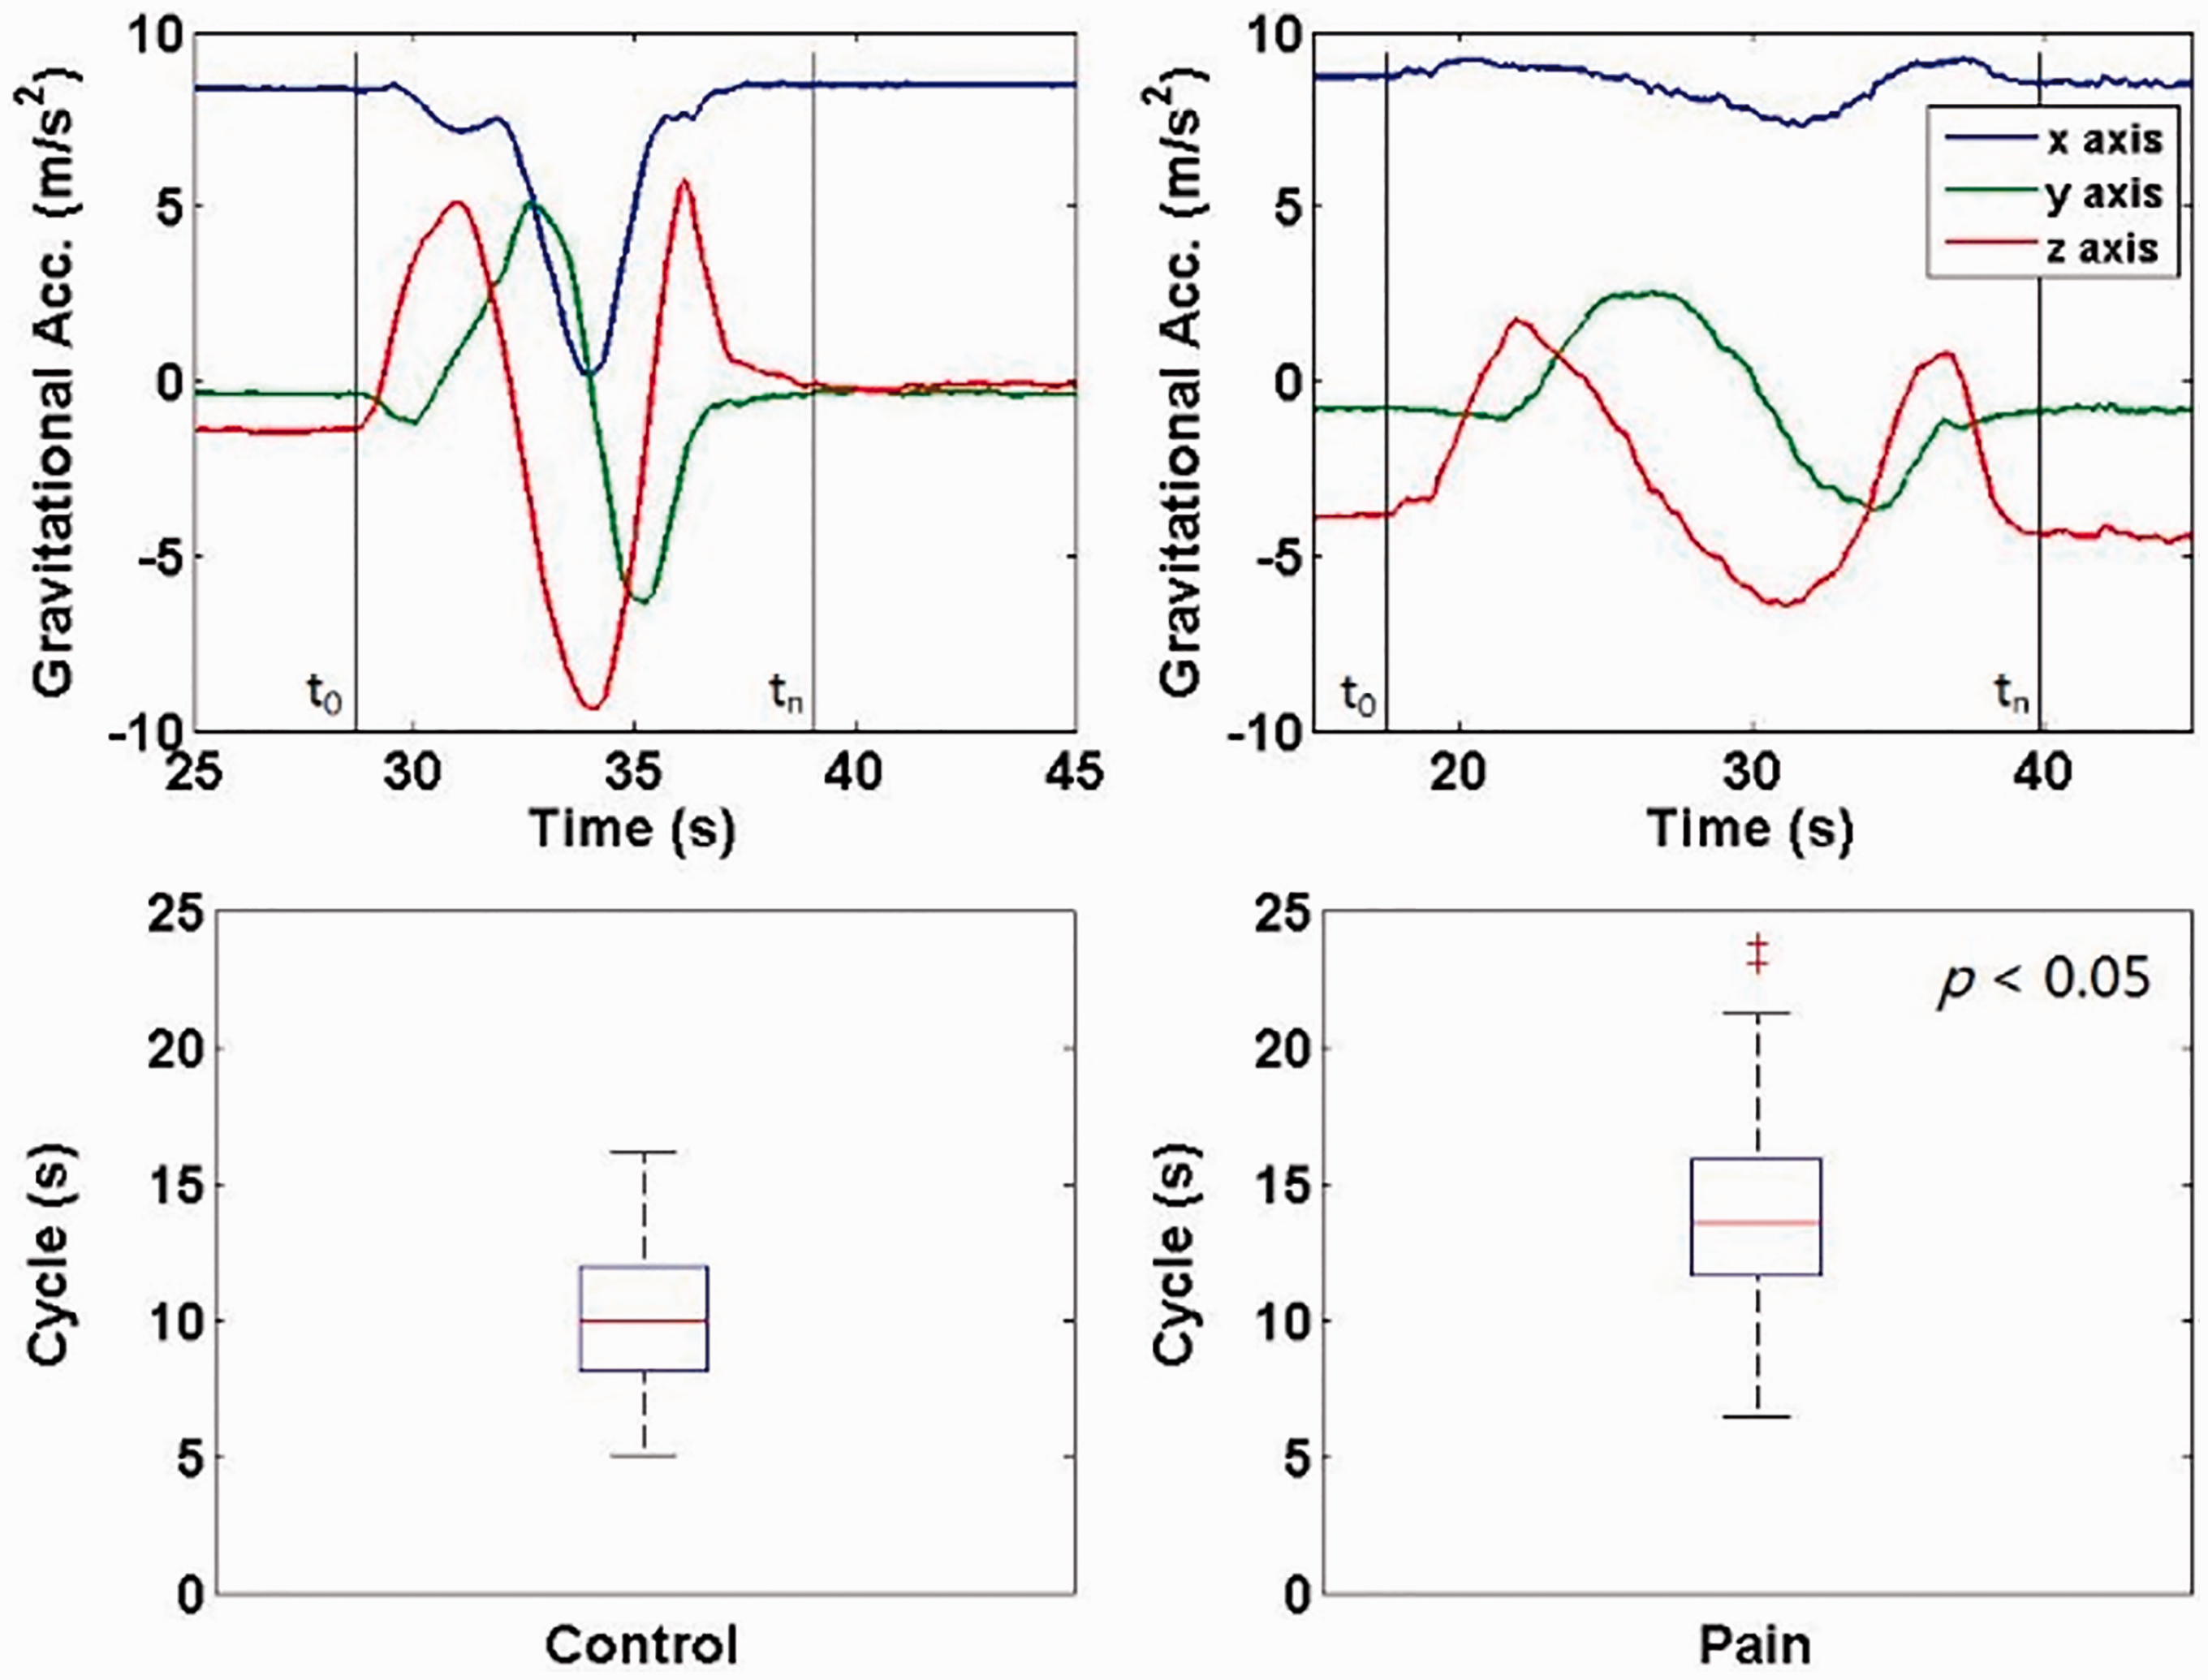
MCVs
Figure 8 presents boxplots of MCV for the sagittal (flexion/extension) vector (MCVfe) and the frontal (left/right side bend) vector (MCVlr). Both MCVfe and MCVlr were significantly different between the healthy control and neck pain groups (p < 0.05). The AUC for MCVfe was 0.95 (95% CI [0.90, 1.00]) and for MCVlr was 0.83 (95% CI [0.71, 0.95]).
Left: MCV difference between flexion and extension. Right: MCV difference between two lateral bending extremity points, significant differences were obtained for both metrics, p < 0.0001.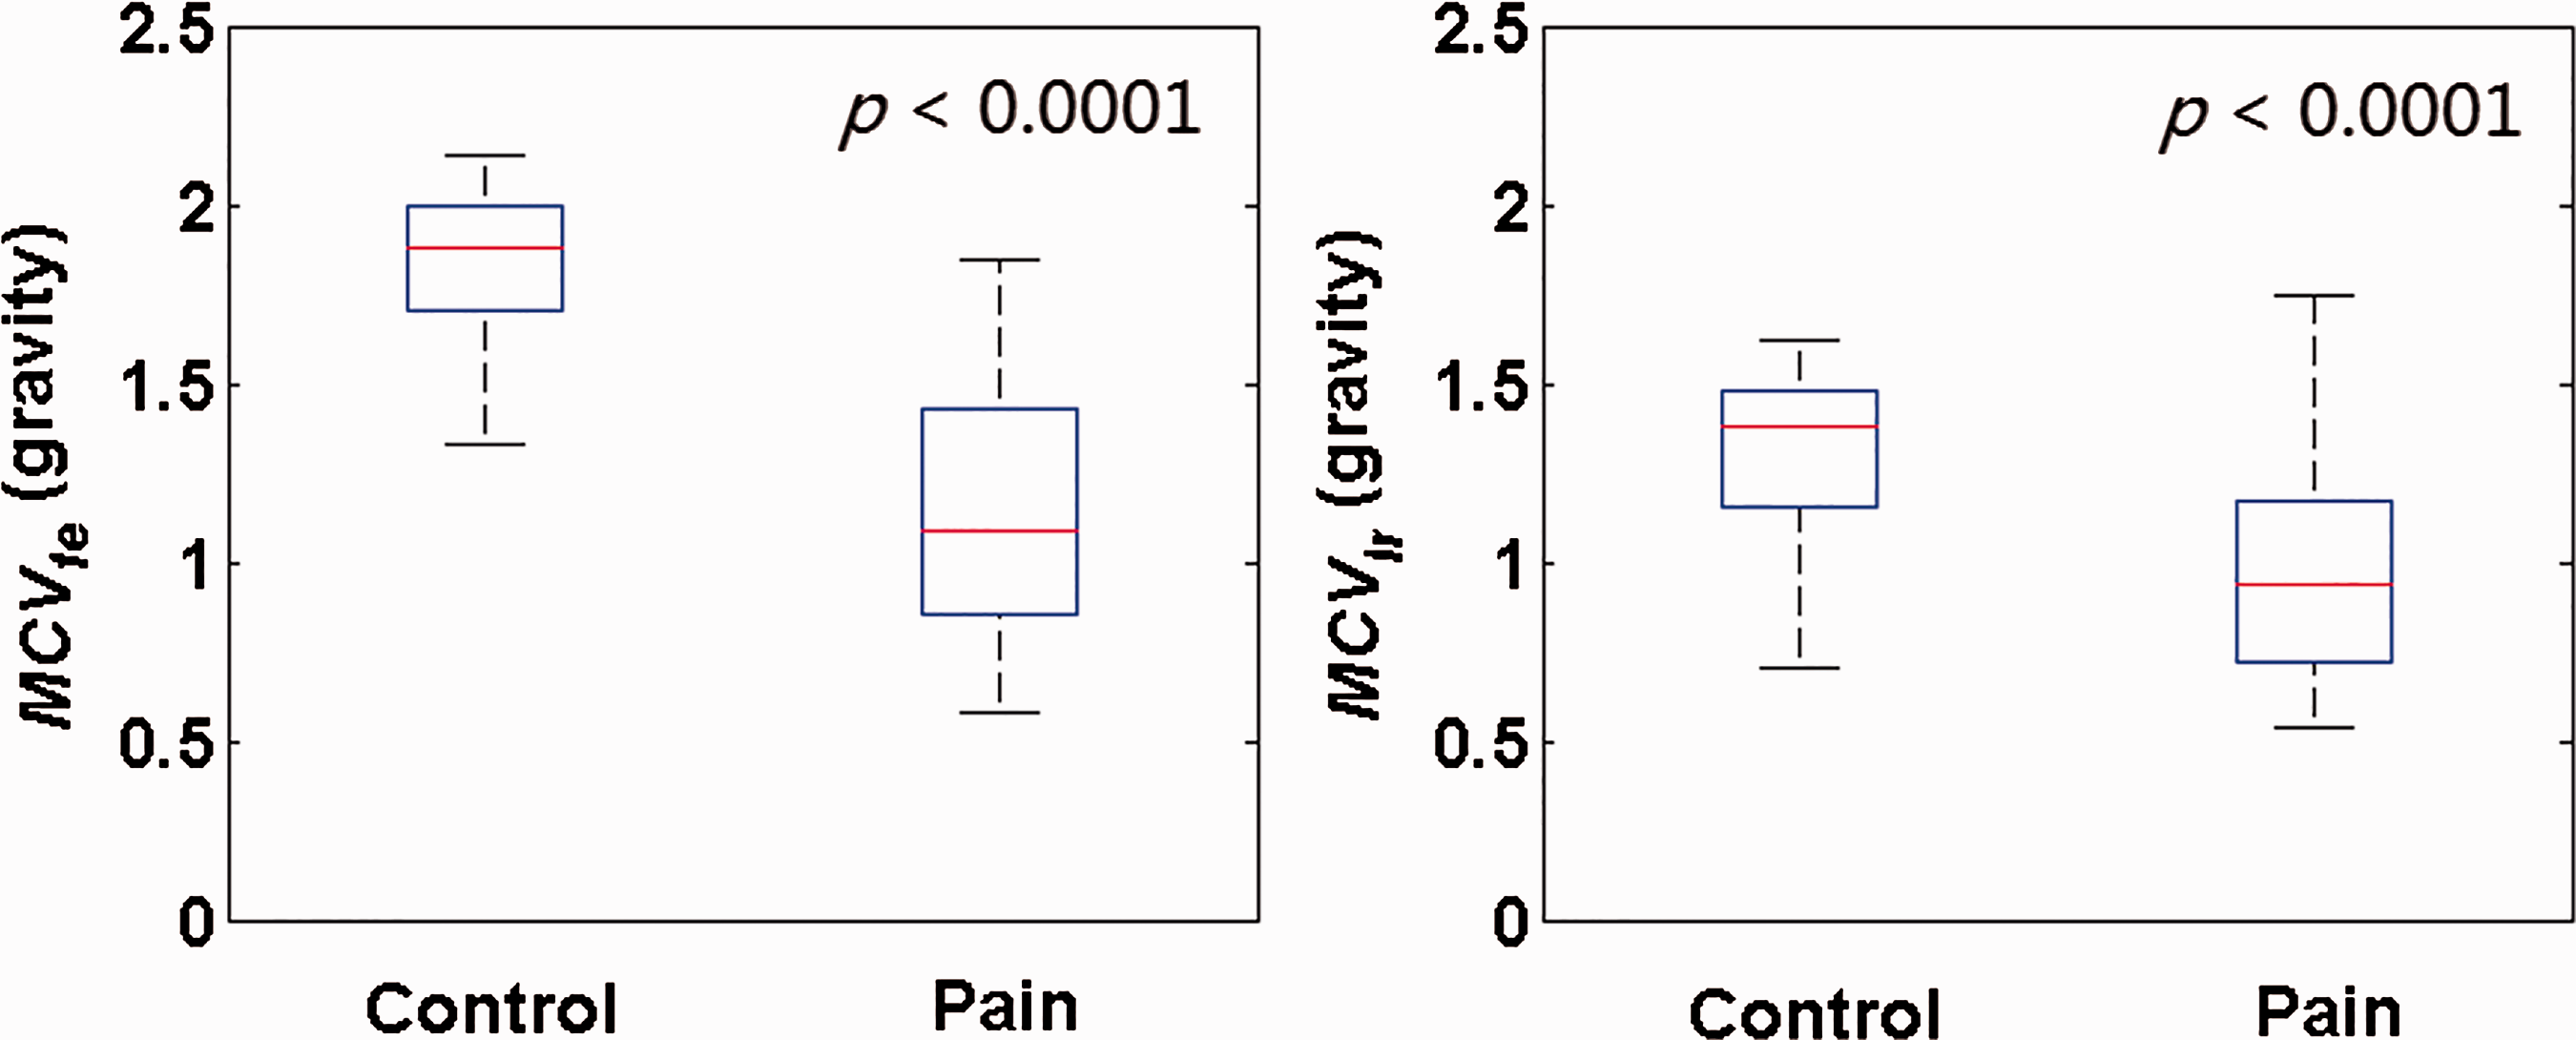
rMCV
Two rMCV trajectories are shown in Figure 9. The top left shows a representative trace from a control subject, which is close to the ideal shape of rMCV (see Figure 4). The second peak from the left was used to substitute rMCVe in equation (5), and the rMCVf_max uses the higher value between the first peak and third peak. The right trace is from a representative participant with neck pain showing a lower second peak than the first and third (less extension than flexion). The distributions of the rMCVef and rMCVlr from all subjects in each group are shown at the bottom in Figure 9. For rMCVef, the mean values were significantly different between the two groups (p < 0.05) with AUC = 0.94 (95% CI [0.88, 1.00]). For rMCVlr, a trend to significant difference between the two groups was found (p = 0.07) with AUC = 0.65 (95% CI [0.40, 0.80]).
Metric 3: the rMCV difference between vectors at the opposite extremity points. Top figures show two rMCVs from both groups. The red triangles represent the extension (middle) and flexion (left and right) extremity points. Bottom figures show the boxplots of the rMCVef, p < 0.0001 and rMCVlr, p = 0.067.
NJP
The NJP from both groups are shown in the top figures in Figure 10. The rMCV and the first derivative of the rMCV are shown in the blue and red curves. The peaks (jerk) occurring in the rMCV within a neck circumduction cycle are labeled as yellow triangles. The bottom left figure shows the statistical distribution of the NJP from both groups. Mean (±SD) NJP are 10 ± 4 (control) and 20 ± 7 (neck pain). The differences between these two groups were significant (p < 0.05) with AUC = 0.89 (95% CI [0.80, 0.98]).
Metric 4: NJP. Top figures show the jerk peaks, which are labeled as yellow triangles, within a neck circumduction movement. Bottom figures show the comparison between the NJP and NJI. For the same data sets, NJI failed to show a significant difference (p = 0.078).
For comparison, the distribution of the NJI is shown in the bottom right figure in Figure 10. NJI in the two groups was highly skewed (Shapiro-Wilks <0.05) so a square root transformation was used to avoid spurious findings (Figure 11). The mean NJI between the two groups was not statistically significant (p = 0.51) with AUC = 0.55 (95% CI [0.40, 0.71]). The differences between these two groups were not significant (p = 0.08).
Histogram of the NJI and square root of the NJI.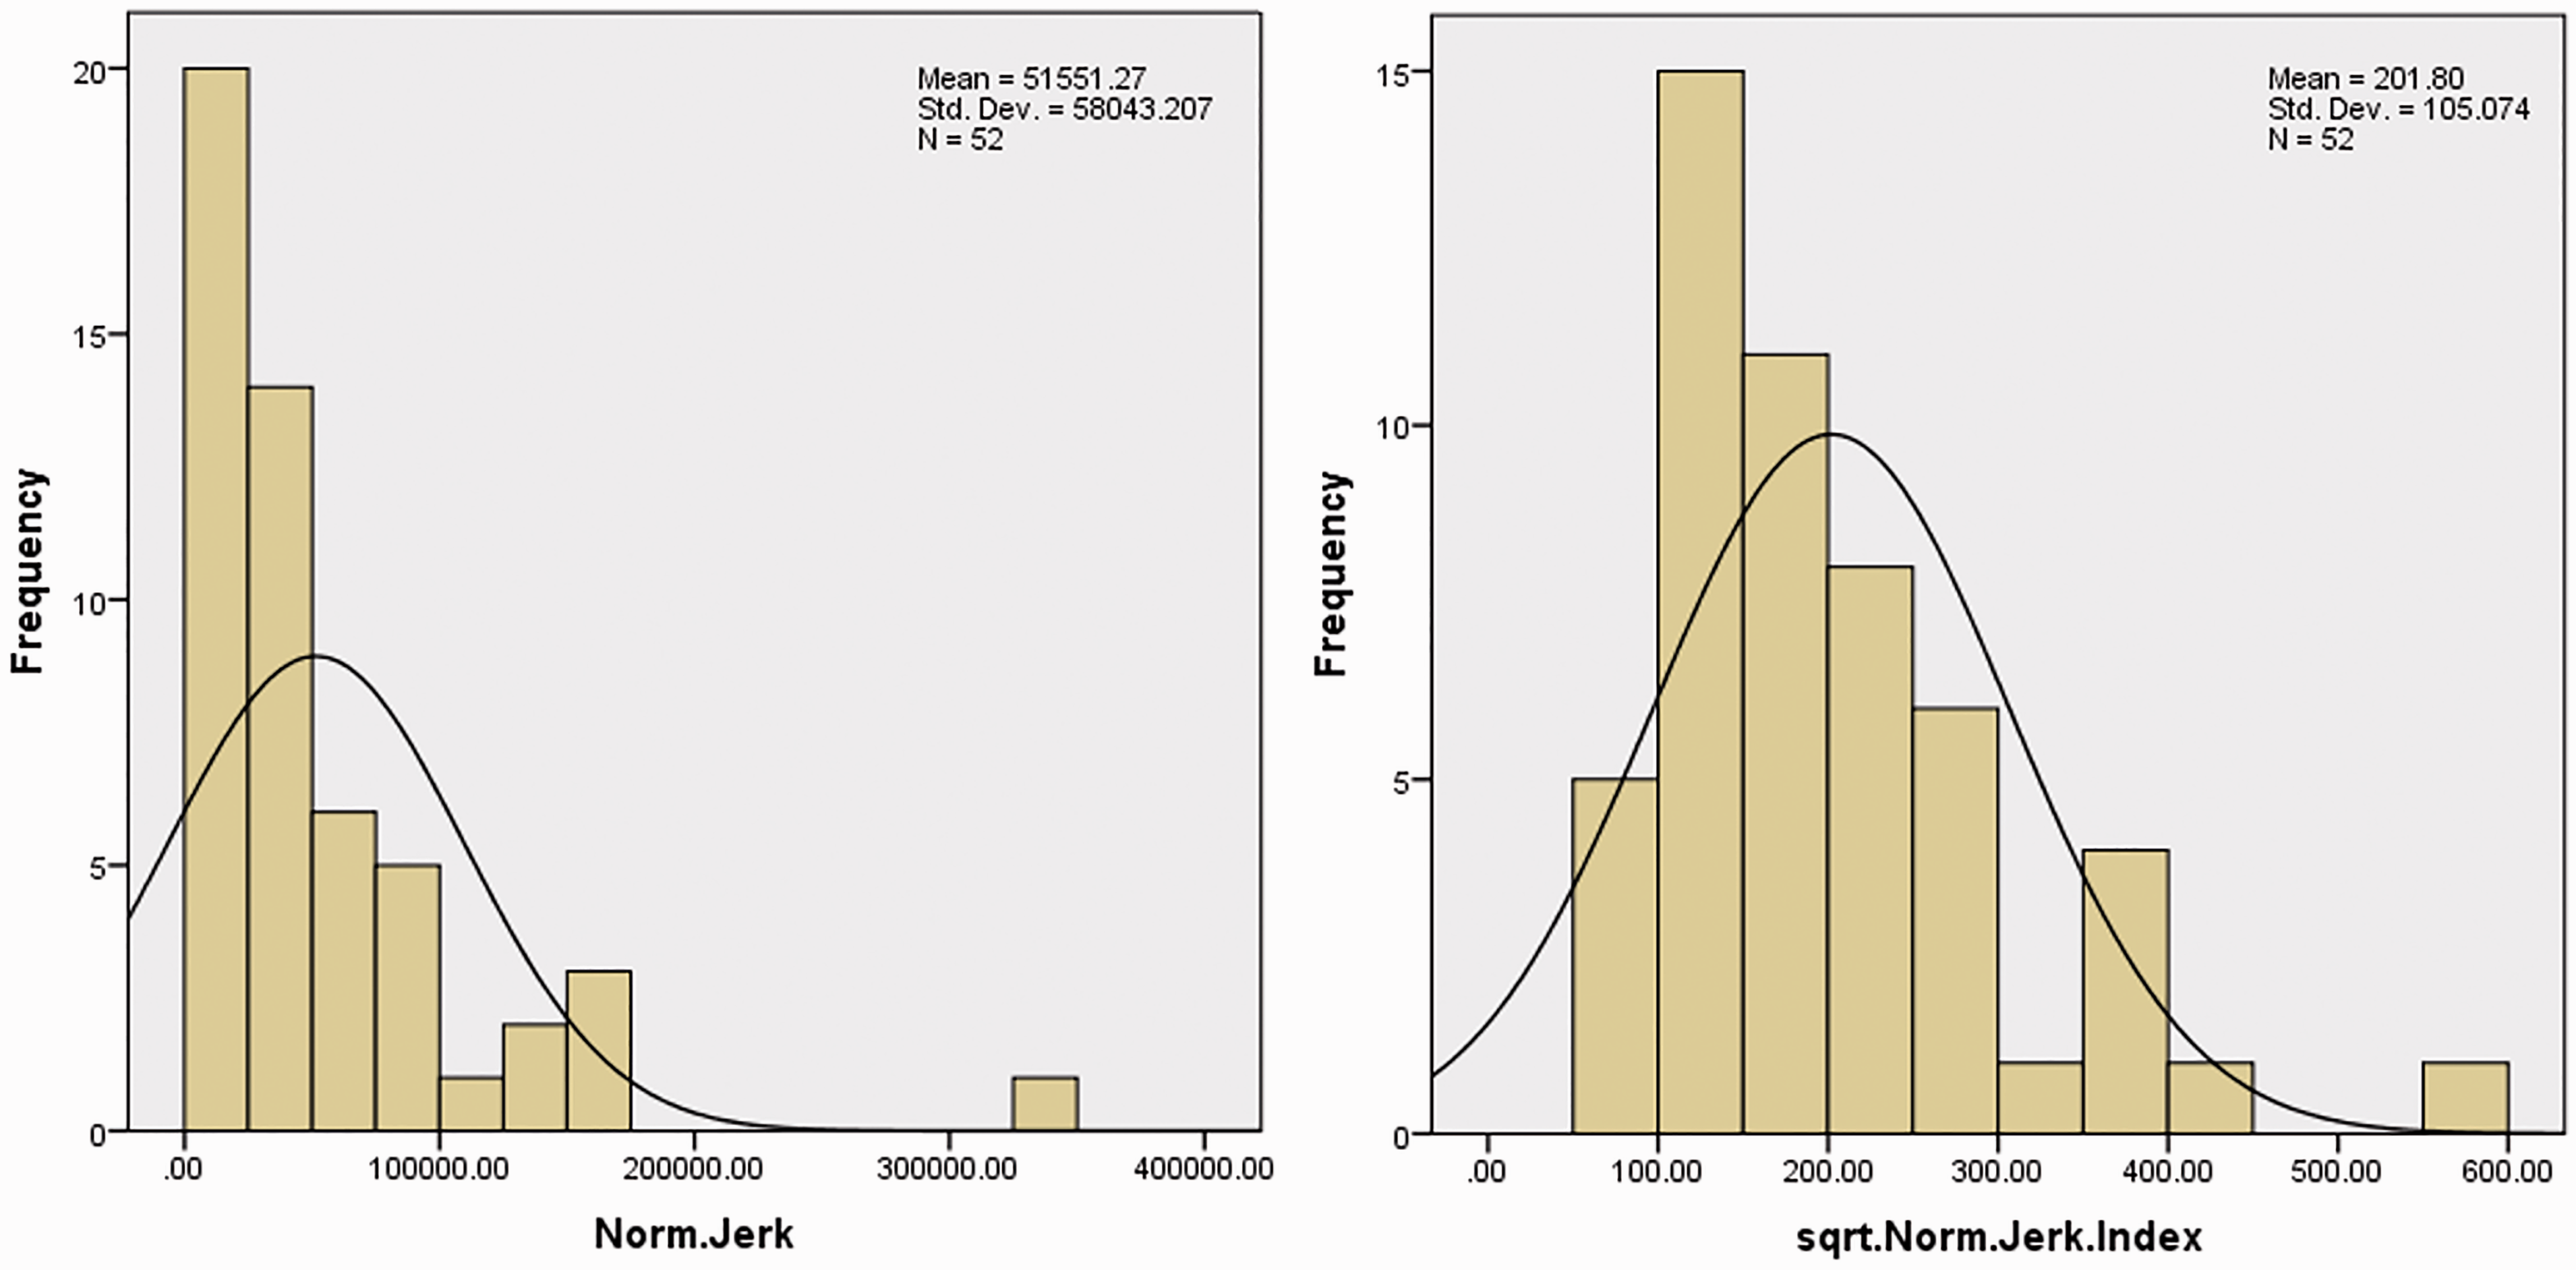
Derivation of a neck circumduction model
To evaluate the performance of the model on simulating the neck circumduction trajectory, a parametric sweep was conducted in MATLAB, and the simulated neck circumduction trajectory was compared with the recorded neck circumduction trajectory to calculate error magnitude. During the entire sweep, only the parametric set with respect to the minimum error magnitude was adopted as the best fit. According to the results shown in Figure 6, the range of each parameter is given as follows, be and bf ∈ [10, 60] with an increment of 1, ae = af ∈ [10, 60] with an increment of 1, θf ROM ∈ [10, 80] with an increment of 2, θe ROM ∈ [10, 80] with an increment of 2, and θl ROM ∈ [10, 70] with an increment of 2.
Figure 12 shows two actual neck circumduction trajectories from representative subjects in the two groups (blue), superimposed upon their corresponding circumduction trajectories simulated from the mathematical model (red). The trajectory from starting position to flexion extremity position was not simulated in the model. Figure 13 shows the distribution of RMS-based fit error magnitudes of both groups. The control group showed significantly lower fit error than the neck pain group (19° ± 10° and 26° ± 10° for the control group and neck pain group, p < 0.05). This result indicates that the proposed model can distinguish the neck circumduction trajectory between control and neck pain groups. Figure 14 shows the ROC curves of all of the indexes. All metrics have been arranged in the order of high-to-low by AUC (Table 2).
Diagram of the neck circumduction trajectories from simulation and the participants. One healthy neck circumduction trajectory is shown in the top figure, one neck pain circumduction trajectory is on the bottom. The blue curves represent the data recorded from the trial, the red curves represent the outputs of the neck circumduction trajectory model with the best fit to the data sets. The unit is degree. Fit error magnitude, significant differences were obtained for both metrics, p = 0.007. OC curve of all diagnostic metrics. AUC comparison of each metric. AUC: area under the curve; MCV: magnitude of circumduction vector; NJI: normalized jerk index; NJP: number of jerk peaks; SD: standard deviation.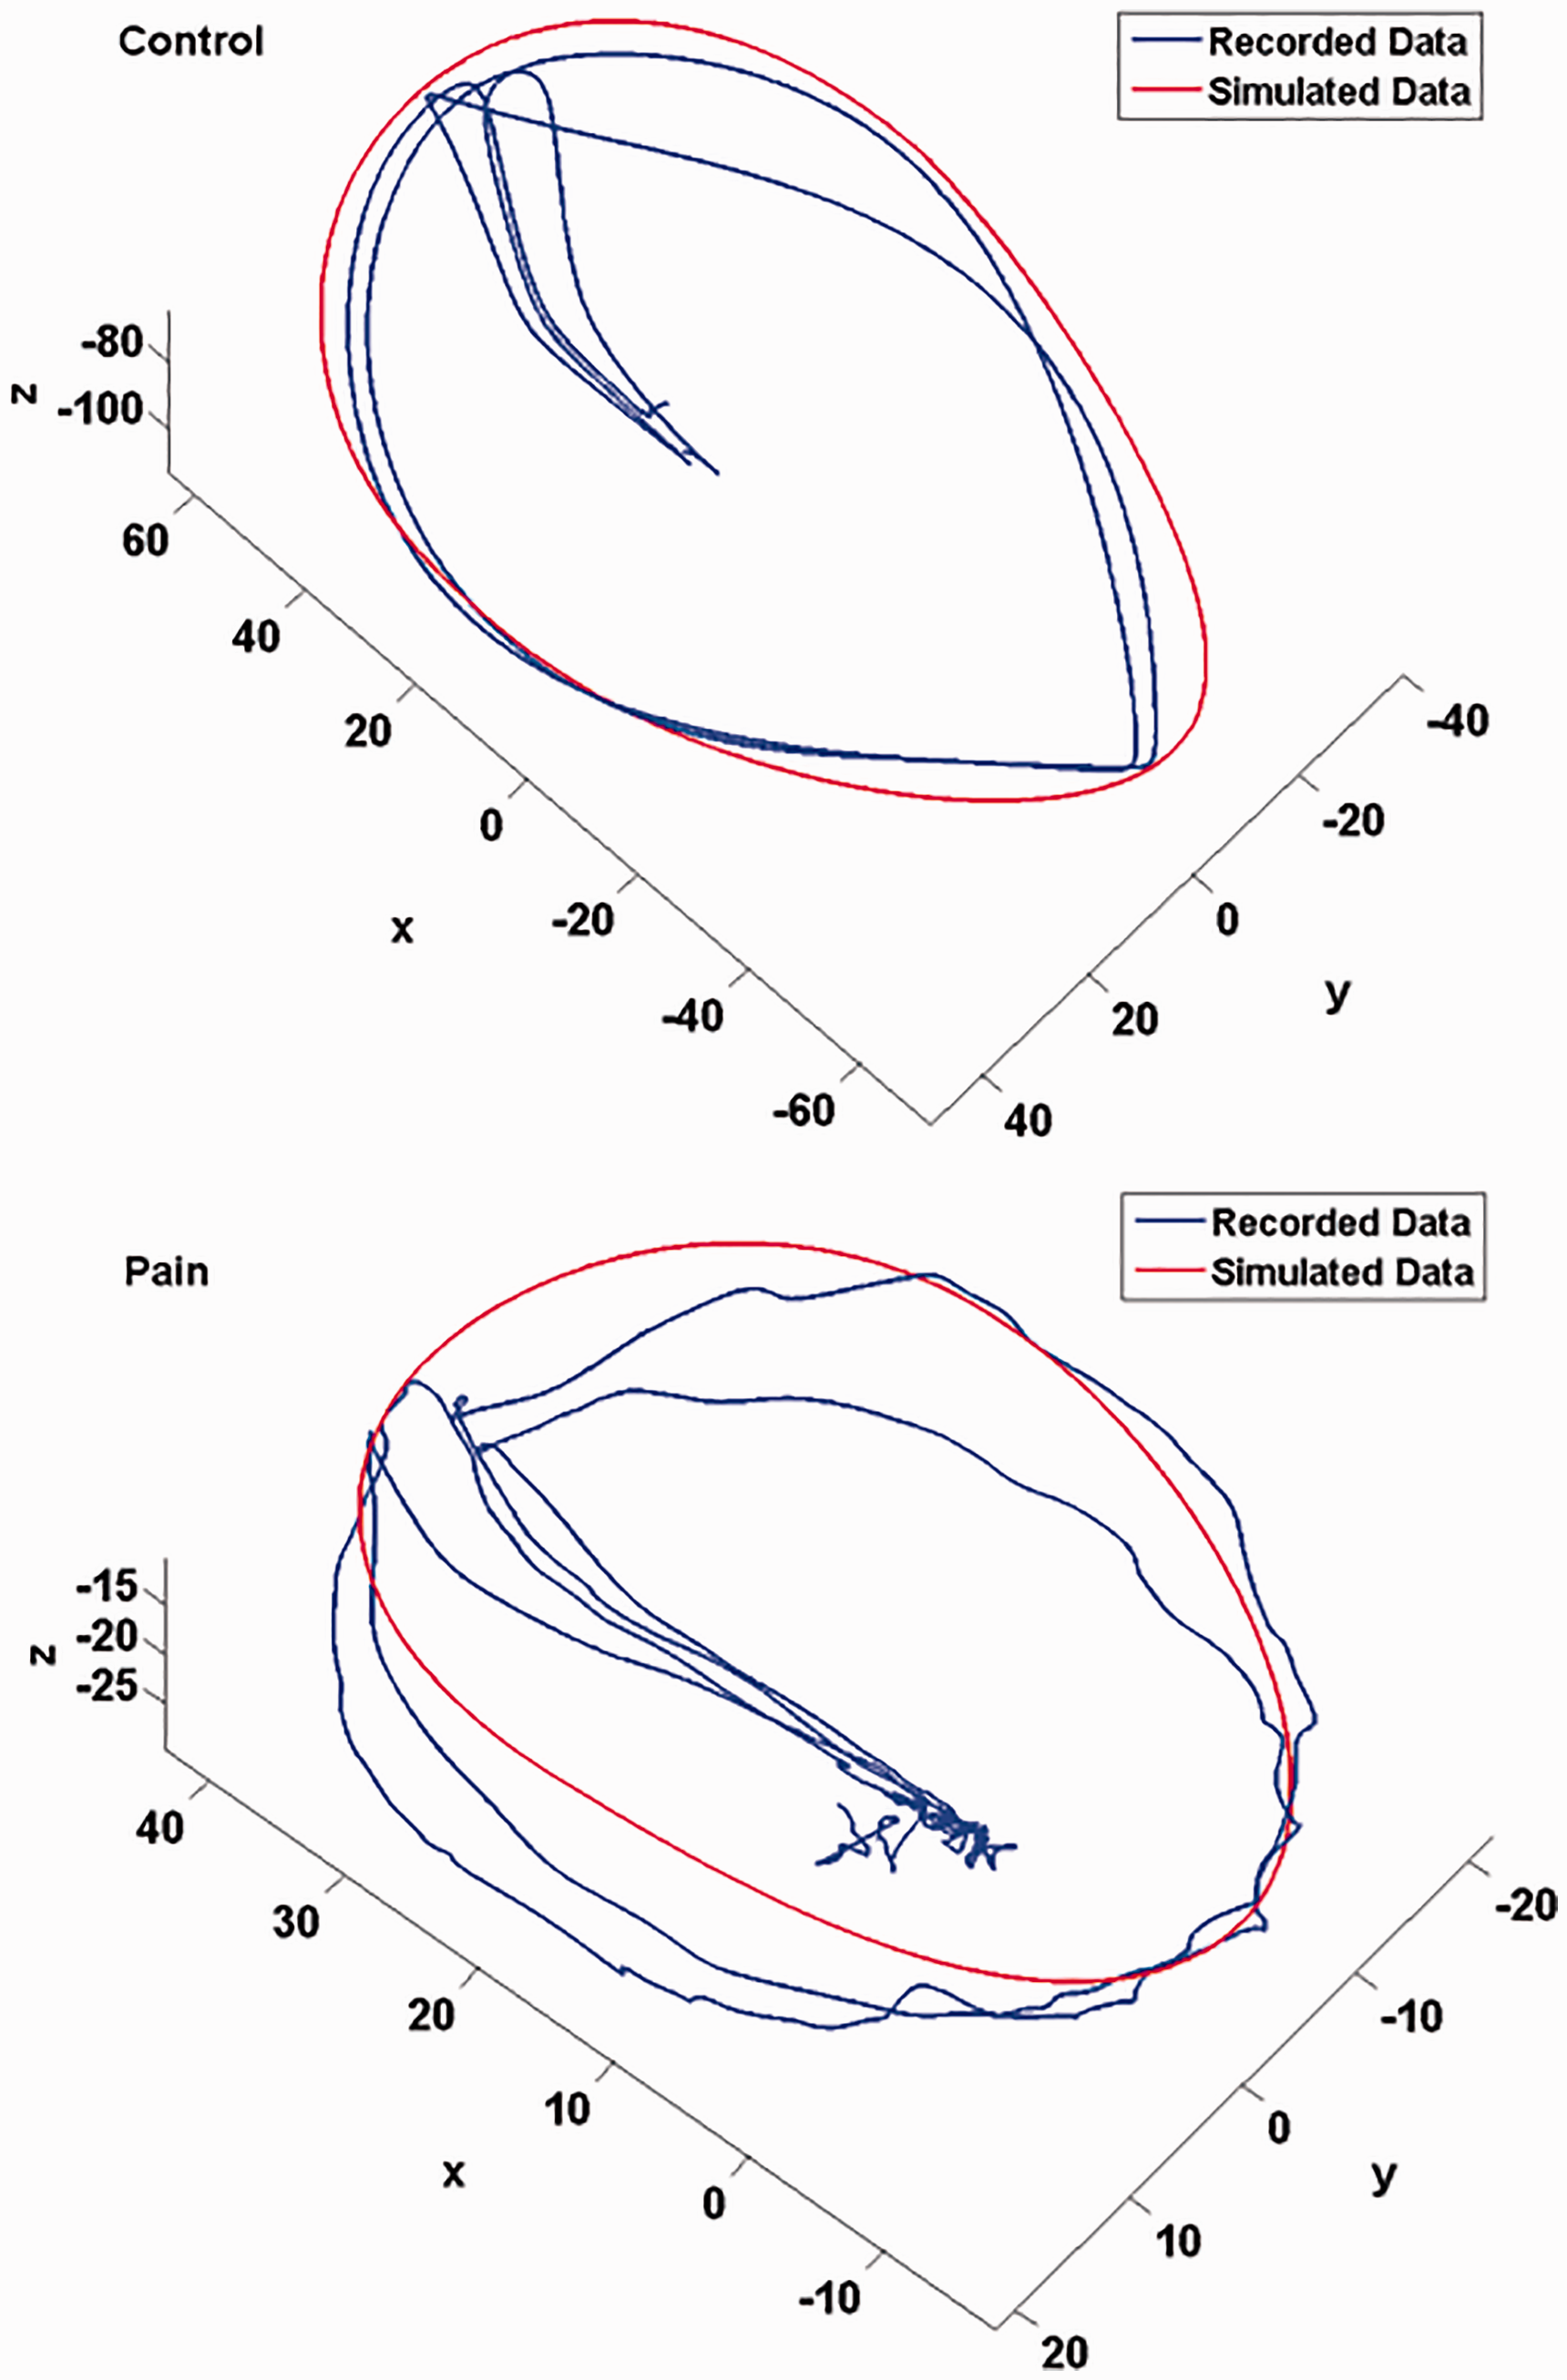


Discussion
This study has described a new method for multiplanar assessment of neck kinematics using a simple wearable triaxial IMU embedded within a customized headband. The intention was to identify those metrics that are best able to discriminate between two groups of participants, one with and one without current neck pain. The use of cervical circumduction as a new mobility-based assessment is novel insofar as the majority of neck motion assessment to date has been conducted in straight planes (sagittal, frontal, and horizontal) using digital or analog inclinometers or (in lab-based settings) infra-red 3D motion capture systems. Through use of a relatively inexpensive motion capture sensor, and circumduction as a multiplanar assessment of mobility, new and potentially important metrics have been presented that may be more sensitive to mobility problems and recovery as development of the testing protocol continues.
Characteristics of the neck circumduction trajectory
ROM of the circumduction trajectory is characterized by the angle differences at the flexion, extension and lateral bending extremity points with respect to the neutral position. Even a cursory qualitative evaluation of Figure 5 clearly reveals that ROM, smoothness, symmetry, and regularity of the trajectory are lower in the participant with neck pain compared to the control subject. This discussion point is solely supported by a figure that includes data from one exemplar individual with neck pain, and one control. Since those who have cervical radiculopathy were excluded from this study, the jerky motion is unlikely a result of neurological impairment. This may represent articular dysfunction, cervical muscle coordination problems, psychological aversion to pain, or some other mechanism yet to be determined. Moreover, the age difference between two groups may also contribute to the difference in ROM.
One potentially interesting use for this type of assessment in those with neck pain is the ability to tailor treatment based on specific movement patterns. We expect that with further exploration in larger samples, movement-based clinical phenotypes based on the metrics found herein (peak motion, motion smoothness, deviation from the predicted model) will emerge. These phenotypes could be used in diagnosis or treatment planning. This is a planned direction for future study.
Kinematic differentiation of neck condition
Those in the neck pain group took significantly longer to complete the circumduction cycles than did the healthy controls by a mean of 3.9 s. This is an interesting finding and one that likely requires greater exploration to determine its value. In the literature, some studies23,24 have suggested that unconstrained neck movements in people with neck pain have a lower peak velocity than healthy controls. Others 18 have suggested that there is no difference in peak velocity. Considering the close relationship among movement displacement, time, and velocity, the main reason that these parameters differ in those with neck pain and healthy controls has not yet been determined. Participants in our study were free to choose their own movement velocity, with instructions to move as far as possible at a smooth and consistent rate. The movement was first demonstrated by the researchers using a smooth and consistent motion of about 8 s duration. A future experimental condition to test would be a participant encouraged to perform the movement as quickly as possible. By doing so, a participant might reduce their total movement amplitude in favor of a reduced time window. Amplitude over speed was emphasized in this study, but the results indicate that cycle time may be a sensitive metric for discriminating between groups and for evaluating change in the condition. It is premature to speculate on mechanisms for the longer duration, but clinical experience suggests that those with neck pain move slowly to avoid flaring their symptoms.
The MCV was proposed as a potential index for discrimination. It reflects the magnitude of a vector formed by two points on a trajectory. Findings of the neck circumduction ROM in this study indicate that the difference in ROM between two groups is greater in the sagittal (flexion and extension) plane than in the frontal (lateral bending) plane. This leads to a testable hypothesis that the MCV of two points from the sagittal plane may be more sensitive to the presence of neck pain than lateral bending. This is consistent with recent work from Meisingset and colleagues 29 who found that of several parameters tested, only cervical mobility in the flexion/extension direction was significantly associated with neck pain and disability.
The MCV provides a general sense of the dimension of a neck circumduction trajectory. In contrast to the absolute values used in the MCVfe, the unitless rMCVef shows the proportion of the flexion and extension ROM in a neck circumduction trajectory. The resultant distributions of the rMCVef of both groups (Figure 9) revealed that, among the three peaks of rMCV, the second peak (extension extremity) was the highest value in the control group and the lowest value in the neck pain group. In contrast to the control group, the neck pain group therefore demonstrated a higher restriction in extension than flexion. This result is in agreement with the ROM measurements from other studies30,31 and further strengthens limited cervical extension as an important metric in neck pain assessment.
The smoothness of neck motion has been used extensively in analysis and diagnosis of neck kinematic conditions.32–37 Some studies32,33 showed that the NJI can be used as an effective tool for analyzing neck motions. However, other researchers have concluded that the NJI might not be adequately sensitive enough to distinguish patients with neck pain from healthy controls.35–39 Additionally, the NJI may not be suitable for analysis of self-paced movements since it is a speed-dependent variable; 38 the estimation of the NJI may be highly contaminated by noise and highly dependent on the smoothing technique used; 39 and the NJI may not achieve consistent fidelity for every neck pain condition. Previous research has shown that the neck motion is jerkier for people with neurological disorders that generate intrinsic oscillation, such as tremor. 40 Hence, while the NJI may be an option for use in motor control issues, it is likely not appropriate as a general metric.
To address the disadvantages of the NJI, this paper presents a new metric termed NJP that appears to better distinguish between pain and control groups by counting the number of peaks in the first derivative of the rMCV. This approach removes the influence of movement duration and distance when quantifying jerk. The inability to detect a significant difference between two groups in the NJI may be caused by the influence of the movement duration and distance, as the majority of motion that is relatively smooth dilutes the significance of the few points in the neck circumduction trajectory where pain occurs which is thought to be the mechanism producing jerk. The results suggest that NJI may not be sufficient for accurate assessment of smoothness of cervical motion.
We believe that the circumduction motion reflects a more real-world representation of neck dysfunction than conventional single planar motion. However, it should be noted that axial rotation is not represented in this motion. Axial rotation does occur as a conjoint (coupled) motion with side-flexion owing to the orientation of the cervical facet joints. We do not believe this is a significant limitation; when it has been studied in isolation, cervical extension is the component of cervical ROM that is most consistently associated with pain and disability,11,29 which is well-represented in the circumduction movement.
It has been shown that neck motion changes with age.41,42 To investigate whether age impacts the proposed metrics, a multivariate analysis with age as a covariate was performed. This revealed no significant interaction between and any of the variables (p = 0.112).
a proof-of-concept study, the reliability, resolution, validity, and relevance of the measurements and parameters proposed were not investigated. The intention in this paper is to report on the metrics and identify those best able to discriminate between a healthy and clinical sample (‘known groups’ validity). Therefore, based on the discussion above, a future study will be performed to investigate the reliability of the proposed methods on subjects with axial rotation limitations, to evaluate the usefulness of the combined motions within the circumduction trajectory (e.g. combined flexion/lateral bending, combine extension/lateral bending), and to study the associations between the most discriminative methods identified herein and clinical variables in a larger group of subjects.
Neck circumduction trajectory model
The visualization of the real and simulated neck circumduction trajectories overlapping each other shows a clear, visual distinction between the healthy neck circumduction trajectory and neck pain circumduction trajectory (Figure 12). The trajectory of neck circumduction movements in individuals without neck pain can be affected by a number of factors, such as neck length, relative configuration, and orientation of articular components of the cervical vertebrae, positioning of the sensor, etc. It is impossible to simulate all possible contextual influences especially where the intention is to translate the new metrics to clinical use. However, an adequately sound approximation of the movement has been derived, which appears to provide sufficient predictive accuracy with considerably reduced computational work load. For the model proposed in this study, the cervical vertebrae and the skull were considered as rigid bodies, and the projection of the movement onto the transversal plane was simplified as an ellipse. The simplified biological denotations were not investigated, due to the infinite combinations of Lc and r for an optimal fit to the recorded data. However, they provide a possible biological explanation for the proposed phenomenological model.
Optimal metrics for cervical motion assessment
This study proposed six metrics for cervical motion assessment, i.e. MCVfe, MCVlr, rMCVef, Cycle Time, NJP and the Neck Circumduction Trajectory Model fit error. All of these metrics were able to significantly discriminate between the control and neck pain groups. One additional metric (rMCVlr) did not adequately discriminate between the two groups.
Conclusion
This study proposed and evaluated six metrics and one neck circumduction trajectory model. The metrics all appear to be able to discriminate between the control and neck pain groups. Among all metrics, the MCVfe, rMCVef, and NJP are the most discriminative by virtue of AUC. These results provide proof-of-concept that novel metrics can be captured with relative ease in the clinical setting using an inexpensive wearable sensor headband. The neck circumduction trajectory model was evaluated with data from both groups, and it successfully distinguished the control group and the neck pain group. The derivation of this model opens new lines of inquiry into the clinical utility of cervical circumduction measurement, and could serve as the foundation for the development of a sensitive, quantifiable, and clinically appropriate neck evaluation strategy.
Footnotes
Declaration of conflicting interests
The author(s) declared no potential conflicts of interest with respect to the research, authorship, and/or publication of this article.
Funding
The author(s) disclosed receipt of the following financial support for the research, authorship, and/or publication of this article: This work was supported by the Donation from Kirwin Fryday Metcalf Lawyers; by the Lawson Health Research Institute Internal Research Fund; and by the Schulich School of Medicine and Dentistry Collaborative Research Seed Grant. These funding sources had no involvement in the work or in the preparation of the manuscript.
Guarantor
DMW
Contributorship
DMW researched literature, EL, JPD, DMW and ALT conceived the study. EL, JPD, DMW and ALT were involved in protocol development, and obtaining research ethics board approval. EL was involved in patient recruitment, DMW was involved in healthy participant recruitment and data collection for both groups. JPD, DMW and ALT interpreted the data, YZ wrote the data processing software, analyzed the data and wrote the manuscript. All authors reviewed and edited the manuscript and approved the final version of the manuscript.
Acknowledgement
The authors would like to thank all of the participants for their time and support in data collection.