
Abstract
Introduction
Exercise segmentation, the process of isolating individual repetitions from continuous time series measurement of human motion, is key to providing online feedback to patients during rehabilitation and enables the computation of useful metrics such as joint velocity and range of motion that are otherwise difficult to measure in the clinical setting.
Methods
This paper proposes a classifier-based approach, where the motion segmentation problem is formulated as a two-class classification problem, classifying between segment and non-segment points. The proposed approach does not require domain knowledge of the exercises and generalizes to groups of participants and exercises that were not part of the training set, allowing for more robustness in clinical applications.
Results
Using only data from healthy participants for training, the proposed algorithm achieves an average segmentation accuracy of 92% on a 30-participant healthy dataset and 87% on a 44-patient rehabilitation dataset.
Conclusion
A real-time approach for segmentation of rehabilitation exercises is proposed, based on two-class classification approach. The method is validated on both healthy and rehabilitation motion datasets and generalizes to a variety of demographics and exercises not part of the training set.
Introduction
Temporal segmentation, the process of dividing a continuous sequence of motion data into individual repetitions or motion primitives, allows an automated rehabilitation system to provide real-time feedback on the performance of each exercise repetition. The segmented data can then be used by clinicians to perform diagnosis and progress monitoring with automatically collected quantitative data. 1
To meet the requirements of the rehabilitation clinic, a suitable segmentation algorithm must be able to handle intra- and inter-participant variability. A priori movement data for a new patient are not likely to be available and thus any supervised algorithm must rely on healthy or other patient data for training. In comparison to healthy participants, patients may exhibit smaller range of motion, inconsistent velocity and compensatory movements, where, as a result of redundancy within the neuromusculoskeletal system, patients may utilize alternate muscles and joints to perform a prescribed motion they find difficult
2
(Figure 1). However, few of the existing segmentation algorithms have been tested on patient data.
3
Joint angle and velocity data of healthy (left) and rehabilitation (right) participants performing a knee extension exercise, illustrating hip extension (hip ext), hip abduction (hip abd), knee extension (knee ext) and the manual segments (man seg). These figures, with both vertical and horizontal axes at equal scaling, illustrate motions performed by a rehabilitation patient that are slower, have smaller velocities, and smaller range of motion. Some evidence of compensatory movement can also be seen here, where the patient motion in the knee is accompanied by hip extension. These variations mean techniques that are not validated with patient data may not necessarily generalize. Note that the manual segment definitions also differ slightly. In the healthy data, the manual segments (blue boxes) tend to lag velocity crossings due to human labelling reaction speed, while for the rehabilitation data, the manual segments tend to be on the velocity crossing due to the slower pace of motion. (a) Healthy participant data. (b) Rehabilitation patient data.
A segmentation algorithm should be able to handle both known exercises (motions in the training set) as well as generalize to novel exercises, since exercise regimens are often customized for each patient.
Current solutions to the motion segmentation problem 3 can be divided into two classes: (1) approaches that model the exercises using a template library and (2) approaches that model the segment edge points by assuming segment boundaries share common characteristics.
Among template-based methods, hidden Markov models (HMMs)4–6 are commonly used for motion segmentation, where each segment is considered to be a hidden state and the state sequence is recovered using the Viterbi algorithm. Regression-based techniques, where a piecewise linear fit is applied to the observation data and a segment declared when the error between the regression line and the data exceeds a threshold,7,8 have also been used. A third category of approaches uses dynamic time warping (DTW), where temporal and spatial variations between the template and the observed data are minimized by selectively altering the time scale to minimize the error, and segment on threshold.9,10 Lastly, classifier-based approaches have been applied, by extracting sequences of discretized data as segments. 11
Approaches that use template libraries can provide accurate segments. Some methods account for temporal and spatial variability by either modelling them stochastically or manipulate the time scale so that two sets of data can be compared, allowing these methods to handle human motion variability. However, these methods tend to be offline4,9,10 and cannot account for novel primitive types.
Segment edge point modelling methods learn or assume that data at segment boundaries will have certain characteristics, which are utilized to perform segmentation. Kinematic zero crossings (KZC) methods declare segments on velocity,12,13 acceleration, 14 jerk 15 or curvature 16 zero crossings as they denote turning points in the motion. These methods serve as a simple way to perform segmentation. Derived metrics, such as Euclidean17,18 and Mahalanobis distance, 19 signal variance,20,21 and likelihood tests 16 can also be used, where segments are declared when the metric distance between two subsequent data windows exceeds a given threshold.
Segment edge models tend to be defined based on heuristics, and rely on specific domain knowledge of the underlying data. There is often no mechanism to reject false positives, necessitating further post-processing. These algorithms can be employed online but may require offline training. 12
Proposed approach
This paper proposes a classifier approach for segmentation, where machine learning techniques are used to automatically extract segment edge characteristics. Normalization techniques are applied to improve similarity and generalizability between healthy training data and patient testing data and improve the segmentation accuracy.I
All data points are classified as either a segment point (p1) or a non-segment point (p0). This converts the task of temporal segmentation into a data classification task. If segment edge points share common features which are equivalent between different exercises, such as changes in velocity directions or changes in contact conditions, classifying all data points into either a p1 or p0 point allows the algorithm to handle motions and participants that have not been observed before. Rather than specifying features similar to the KZC-based methods,
22
the characteristics of a segment point are learned from the training data, the training data are annotated as either p1 and p0 points (Figure 2).
A time-series waveform of joint angles during a squatting exercise. This figure denotes the hip extension (hip ext), hip abduction (hip abd), knee extension (knee ext), the manual segments (man seg) and p1/p0 ground truth data generated from the manual segments (truth). The segments provided by a human observer (blue boxes) are expanded into multiple segment edge points (top blue lines) and non-segment points (bottom blue lines).
The proposed algorithm is illustrated in Figure 3. After pre-processing, principal component analysis (PCA)
23
is used to reduce the dimensionality and the computational cost. The dimensionally reduced data are used to train a support vector machine (SVM). The trained classifier is then used to classify the observation data.
Flow diagram of the algorithm.
Pre-processing
Normalizing
To reduce sensitivity to the starting pose, the initial value of each time-series can be removed such that the resting pose is always at zero, by applying an offset calculated from the mean value of the first 10 samples of each trajectory.
The data can also be rectified. Taking the absolute value of the joint angle data would allow motions that involve the same joints but moving in opposite directions to be recognized as one exercise, improving generalization.
Magnitude scaling, by dividing by the mean of the absolute peak values over all the segments in the time-series data, compensates for the varying joint angle ranges between healthy and patient data, as well as enables exercise generalization. However, the determination of this value requires the full observation set, which is impractical in clinical applications because the full observation sequence is not available a priori. For training, the scaling factor is calculated from the full dataset, while for testing, the scaling factor is calculated from only the first segment.
Temporal
Data points are interpolated to ensure even temporal spacing between time points; then the data points that are nstack around the time point being examined (tn) are concatenated into the current data point to incorporate temporal information before and after tn into the classifier.
Balancing
Imbalanced datasets can skew the classifier towards the class that has the most samples. To minimize this problem, data points nexp around manual segment points, as well as the data points between segments, are converted into p1 points, as they are similar to the manual segment point. Downsampling is also applied to p0 to further balance the dataset. A Gaussian sampling method was employed, where p0 points closer to p1 points have a higher chance of being sampled than p0 points that are not close to any p1 points. This is to include more data points that are close to the segmentation boundaries and thus are more likely to be misclassified (Figure 4). During testing, no downsampling is applied.
Knee extension training data, denoting the hip extension (hip ext), hip abduction (hip abd), knee extension (knee ext) and the sampled data for training (sampled). The blue points at y = 0 denote the training data selected for p0, sampled by Gaussian resampling, favouring non-segment points closer to the boundary. The blue points at y = 1 denote the training data selected for p1, which has no downsampling. The Gaussian covariance coefficient is reduced to show this effect more clearly.
Feature extraction
After the pre-processing steps, a feature extraction technique can be applied, to reduce the feature space dimensionality and decrease computational time. To achieve this, PCA is used. PCA is an orthogonal transformation algorithm that finds a projection to a new feature space, consisting of principal components (PCs) which are constructed to capture the maximum amount of variance and constrained such that all subsequent PCs are orthogonal to the previous ones. PCA is commonly used in conjunction with the scree plot method, 23 which is a plot that denotes the fraction of total variance in the data represented by each PC. By selecting a threshold in the amount of variance to be captured by the resulting projection and using only the PCs that explain the required level of variance, dimensional reduction is achieved.
Discriminative classifier
The data can now be used for training and classification. For the purposes of this paper, SVM 24 is used. SVM is a two-class classification algorithm where the training data are mapped to a higher dimensional kernel space, and a decision hyperplane is generated between the classes. SVM forms its decision hyperplane by selecting key training points, or support vectors, that form the hyperplane, such that the margins between the two classes are maximized. The SVM parameters are the slack variable C and the selection of the kernel. For this paper, the radial kernel is used.
Experimental validation
While many algorithms were designed with clinical applications in mind, few to date have been tested against patient populations or report specific segmentation results. 3 Three different datasets are used to validate the proposed approach: One collected from healthy participants and two from rehabilitation participants undergoing knee or hip total-joint replacement surgery. Two types of validations were performed: (1) cross-validation, to validate inter-participant generalization and (2) validation with known and novel exercises, to test for inter-exercise generalization.
Datasets
All three datasets were collected using three Shimmer accelerometer and gyroscope sensors 25 worn on the hip, knee and ankle. Using the measured accelerometer and gyroscope data, joint angles were estimated via the extended Kalman filter, 26 using a five-joint kinematic model, where the hip is modelled as a three-joint system with flexion/extension, abduction and internal rotation, and the knee is modelled as a two-joint system with flexion/extension and internal rotation. Poorly reconstructed data were removed from consideration.
The first dataset is a 30-healthy participant dataset (17 M, 13 F, μage = 24.4) 12 collected from the University of Waterloo (UW) student population, with 10 to 20 repetitions per exercise type. All participants were healthy and had no lower-body injuries for the six months prior to the data collection. Prior to data collection, participants were instructed on how to perform each motion. Motion capture data were collected simultaneously. The supine exercises collected were hip abduction, hip flexion, knee extension and knee/hip flexion. The seated exercises collected were knee extension and sit to stand. The standing exercises collected were gait, hip abduction, hip extension, marching, lunges and squats.
The second dataset is an 18-patient dataset (4 M, 14 F, μage = 73.8) 12 collected from the Toronto Rehabilitation Institute (TRI) musculoskeletal in-patient ward. All patients had undergone a hip or knee replacement surgery and were in TRI for post-surgical rehabilitation. These patients were tracked from the first day of admission until discharge, and had daily rehabilitation sessions, with an average stay length of two weeks. All the exercises collected were part of their prescribed routine; no exercises were modified or added for the data collection. The supine exercises collected were hip abduction, hip flexion, knee extension and knee/hip flexion. The seated exercises collected were knee extension and sit to stand. The standing exercises collected were gait, hip abduction, hip extension, knee flexion, marching, lunges and squats.
The third dataset is a 26-patient dataset (10 M, 16 F, μage = 66.7) 1 collected from the St. Joseph’s Health Centre Guelph (SJHC) rehabilitation out-patient ward. All patients had undergone hip or knee replacement surgery and were in SJHC for rehabilitation. Patients were in SJHC for a six-week rehabilitation program. Patients were approached in their third to sixth week, and data were collected for a single exercise session for each patient. All the exercises collected were part of their prescribed routine, but each patient performed half of the exercises while using an exercise feedback monitor. 1 The supine exercises collected were knee extension and knee/hip flexion. The seated exercises collected were stationary bicycling, knee extension and sit to stand. The standing exercises collected were gait, hip abduction, hip extension, knee flexion, marching, lunges and squats.
The healthy data were collected with the approval of the University of Waterloo Research Ethics Board (REB). The TRI dataset was approved by both the UW REB and the University Health Network REB. The SJHC dataset was approved by both the UW REB and the SJHC REB. Signed consent was obtained from all participants.
Many of the exercises performed by the SJHC and TRI patients were modified in some way: springs, slings, weights and other physical devices were added to modify the exercise difficulty, providing test cases for of inter-exercise generalization. The main difference between the two patient datasets was the health status of the patients. In-patients were being treated in hospital due to additional health concerns or co-morbidities that prevented discharge, while out-patients were healthy enough to recover at home.
For the UW dataset, manual segment points were generated by using the motion capture data. The motion capture marker positions were used produce a video of the Cartesian data and the segments were denoted based on the observer’s perception of when a repetition had begun or ended. For the TRI and SJHC dataset, manual segmentations were annotated on the recovered joint angle data, as motion capture data were not available. The accelerometer and joint angle data were plotted as a time-series plot and the segments were denoted based on the observer’s perception.
Implementation
Known (exercises used in algorithm training) and novel (exercises not used in algorithm training) exercises with their corresponding active joints, direction of movement, typical initial postures and the total amount of data collected.

The directions of motion include extension (ext), flexion (flex) and abduction (abd). The initial postures include supine (sup), sitting (sit) and standing (std).
All data were resampled to 50 Hz. Both joint angle and joint velocity data were used as classifier input. All processing and algorithm implementation were done in MATLAB 8.0, along with the LIBSVM toolbox 28 and the Toolbox for Dimensionality Reduction. 29 nstack was set to 15, while nexp was set to 10, based on previous testing. 30 For PCA, a scree plot threshold of 80% was used. For SVM, two-class soft margin radial SVM was used. C was set to 1. For the radial kernel function, γ was set to the inverse of the number of degrees of freedom (DOFs) post-PCA. The same settings as reported in Lin et al. 30 are used, where a detailed analysis of parameter sensitivity is provided.
A four-fold cross validation was utilized to test inter-participant generalization. For training, 10 healthy participants from UW were randomly selected, another set of 10 UW participants were used for testing, as well as all of the TRI and SJHC patient data. All reported accuracy values were averaged over the four folds.
Validation metric
The segmentation accuracy was assessed by comparing the algorithmic p1 and p0 labels against the manually generated ground truth. The total number of correctly identified points, the p1 true positives (TP) and p0 true negatives (TN), as well as the false positives (FP) and false negatives (FN) are reported together as the balanced accuracy AccBal

This measure combines both the sensitivity and the specificity scores and limits inflated accuracy scores in imbalanced dataset cases.
Results
While the proposed method is designed to automatically extract segment edge features, machine learning approaches can be sensitive to input feature scaling. The results show that the normalization allows the healthy and the rehabilitation data to appear more similar, and the temporal stacking and PCA selected a suitable linear combination of features that provide good separability for high segmentation accuracy.
Known exercises
Classifier performance for known and novel exercises.

The reported results are the mean and standard deviation of the four-fold cross-validation in the training data. Three types of normalizations were examined: offset value removal (off), magnitude scaling (sca) and rectification of the joint angle (abs). Bolded value denote maximum in each section. The results are separated into known and novel exercises, as denoted by Table 1.
For healthy participants, removing the offset significantly improves the accuracy, moving from 74% ± 26% to 91% ± 6%, an increase of 15% in accuracy and a drop of factor of 4 in the standard deviation. The offset removal allows motions that start at different postures to appear more similar, thus improving accuracy. Normalizing without using the scaling factor provided the best performance.
The preprocessing techniques also resulted in a similar outcome for the SJHC dataset, where the offset normalization significantly improves the segmentation accuracy. Applying the rectification alone led to performance degradation, but when combined with the other normalization methods, up to 17% improvement can be observed.
The preprocessing techniques have the strongest impact on the TRI dataset. Rectifying the data improved performance, but not as significantly as magnitude scaling the data. Magnitude scaling allows the patient datasets to look more similar to the training set, allowing for improvements of over 17% in accuracy for some configurations. Combining all three preprocessing steps improves performance on the TRI dataset to 85%. Offset removal alone improves accuracy from 60% to 65%.
Novel exercises
This paper next considers novel exercises, where the test exercises were not included in the training set to test inter-exercise generalization (Table 2). This test is important for clinical application because if the algorithm can successfully generalize to exercises that were not explicitly included in the training dataset, it reduces the amount of training data that must be provided. Table 2 shows that, without pre-processing, the novel exercises do not perform as well as the known ones.
For healthy participants, the offset value removal is the most influential factor, improving the accuracy by 13%. However, scaling and rectification alone did not seem to impact the accuracy significantly. However, with all three normalizations active, the accuracy is improved by 18%.
For patient data, without normalization, the segmentation performance declines significantly, but with offset value removal, scaling and rectification, the TRI novel exercise approaches performance with the known exercises, at 85% to 83% for the known and novel datasets, respectively. The most influential normalization is the offset and the scaling, which allowed the TRI data to appear more similar to the healthy training data. Similar results can be observed for the SJHC novel exercises, where the reported accuracy was 89% and 88% for the known and novel motions, respectively.
PCA mapping
The PCA mapping of the data shows that the top PCs are composed of the knee sagittal joint angle, the knee sagittal joint velocity, the hip sagittal joint angle, the hip sagittal joint velocity, the hip abduction joint angle and finally the hip abduction joint velocity, which are the main features that change over time over all the datasets. These PCs, under different configurations, can be seen in Figure 5.
Four plots of the training data, projected onto a 2D plane via PCA using the projection matrix generated by the offset value removal and scaled training data. These plots show the different PCs at different nstack values and rectification state. Note that the scale between the left two figures and the right two figures are different. In all configurations, the first four PCs heavily weigh the knee sagittal and hip sagittal joint angles and velocities, due to their high variance in the trajectories examined. Although not shown here, the subsequent PCs weigh the hip abduction joint angle and velocity more heavily. (a) Unrectified data, nstack = 0. (b) Rectified data, nstack = 0. (c) Unrectified data, nstack = 15. (d) Rectified data, nstack = 15.
For nstack = 0, the first PC contains the knee sagittal and hip sagittal joint velocity. The second PC contains the knee sagittal and hip sagittal joint angles. These two PCs effectively form a phase plot of these two different joints, emphasizing the cyclic characteristics of the exercise movements.
For nstack = 15, PCA generates a similar looking projection, even though the input feature has been embedded with temporally offset data. This indicates that PCA is constructing linear combinations of the different joint angles and velocities, generating a space analogous to the phase plot, but automatically incorporating multiple joints and short-term temporal information.
Classification accuracy of testing data using classifiers that have been normalized by using offset value removal, magnitude scaling and rectification.

The baseline is bolded and denoted as nstack = 15. Different nstack parameters are examined. The results are separated into known and novel exercises, as denoted by Table 1.
Discussion
The contributions of this paper are three-fold: (1) the segmentation problem is recast as a two-class classification problem, allowing standard machine learning methods to learn the optimal classification boundary without the need for hand selected features; (2) the differences between healthy and rehabilitation movement patterns and the impact of feature normalization techniques on algorithm performance and generalization are investigated and (3) the algorithm is validated with one healthy and two patient datasets, demonstrating that the algorithm can generalize to both motions and individuals that were not seen during training and that normalization can be used to allow the algorithm to be trained using only healthy data, which can be more easily collected and labelled. The proposed method can be applied to the clinical environment and perform online motion segmentation.
Comparison to existing work
The velocity feature HMM (vfHMM) 12 was implemented as a comparison work against the proposed algorithm. It uses velocity crossing and peaks to identify potential segments, then selects them based on HMM identification. In addition, a zero-velocity crossing (ZVC) algorithm 22 was also implemented, where velocity crossings indicated direction change and thus segment points. The HMM and ZVC methods were selected due to their wide-spread use for motion segmentation. DTW9,10 is another common method but has heavy computation requirements, making it unsuitable for online clinical deployment.
Joint angle data that had discontinuities, integration drift or noisy recovery were removed, as they caused the training algorithm 12 to diverge. For the ZVC algorithm, 22 every second identified ZVC was used to create the segments. The single point segments declared by the comparison algorithms were converted into p0 and p1 points such that the balanced accuracy metric can be used for all algorithms. For this section, the training and testing data of all three algorithms were normalized by offset removal and magnitude normalization.
Classification accuracy of the proposed algorithm, compared against two other methods, the velocity feature HMM (vfHMM) and the zero-velocity crossing (ZVC), using known exercises.

The proposed method is bolded.
With suitable pre-processing, the classifier can generalize both to patient data and to novel exercises, based on only a healthy participant training dataset.
Differences between healthy and rehabilitation data
The results show that normalization plays a key role in enabling generalization to novel participants and that validation on patient populations are important. In Figure 6, intra-participant variance is shown to be significant, even within the same healthy participant when the data are collected within a short time period (Figure 6(a) and (b)). In the datasets evaluated here, this difference is magnified between healthy and orthopaedic patient data as the exercises were performed under different conditions. For accelerometers, joint angle recovery with the Kalman filter
26
assumes that the sensors are rigidly attached to the limb. While this is generally not a problem for healthy participants, the sensors cannot be attached as tightly to joint replacement patients due to concerns about pain. Sensor placements are also less exact due to the need to avoid surgical sites, bandages, weights and slings, and may be displaced during movement. Many of the total joint replacement patients who participated in the experiments also suffer from complications that impact movement and stability, such as osteoarthritis in the non-operated limbs, obesity or post-surgical swelling.
2
Compensatory movement due to pain or soreness is another source of variability. Patient data also vary widely due to prescribed patient-specific exercise modifications such as support slings or weights. These differences emphasize the need for normalization to be robust to patient motion variability, as well as highlight the need to perform data validation against both healthy and rehabilitation data.
Eight phase plots of seated knee extension (KEFO-SIT), where the x axis denotes knee sagittal joint angle and the y axis denotes knee sagittal joint velocity. The left figures denote the same UW participant performing the exercise at different times within the same hour, illustrating intra-participant variation. The right figures show the same TRI patient performing the exercise at different times over a two-week span, illustrating significant magnitude differences as the patient improves over time. The top figures show the data without magnitude scaling, while the bottom figures show the data after scaling. (a) UW 5, session 1, no scaling. (b) UW 5, session 2, no scaling. (c) TRI 2, session 1, no scaling. (d) TRI 2, session 10, no scaling. (e) UW 5, session 1, with scaling. (f) UW 5, session 2, with scaling. (g) TRI 2, session 1, with scaling. (h) TRI 2, session 10, with scaling.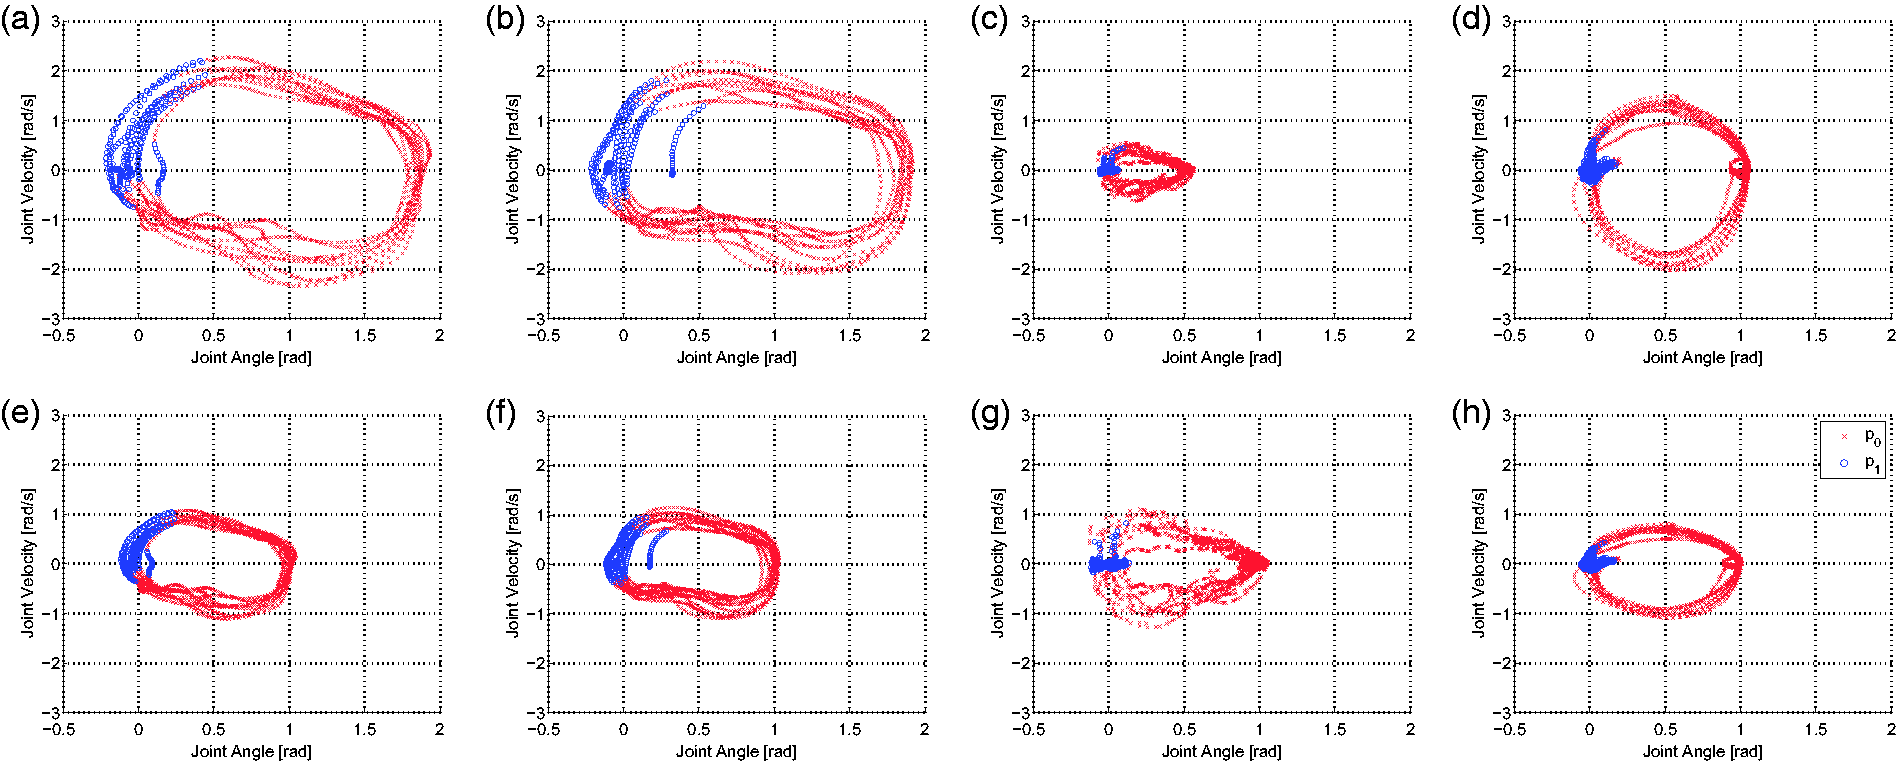
Reformulating segmentation as a classification problem simplifies the task and allows for machine learning techniques to be used to automatically extract segmentation boundaries without hand crafted features. The various normalization techniques investigated allowed for the healthy template to generalize to both participants and exercises unseen during training, even though the healthy and rehabilitation participants were observed to have very different movement patterns.
Clinical considerations
In the clinic, segmentation misclassification can lead to a misrepresentation of patient health. Under-segmenting may lead the patient perform more repetitions than prescribed, as well as lead the physiotherapist to believe that the patient is less capable. Over-segmenting may lead the patient to perform fewer repetitions and lead the physiotherapist to overestimate the patient’s capability.
Lam et al. 1 used vfHMM 12 as the segmentation algorithm in a clinical study where online computer-based feedback was given to patients on their movements. In Lam et al.’s study, 1 the patients’ peak velocity and exercise duration improved with feedback, as well as reducing compensatory movement. This suggests that vfHMM 12 is sufficiently accurate to improve patient metrics. The F1 accuracy for vfHMM 12 for patient knee extension data was 73%, while the F1 for the proposed approach on the same exercise is 80%. Since the proposed method outperforms vfHMM, 12 the proposed algorithm should also be suitable for clinical usage.
While the segmentation accuracy outperforms prior work, several limitations of the algorithm should be considered. The current method assumes that the first manual segment of all observed data is known to perform normalization, requiring physiotherapist input to specify. Although the algorithm would be more flexible if it did not require explicit physiotherapist input, it is reasonable to expect a physiotherapist to observe their patients to ensure that the first repetition of any prescribed exercise is completed properly. However, this supervision process may be cumbersome in group exercise sessions.
Another limitation is if the range of motion changes dramatically over the span of a given observation sequence, the classifier may not be able to sufficiently segment the data since the normalization factors are calculated from the first segment. That is, if the patient improves or degrades significantly from the first segment, the algorithm may not perform as well. The proposed algorithm also relies joint angles reported from body-worn sensors, which may be difficult for all patients to put on unassisted due to limited mobility. 1 Only orthopaedic rehabilitation exercises of the lower body are considered in this paper. To verify clinical feasibility, different population types and wider exercise sets should be considered.
In this paper, only kinematic data of the lower body were examined, which may limit clinical applications. However, earlier versions of this technique have been applied to complex full body kinematic data of healthy participants, 31 as well as to joint torque 32 and electromyogram 33 data, demonstrating that the technique suitable for a variety of input features.
Another limitation of any supervised learning algorithm is the need for manually labelled training data. Manual segments in this paper were obtained by video playback of motion capture marker locations or by annotation on a time-series graph, and may suffer from inter-rater variability. A possible way to alleviate this issue is to collect manual segments from several labellers.
Conclusion
In this paper, an algorithm for motion segmentation was developed and validated with both healthy and patient data. The proposed algorithm converts time-series motion segmentation into a two-class classification problem. The algorithm was tested for both inter-participant generalizability and inter-exercise generalizability and was shown to segment with 92%, 87% and 85% accuracy on healthy, out-patient rehabilitation and in-patient rehabilitation data, respectively, while using only healthy data for training.
For future work, a wider variety of exercises will be examined, including gait and functional tasks.
Footnotes
Acknowledgements
The authors would like to thank the University of Waterloo community, and the staff and patients at the Toronto Rehabilitation Institute and the St. Joseph Health Centre Guelph for providing their time and data. The authors thank Joanna Wong for her insights into physiotherapy practice and Agnes Lam for contributing to the data collection.
Declaration of conflicting interests
The author(s) declared no potential conflicts of interest with respect to the research, authorship, and/or publication of this article.
Funding
The author(s) disclosed receipt of the following financial support for the research, authorship, and/or publication of this article: This work was supported by the Natural Sciences and Engineering Research Council (grant number CRDPJ 433802-12).
Guarantor
JL.
Contributorship
JL, VJ and DK conceived the study. JL and VJ developed the proposed algorithm and conducted the evaluation. JL conducted a literature review, developed the experimental protocol, secured ethical approval, conducted the data analysis and wrote the manuscript. All authors reviewed and edited the manuscript and approved the final version of the manuscript.
Note
I. A preliminary version of this work was presented in conference publications,30,31 where the proposed approach was applied to healthy participant datasets. This paper expands upon the earlier work with additional feature processing techniques, validates the proposed approach on two rehabilitation patient datasets and provides an expanded discussion of the strengths and limitations of the proposed approach.