
Abstract
The Medicare Functional Classification Levels: “K-Level” system is a standard scale for functional levels of amputees. But it is problematic to document objectively and reliably. The K-Levels are based on three characteristics: potential to ambulate, cadence variability and energy level of the amputees. Actual mobility patterns of transtibial amputees recorded by a step activity monitor (StepWatch™) were translated using a computerized algorithm to match the three K-Level characteristics: the most active one minute, the ratio of low:medium:high step rates, and the total daily steps, respectively. This study compared prosthetists’ ratings of functional levels based on a visual inspection of step activity patterns with the ratings calculated by the computerized algorithm based on the same step activity data in 81 transtibial amputees. The computerized algorithm produced functional level values that closely matched the average of the ratings by 14 experienced prosthetists. The slope of the linear regression line was 1.04 with an R2 value of 0.829, indicating good linearity and concordance across the range of the two scales. The results of this study demonstrated concurrent validity of the computerized algorithm and suggested that it could potentially serve as a useful tool in rating functional levels of transtibial amputees based on real-world step activities and complement a clinic-based test.
Introduction
Objective functional level classification of amputees is needed to match appropriate prosthetic components to the locomotor demands of individuals and their medical necessity, to monitor mobility status over time, and to rationalize reimbursement from payers for mobility technologies. The current standard, adopted by the United States (US) Health Care Financing Administration in 1995, consists of five Medicare Functional Classification Levels (MFCL) or K-Levels. 1 The K-Levels were designed to describe and categorize the functional levels of individuals with limb loss, but in practice the guidelines are somewhat difficult to objectively and reliably implement.
The question of validity of the K-Levels construct has not been rigorously addressed in the published scientific literature, but this standard has endured nonetheless. Several authors have attempted to create questionnaires or test batteries to determine functional level in those with lower extremity limb loss.2–5 The Amputee Mobility Predictor (AMP) 2 has been successful in providing a set of tasks and functional performance observations to quantify the K-Level of amputees. But it does not collect any data on amputees’ actual use of their prosthesis in the home or community environment. The AMP is a valuable tool with published evidence of validity. It is especially useful for evaluating the potential to ambulate for those who are recovering from amputation surgery and have not yet walked on a prosthesis (AMPnoPRO). 2
Evaluations of the ambulation capacity of amputees within the clinic or laboratory setting are distinctly different from actual increases in mobility or activity that occur in the individual’s typical community environment. 6 The performance of locomotion in the community is dependent on a range of additional factors such as personal choice, weather, terrain, vision, social interactions, socket comfort in longer-term ambulation, recreational activities, health comorbidities and many others. Simply having the capacity to ambulate with skill and confidence does not mean that amputees will choose to ambulate often or for long periods in their typical environment. This is important because amputees have increased risk for a host of inactivity-related comorbidities including obesity, diabetes, cardiovascular disease and stroke.7–11
The purpose of this study was to compare prosthetists’ ratings of amputee functional level based on visual inspection of step activity patterns with the ratings by a computerized algorithm based on the same step activity data in 81 transtibial amputees and to provide concurrent validity to the computerized algorithm. Our previous work demonstrated that the computerized algorithm was in good agreement (R2 = 0.775; p < 0.001) with K-Level assessment of transtibial amputees in the clinic. 12
Methods
Participants
The protocol for this study was approved by the institutional review board (IRB) governing the institution. The anonymity of the participants (both the 81 amputees whose step activity was collected and the prosthetists who performed the evaluations) was ensured throughout the study, and the IRB determined that informed consent was therefore not required. Forty-eight individuals were invited by email to participate anonymously in this study. These individuals were members of the Gait Society of the American Academy of Orthotists and Prosthetists, and were perceived experts based on previous professional work, postgraduate education, or previous prosthetics care or research productivity. Their invitation email was sent out on two occasions approximately one week apart. The first email contained a brief explanation of the methods and goals of the study, and a link to an online survey site for the study. The second email invitation had similar content and was sent without knowing if that individual had chosen to participate. No data were recorded on the identity of the respondents at the survey website, but questions about their profession, their clinical experience and their clinical workload were presented to the respondents to define their expertise.
Rating of K-Level by prosthetists
Individuals were invited by email in batches of 10, and the responses on the website were not observed by the investigators until the end of the study to ensure the anonymity of the respondents. Three weeks after the final batch of email invitations had been sent, the responses to the survey were collected and analyzed by the investigators.
On the survey website, respondents first answered a series of questions to define their profession, their experience and their clinical service workload. This was aimed at defining the length of experience and the level of expertise the prosthetists had in determining K-Levels using their typical methods in clinic. Respondents were then presented with a series of training experiences explaining how the daily step activity data they were about to view were collected and analyzed, and a rubric for interpretation of step activity features pertinent to the K-Level descriptors. The respondents all viewed plots of daily activity of 81 anonymous transtibial amputees recorded during daily life. The viewing order of the amputees was randomized. The activity data were presented as histograms of steps per minute over 24-hour periods (1440 minutes) for five to seven days of step activity. Each day was presented in a separate histogram, starting at 12 midnight and ending 24 hours later; sequential days followed below, each day in a 1:10 aspect ratio. The respondents were not given any visual images of the amputees walking, or any additional data other than the images of the amputees’ step activity data. The number of steps in each one-minute period appeared as a thin vertical line for each minute, and the length of this line represented the number of steps in that minute (Figure 1). The purpose of presenting the activity data in this manner was to expose and familiarize the respondents to observing walking activity data that would meet the description of the criteria for the K-Level descriptions in the MFCL document.
1
Step data on the 81 amputees were collected with a StepWatch Activity Monitor, which has been shown to accurately record steps with better than 98% accuracy,13,14 even for amputees.
Examples of activity data images presented to survey respondents. Images represent four different functional levels from K1 to K4. Respondents were trained to rate the functional level of the amputee by evaluating the highest single minute (potential to ambulate), the ratio of low:medium:high step rates (cadence variability) and the total step rate density (energy level). Each vertical line represents the number of steps in that minute. The orange band is from 0 to 15 steps per minute, the yellow band is from 16 to 40, and the white band is more than 41 steps per minute.
Survey respondents were trained to recognize three traits in the histograms that correspond with the definitions of the MFCL K-Levels and the calculations performed to rate the functional levels of the amputees. The first trait the respondents learned to evaluate was “Potential to Ambulate,” the indicator for this being derived from the highest single minute of activity the amputee achieved through the recorded period. Each histogram had colored bands (Figure 1) so that respondents could estimate the height of the vertical line that represented the highest single minute of activity (Figure 2; Potential to Ambulate).
Graphical explanations of Potential to Ambulate, Cadence Variability and Energy Level that prosthetists observed in making their assessments of functional level.
The second trait the respondents were trained to evaluate from the activity images was “Cadence Variability,” and this was defined as the ratio of low:medium:high step rates. Low was defined as less than 15 steps per minute (orange band); medium was defined as 16–40 steps per minute (yellow band) and high was defined as more than 41 steps per minute (white band). These ranges were determined arbitrarily based on experience. A more balanced ratio with more steps at the high and medium step rates earned amputees a higher score on this feature of their community activity level (Figure 2; Cadence Variability).
The third trait that respondents were trained to evaluate was the total number of steps as an estimate of the MFCL description of “Energy Level.” Amputees with activity that included high step density (lots of steps close together in time) indicated higher energy levels than amputees with fewer steps spread throughout the five- to seven-day community ambulation period (Figure 2; Energy Level).
After reviewing several examples of amputee activity data with high and low values on these three traits (the highest single minute, the ratio of low:medium:high step rates, and the total daily step density), the survey respondents could choose to review the examples again, or indicated they felt comfortable with rating these factors and were ready to evaluate the activity data on the 81 amputee samples. The respondents were instructed to observe these three characteristics on each amputee’s data and to rate each amputee on a 0.0–4.9 continuous scale, and include a decimal value for additional resolution compared to the MFCL K-Levels. The survey respondents also rated a single value that represented their opinion of the K-Level of the individual prosthetic user based on the overall visual feature of the step data. K-Level was subsequently calculated by averaging the four components (three traits of step data and respondent’s opinion of K-Level). Each component contributed equally (25%) to the final K-Level value. Because a decimal value for additional resolution of the K-Level was included, a high functional level of 2 might be rated as 2.8 or 2.7 and a low functional level of 2 might be rated as 2.3 or 2.2.
After respondents completed the rating of all 81 transtibial amputees, they were asked a series of questions about their experience with the survey itself, their usual method of rating functional level in their clinical practice, their opinion of how often a functional level assessment was required for an amputee under their care, and how they felt about the validity of the method they had just learned to perform based on community activity level.
Rating of K-Level by the computerized algorithm
The steps per minute data of the 81 amputees were also evaluated to determine the K-Level for each amputee using the computerized algorithm. 12 This algorithm was derived using cluster analysis of statistical measures of gait activity from a different anonymous training sample. The measures used were the step rate in the highest single minute of activity, the ratio of low:medium:high step rates, and an equation to estimate caloric energy expenditure based on total daily steps (EEtotal (kcal) = 2.033 kcal*kg–1*weight (kg) + 0.368 kcal*steps – 86.1 kcal) developed by Foster et al. 15 The average of the individual’s score on each of the three measurements as well as K-Level based on clinical judgment of prosthetists who treated these amputees was the final calculated functional level. Each of the four components carried an equal contribution (25%) for the calculated K-Level. This algorithm produced a rating between 0.0 and 4.9 with one significant figure beyond the decimal point, a similar resolution compared with the respondents in rating amputee functional level.
Data analysis
For each of the 81 transtibial amputees, the value for the calculated K-Level was compared with the respondents’ average estimate of the amputee’s K-Level using linear regression. The hypothesis was that there would be a statistically significant correlation between the respondents’ rating and the functional level calculated by the computerized algorithm (p < 0.05).
Results
The respondents (n = 14; 29% response rate) all reported that they were prosthetists; eight had more than 21 years of experience, three had 11–20 years of experience, two had 6–10 years and one had 1–5 years of experience. One reported that he or she treats more than 101 amputees each year, five reported treating 51–100 a year, four treat 31–50, and four treat 30 or fewer each year. The responding prosthetists also reported the number of K-Level assessments they perform each year, with one reporting more than 10 K-Level assessments each week, two reporting five to nine K-Level assessments each week, seven reporting two to four K-Level assessments each week and four reported performing one K-Level assessment each week (Figure 3).
All respondents were prosthetists, and most were very experienced, had high clinical workloads, and performed several K-level assessments each week in their current clinical practice. If K-Level assessments were easier, most prosthetists thought they should be done every time they saw the amputee. In their current clinical practice, prosthetists reported they employ observations and information from a range of walking characteristics, but most frequently consider walking speed, stability, amputee self-report, turning and maneuvering, and walking endurance to make K-Level decisions.
The computerized functional level algorithm produced values that closely matched the average of the 14 prosthetists. The slope of the linear regression line was 1.04 indicating good linearity and concordance across the range of the two scales. The R2 value was 0.829 (p < 0.001), indicating that 83% of the variance in prosthetist rating was accounted for the ratings by the computerized functional level algorithm (Figure 4). The residual analysis (the ratings by the computerized algorithm minus prosthetists’ average ratings based on visual inspection of step activity) indicated that on average the algorithm was 0.26 functional level units higher in rating the 81 amputees, with a standard deviation of 0.34 units.
Linear regression of the prosthetists’ rating of the functional level versus the functional level calculated by the computerized algorithm.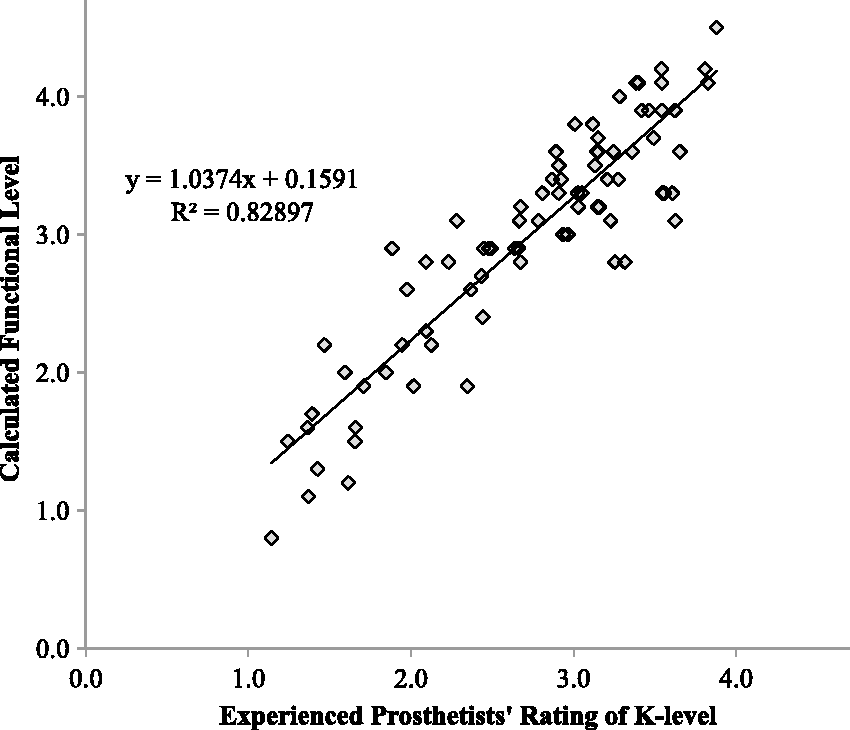
When asked the question “If it was easier to get an accurate K-Level assessment, would you do it more often?” eight prosthetists responded with “yes, every time they saw the amputee”; four with “If I thought the amputee had changed in some way” and two with “More often, if it did not take too long” (Figure 3). Six prosthetist respondents reported that they had a strong preference for visually observing the individual walk before making a K-Level assessment; three somewhat agreed, one was indifferent and one strongly disagreed. Three gave no rating to this question.
The prosthetists were split on the issue of whether they felt confident that an accurate assessment of amputee function could be derived from step activity data only. Four somewhat agreed with this approach, one was neutral, three somewhat disagreed, two strongly disagreed and four gave no response. The respondents also reported that they could easily find “Cadence Variability” with eight strongly agreeing, three somewhat agreeing, and three giving no response. Four strongly agreed that it was easy to assess “Energy Level”; five somewhat agreed, one was neutral and four gave no response. Eleven prosthetist respondents strongly agreed that some form of objective K-Level determination was a good idea; three gave no response to this question.
The prosthetists also reported that they consider a number of other factors when performing a K-Level assessment in their clinical practice (Figure 3). Fourteen reported that they consider walking speed in their assessment process; 11 prosthetists report that they consider walking stability and 11 consider walking self-report; eight consider turning and maneuvering performance and eight consider walking endurance. Other factors the prosthetist respondents reported considering when performing K-Level assessments were gait initiation and termination, stairs, running, jumping and sports participation. Two prosthetists reported that they also use the AMP when performing a K-Level assessment.
Discussion
The results of this study demonstrated concurrent validity of the computerized algorithm with an R2 value of 0.829 (p < 0.001). In consideration of our previous work showing good agreement (R2 = 0.775; p < 0.001) between the computerized algorithm and K-Level assessment in the clinic, 12 it was suggested that the computerized algorithm could potentially serve as a useful tool in rating functional levels of transtibial amputees. The MFCL K-Level system is the standard scale for functional levels, but it is problematic to document objectively and reliably. Despite the fact that no evidence of validity of the K-Level system has been published, it is the de facto standard of functional level for amputees in the US and has now been accepted in other countries.16,17 The prosthetists who participated in this study acknowledged that if an objective functional level were easier to measure they would do it more often, perhaps every time they saw the amputee. Some of the prosthetists reported they treat more than 100 amputees each year and perform more than 10 K-Level assessments each week. This represents a large clinical burden of approximately three and a half hours each week for which prosthetists are not specifically compensated. Payers are demanding more objective, repeatable and valid functional assessments, and there have been serious charges made by the US Inspector General of questionable billing practices by providers of prosthetic components. 18 Any assessment system that is costly, difficult or time consuming may not be used effectively in routine clinical practice. A computerized functional level algorithm may be beneficial.
The functional level calculated by the computerized algorithm closely matched the prosthetists’ rating of the same ambulatory features presented visually. This suggests that the prosthetists recognize specific features related to the MFCL K-Level classification system in amputee community gait data. And they can make a similar rating based on the perceived range of values on these features, from very low functioning to very high functioning. The functional level calculated by the computerized algorithm has the added benefit of being a continuous rather than categorical variable, opening up the possibility of tracking more subtle incremental rehabilitation improvement or decline than is currently possible.
Despite their high degree of agreement with the calculated functional level, the prosthetists in this study expressed a lack of confidence with their ability to rate amputees from the step activity data. (The prosthetists did not see the results before rating their confidence in their ability to evaluate amputees’ functional level from step activity data.) In actual clinical use, this concern would be alleviated because the rating would occur in conjunction with first-hand clinical observation. The different observational gait measures, such as walking speed or stability described by the prosthetists in their current K-Level assessment methods (Figure 3) could be used in concert with the computerized algorithm for a more sensitive and specific evaluation of mobility and activity in prosthetic users.
This real-world calculation of function level that corresponds to specific descriptions of the MFCL K-Levels may be a more objective test of locomotor function than a clinic-based test of capacity or observed gait deviations and comorbidities that may limit mobility. Klute et al. have reported no change in real-world ambulatory patterns in amputees when using a microprocessor knee versus a hydraulic knee, 6 even though kinematic 19 and metabolic efficiency 20 during walking improved in laboratory tests.
In a laboratory test of capacity, some amputees might be able to perform quite functionally, but then exhibit extremely limited activities in their real-world environment. The opposite may also be true. Kahle et al. have shown that some transfemoral amputees increase to K3 only when provided the microprocessor-controlled knee that would be denied by their payer because they were rated as K2 while wearing a hydraulic knee. 21 Rather than requiring prosthetists to undertake a clinic-based test that predicts future ambulatory activities to rationalize component choices, the functional level calculated with the computerized algorithm in this study is based on objective analysis of actual performance of ambulatory activities and functional requirements in the amputee’s typical environment over a week-long period. The calculated functional level offers repeatable, objective criteria for functional level assessment based on actual performance in the amputee’s daily activities environment, and may complement the prosthetist’s observations of specific gait characteristics of each individual patient in the clinic.
There are some limitations in this study. This small sample of experienced prosthetists may not represent a general population of prosthetists and the findings of this study should be cautiously applied in the clinical setting. The methods lead to an obvious bias of experienced prosthetists performing the ratings of K-Level, and less experienced prosthetists may not show the same results. Evidence of reliability or validity of the survey used in this study has not been established, and the conclusions from these data should be interpreted with caution.
Conclusion
Prosthetists’ ratings of functional levels based on a visual inspection of step activity patterns closely matched the ratings calculated by the computerized algorithm based on the same step activity data in transtibial amputees. It was suggested that the computerized algorithm could potentially serve as a useful tool in rating functional levels of transtibial amputees and complement a clinic-based test. Future work to establish the reliability, validity and clinical utility of the algorithm in determining K-Level is required with a larger sample size before robust conclusions can be drawn.
Footnotes
Declaration of conflicting interests
The author(s) declared the following potential conflicts of interest with respect to the research, authorship, and/or publication of this article: The authors work or worked for Orthocare Innovations, the manufacturers of the sensor worn by the participants in this study, and the developers of the algorithm used to determine K-Level from community activity data.
Funding
The author(s) received no financial support for the research, authorship, and/or publication of this article.