
Abstract
Isometric force assessment can provide insights into strength and motor control in patients with neurological disabilities. This study investigated the connection between isometric strength and control in nine multiple sclerosis (MS) patients and four healthy subjects using a compact isometric setup. The participants carried out isometric assessment tasks in both upper extremities in six directions. Strength was measured through maximum voluntary force/torque (MVF/T), while control ability was measured by applying a constant force/torque of 25% of MVF/T. Isometric control was quantified using coefficient of variation, force directing ability, sample-entropy and spectral bandwidth. The MS patients were also assessed using two impairment measures (Motricity Index and hand-grip strength), and two activity measures (Action Research Arm Test and Nine Hole Peg Test). The results indicate that isometric strength and control (measured by spectral bandwidth) were correlated in most directions. Among the four control measures, spectral bandwidth – a measure introduced in this study – was found to be strongly related to the force/torque regularity as measured by sample-entropy. Isometric strength and spectral bandwidth for all directions were well correlated with the impairment measures, but their correlation with the activity scales was moderate and direction-dependent. Overall the results show potential for using the isometric setup and protocol for assessment in MS population.
Keywords
Background
Multiple-sclerosis (MS) is a common degenerative, chronic, auto-immune disease that affects the insulating covers of the neurones and generally results in decreased nerve conduction velocity and axonal loss, in particular affecting sensorimotor functions and coordination in the upper extremity. It has been observed that MS patients are unable to adequately generate and modulate grip force, 1 and almost 75% of the MS patients have reduced manual dexterity. 2 All this has a negative impact on quality of life, 3 and thus it is important to assess the progression of the disease in order to propose an appropriate treatment.
The general approach to assess sensorimotor control is through standard clinical procedures that most often utilise ordinal measurement scales used by a therapist who observes a subject's movements in different predefined tasks and scores their performance.4–6 Such an assessment is subjective and lacks sensitivity; it also does not provide sufficient details and insight into the nature of the disability. Objective precise and sensitive assessments can provide valuable information for understanding a patient's sensorimotor ability and can inform therapy planning. Besides, other standard clinical assessments that look at timed performance measures such as the Nine Hole Peg Test (NHPT) 7 do not reveal information on movement quality during the test.
In recent years, objective precise and sensitive approaches have been proposed for the quantification of sensorimotor function based on the use of robotic and sensor technologies.8–15 A particularly simple objective method is the isometric force/torque measurement, where subjects interact with a sensing system that quantifies the applied force/torque in a static posture. Isometric studies are commonly used in several fields – such as motor control, 16 aging,17,18 neurorehabilitation,13,19,20 – to investigate and assess human motor control. Isometric measurement setups can be used to probe different aspects of human neuromuscular control: strength,21–25 inter-limb coordination26,27 and force control (variability and complexity).13,16,18 All of these are important features of a healthy sensorimotor system, which are affected to varying degrees in neurological conditions such as stroke, spinal cord injury or MS. Several studies have investigated the nature of these aspects in patients (primarily in stroke patients) and compared them to healthy behaviour.13,17,18,21–24,26–29 This paper focuses on two of these aspects – strength and control – in individuals affected by MS to investigate how these two aspects relate to each other and frequently used clinical outcome measures.
Muscle strength is an essential requirement for producing motor output. Force generated by the muscles is required to accelerate the limb, overcome gravity and interact with the environment. Thus the ability to perform everyday activities is affected by deficits in muscle strength, in both the upper21,23,24,30 and lower extremities. 22 Furthermore, the strength deficits in the different limb muscles have also been found to correlate with each other, 21 even though some muscles tend to be more affected than others. 25 In fact, some strength measurements are already used in routine clinical practice using dynamometers to assess hand grip strength.1,30–33
Another important factor for carrying out activities of daily living (ADL) successfully is the precise control of force, and this is required for moving the arm smoothly to a desired location in space, or to apply the appropriate force to manipulate an object. Force control has been investigated previously13,28,34 from two points of view, both the amount of variability and the nature of variability (complexity) of the force output. The effect of the amount of variability is observed as the precision in the task performance. On the other hand, the nature of variability is considered to be related to the adaptability of the neural system producing the force output.13,17,18,28,29 Lodha et al. found that stroke increases the amount of force variability (coefficient of variation (COV)) and makes the temporal structure of the force output more regular (less complex), as measured by approximate entropy. 13 Both the COV and approximate entropy were found to be well correlated with the Fugl-Meyer assessment of sensorimotor impairment. 13 There is currently limited understanding on the nature of force variability in the MS population, and how it is related to activities of daily living.
Given the two seemingly independent aspects of isometric strength and control, and their respective connections to sensorimotor capacity, we decided to investigate both of these factors in order to provide a comprehensive picture of a subject's sensorimotor ability. In particular, we analysed, using a simple isometric setup, what each of these two aspects – strength and control – measure, how they are affected by the nature (task directions) of an isometric task, and how they relate to sensorimotor capability as measured by common clinical assessments. This study investigated strength and control in the upper extremities through an isometric task requiring the application of force/torque in six different directions – up, down, push, pull, supination and pronation. Isometric strength was measured by asking patients to apply maximal voluntary force/torque (MVF/T), while the isometric control measures were estimated through force/torque control tasks where subjects had to apply 25% of MVF/T in different specified directions. The six directions for the isometric task were chosen for their functional relevance to day-to-day activities, unlike the previously studied tasks.13,17,18,28 Furthermore, there is currently little knowledge on the contribution of the strength and control deficits in the different directions to the overall sensorimotor capacity of a MS subject.
We hypothesised that (similar to the stroke population): 13 (a) Isometric strength and control are different for different directions; (b) the MS population exhibits increased force variability and decreased regularity when compared to an age matched healthy population; (c) isometric strength and control (complexity) of MS patients are positively correlated; and (d) these measures correlate with standard clinical scales measuring impairment and activity.
Methods
Apparatus
The hardware setup designed for carrying out the tasks in this study (for measuring isometric forces/torques) consisted of a handle with a grip and an arm support, attached to a six-axis force/torque sensor (ATI Mini-40, ATI Industrial Automation Inc.) as shown in Figure 1 (ATI Mini-40 sensing range for forces (F) and torques(T): Fx, Fy and Fz direction: 80 N, 80 N and 240 N; Tx, Ty and Tz: 4 Nm, 4 Nm and 4 Nm, resonant frequency: Fx, Fy, Tz: 3200 N and Fz, Tx, Ty: 4900 Hz). The force applied on the handle and on the support was measured by the sensor. Subjects were encouraged to avoid using the arm support unless required due to significant impairment. This setup was firmly fixed to a height adjustable table using clamps, allowing easy adjustment of the vertical position of the handle for patients of different heights. The force sensor was interfaced to the NI-USB-6009 data acquisition unit (National Instruments Corporation) connected to a laptop computer running a LabView program to collect data at 200 Hz. Force/torque level was displayed on a computer screen as feedback to the subject. Figure 1 also displays a screenshot of the visual feedback provided to the subjects. Visual feedback consisted of two markers (a) a green marker to display the actual force/torque applied by the subject, and (b) a red marker for indicating the desired force/torque level required, which is used in force control tasks as described later in this section. Also, for the control tasks, the visual feedback was scaled proportionally to each subject's maximum applied forces/torques. This ensured that subjects with weaker limbs could visually see a significant difference between starting position and the final position (red marker) during tasks (see Supplementary Material, Appendix F). In terms of movement, both markers (red and green) moved along the vertical proportionally to the corresponding force/torque value.
The hardware setup used for the study consisted of a handle with a grip and an arm support attached to a six-axis force/torque sensor. Visual feedback to the user consisted of two markers: a green marker to display the actual force/torque applied by the subject, and a red marker for indicating the desired force/torque level required.
Participants
Details of the nine multiple sclerosis (MS) subjects that participated in the study.

A: ambidextrous; ARAT: Action Research Arm Test; L: left; NHPT: Nine Hole Peg Test; PP: primary progressive; R: right; SP: secondary progressive.
The following inclusion/exclusion criteria were used to select the MS subjects: Subjects were included in the study if they could initiate a forward reach (grade 1 on Medical Research Council (MRC) scale at shoulder and elbow) and were able to understand the task and concentrate adequately to perform it. Subjects were excluded if they reported no upper-extremity deficit, they were not able to touch their chin with one of the hands, had severe co-morbidity including severe osteoarthritis, rheumatoid arthritis, significant upper-extremity trauma (e.g. fracture or peripheral neuropathy), or had difficulty in understanding the task.
Procedure
Figure 2 shows the flow chart of the experimental procedure used in the study. A standard clinical assessment was carried out for the MS subjects, and an isometric assessment was carried out on both healthy and MS subjects.
Flowchart of the experimental procedure used in the study. ARAT: Action Research Arm Test; MI: Motricity Index; MS: multiple sclerosis; NHPT: Nine Hole Peg Test.
Standard clinical assessment
On ‘body functions and structures’ level of the ICF, the Motricity Index (MI) was conducted to assess upper limb muscle strength (pinch grip, elbow flexion and shoulder abduction) using a six-point ordinal scale (normal score = 100). 35 Hand grip strength (kg) was measured using the JAMAR hand-held dynamometer assessment to measure isometric grip strength. 31 On ‘activity’ level, manual dexterity was assessed using the Nine Hole Peg Test (NHPT); 36 the time needed to place and remove nine pegs from nine holes was registered. The Action Research Arm Test (ARAT) was conducted to assess the person's ability to handle different objects (normal score = 57). 37 All outcome measures were conducted with both upper extremities. Current hand dominance was determined using the Edinburgh Handedness Inventory (EHI). 38 In addition, the most impaired arm was determined by a question: which arm is most impaired? The standard clinical assessment was carried out no more than a week before or after the isometric assessment by a therapist.
Isometric assessment
The isometric assessment was carried out on both upper extremities by a therapist. The isometric assessment consisted of two types of measurements: (a) isometric strength, where subjects were instructed to apply the maximum force/torque in a specific direction to assess their strength; and (b) isometric force control, in which subjects had to apply and maintain a desired level of force/torque using visual feedback; the desired force/torque level was set as 25% of the estimated maximum strength in a specific direction. The choice of 25% of MVF/T for the control tasks was based on two reasons: (a) reduce the chances of fatigue in the study participants by maintaining the maximum force level for the control at relatively low levels; and (b) the prior evidence in stroke population, about the clinical usefulness of evaluating control aspect at 25% MVC. 13 The strength and control tasks were carried out with both upper extremities in six different directions – up, down, push, pull, pronation and supination. The strength measurement was carried before the force control measurements, as the desired force/torque level for the force control measurement depends on the subject's maximum strength in any specific direction.
Subjects were seated on a chair with a back support (or wheelchair depending upon the severity of neurological injury) in a symmetrical position, with extended trunk. The therapist ensured that at the start of each trial the subject's scapula was aligned with the trunk and the glenohumeral joint was in neutral position, elbow flexed to 90 ° degrees with forearm in mid pro-supination, and the hand was gripping the handle (Figure 1). The computer monitor for visual feedback was positioned in front of the subject at a comfortable height and distance from him/her. No physical trunk restraint was used during the experiment; however, the subjects were instructed to limit their trunk movements while performing the task. When a subject used compensatory movements on a trial, they were made aware of the movement by the therapist and the trial was repeated. The repetition of a trial was never more than one or two trials and was only observed in few cases during maximum voluntary contractions. The protocol used for carrying out the isometric assessment consisted of the following steps.
One of the upper extremities was chosen at random and the appropriate adjustment to the subject's seating and the setup was made, to have the subject positioned appropriately for carrying out the task. One of the six directions – up, down, push, pull, pronation and supination – was selected in that specified order and the appropriate visual feedback was displayed on the screen. The subject was oriented to the visual feedback through demonstrations made by the therapist or the engineer applying force/torque on the handle. The maximum strength for the chosen direction was first estimated through the measurement of isometric strength. The subject was asked to apply as much force/torque in the chosen direction. Two trials were carried out for this measurement with each trial lasting for 6 s. A rest period of 15 s was provided between the two trials (8–15 s for the healthy subjects). After the allotted rest period, the therapist asked the subject if he/she was ready for the next trial, if not the rest period was extended until the subject was completely comfortable to start the next trial. The maximum strength estimated from the second trial was then used to set the desired force/torque level (by the LabView program automatically) for the measurement of force control that followed the strength assessment. The maximum strength was calculated by taking the mean of the last two seconds of force/torque data collected from the second trial of the strength assessment. The last two seconds were selected to measure a relatively stable level of maximum voluntary contraction. While the second trial was used based on the observation that subjects tended to put extra effort (being competitive) using compensatory strategies in the initial trial which decreases in the later trial. The force control ability of the subject was then assessed through the measurement of isometric force control for the chosen direction. The subject was instructed to apply and maintain force/torque as closely as possible from the desired level using visual feedback. Three trials are carried out, each lasting 15 s, which gave the subject enough time to reach and settle around the desired force level; 15 s of rest was provided between two successive trials.
The four steps above were repeated for all six directions and the two upper extremities.
Data analysis
The analysis of the force control data involved the segmentation of force/torque data, feature extraction and the statistical analysis of the relationships between the different features and their comparison to the standard clinical scales. This section focuses on the data segmentation and feature extraction methods used in the data analysis while the statistical analysis is described in the following section.
All data were processed using the IPython interactive shell.
39
A typical example of the temporal profile of the force/torque signal recorded from a single force control measurement trial is shown in Figure 3. The initial 7 s of force/torque data corresponding to the initial stabilisation were ignored in the analysis. This segmented data (without the initial 7 s) were used for calculating the following isometric control measures (features) for the two groups (MS and healthy): force/torque accuracy, direction control, force time series regularity (sample entropy) and spectral bandwidth. The data recorded from the force sensor were first re-sampled (using a linear interpolation method implemented by the ‘interp’ function of the NumPy library)
40
at 200 Hz, yielding uniformly sampled data from the raw data which was not sampled uniformly.
Plot of the force time series measured for an isometric control task in the push direction for (a) a multiple sclerosis (MS) and (b) a healthy subject. The top plots show the time series for the entire trial duration of 15 s. The portion of the time series used for the analysis is highlighted in a thick trace in the top plot is shown in the bottom plots. The corresponding desired force level is indicated by the red line.
COV
The ability to maintain a desired force/torque level accurately was estimated by calculating the COV. COV is a measure of dispersion or variability of the signal from its mean value. It is calculated as the root mean square error σ
f
of the force/torque signal normalised with respect to its mean μ
f
.


Direction control
Direction control is estimated from the ratio of the sum of the absolute force/torque applied in the desired direction to that of the sum of the absolute force/torque in all the directions

Force/torque time series regularity
Force/torque time series regularity during a force control trial was quantified through the sample entropy.
41
The sample entropy is a measure of the rate of generation of information in a time series, which thus captures the nature of the variability in the force/torque output. It is a regularity statistic in which lower values correspond to high predictability in the time series, while higher values indicate more random behaviour. Sample entropy, 
Spectral bandwidth
The spectral bandwidth is a simple measure of the bandwidth of the given time series which can be used to compare the force/torque profiles of healthy and impaired subjects. This measure was used based on the observation that the force/torque profiles of healthy subjects tend to vary much faster in time as compared to that of MS patients. The spectral bandwidth (fBW), is defined as the frequency such that a percentage of the total power in a mean subtracted time series is contained between DC (0 Hz) and this frequency

In the discrete time case, as in the force/torque profile, this can be estimated by calculating the fast Fourier transform of the mean subtracted time series


The spectral bandwidth is then calculated as the frequency containing 90% of the total power
Statistical analysis
Statistical analysis was carried out on the isometric strength, control measures and the standard clinical scales, in order to answer the following questions.
(a) Can isometric strength and clinical scales distinguish between the more and less affected arms of MS patients?
This was investigated by carrying a Wilcoxon signed-rank test on the normalised strength and clinical scale differences between the more-affected and less-affected arms of MS patients. The normalisation yielded a measure of difference between the two arms that was independent of the magnitude, scale and unit of the individual measures. The normalised differences were calculated using the following equation
(b) Is there a difference between the isometric force control measures between MS and healthy subjects? (c) Do the isometric control measures differ for different directions, and between the more and less affected arm for an MS subject?
Questions (b) and (c) were investigated by fitting a linear mixed effects models and carrying out analysis of variance (ANOVA) to estimate the effect of the different factors. The details of the different model's fit to the data are shown in appendix.
(d) How do isometric strength, control and the clinical scales relate within and with each other?
The intra- and inter-relationship between the isometric strength, control and clinical scales were investigated through Spearman rank correlation method as some of the data do not follow a normal distribution.
All statistical analysis were carried out using the R language; 42 the linear mixed effects models were fit using the lme4 package. 43
Results
Isometric data were collected from a total of nine MS subjects and four healthy subjects; additionally, clinical data were also collected from the MS subjects. The force data for a typical MS subject and a healthy subject are shown in Figure 3(a) and (b), respectively. These data correspond to the push direction, i.e. applying force in the positive z-axis as shown in Figure 1. The graphs suggest that: (a) The amount of variability relative to the mean applied force is greater for the MS subject than that of the healthy subject, resulting in higher values of COV for the MS subject; (b) The temporal structure of F, for the MS subject appears to be more regular than that of the healthy subject, exhibited by larger values for sample entropy for the healthy subject compared to that of the MS subject; (c) The signal for the MS subject tends to fluctuate at a slower rate than that of the healthy subject, resulting in a lower value for spectral bandwidth for the MS subject.
The normalised differences between the more and the less affected arms in terms of the standard clinical scales and the isometric strength measurements are shown in Figure 4(a) and (b), respectively. Differences in clinical scales between the two arms indicate that the less affected arm performs better, with positive normalised differences for MI (p < 0.03) and ARAT (p < 0.02), and negative normalised difference for NHPT (p < 0.01). On the other hand, the normalised difference for hand grip strength (p > 0.08) and the isometric strength (p > 0.41) did not exhibit differences between the more and less affected limbs.
Plot of normalised difference between the more affected and less affected arms in terms of (a) the standard clinical scales, and (b) the isometric strength for the individual directions (boxplots in light red) and all directions as a whole (boxplot in dark red). A clear difference between the two arms can be seen with the clinical scales, but it is not so with the isometric strength. ARAT: Action Research Arm Test; MI: Motricity Index; MS: multiple sclerosis; NHPT: Nine Hole Peg Test.
Figure 5 summarises the different isometric control measures in the MS and healthy study populations. Statistical comparisons within and between the two populations were carried out by fitting different linear mixed effect (LME) models to the data for all isometric control measures except the COV. These models were then used to carry out an ANOVA comparing the fit between the appropriate models in order to test for a difference between the isometric force control measures between MS and healthy subjects, as well as for different directions, and between the more and less affected arms of MS subjects. COV was left out of the statistical analysis because of the strong violations of the assumption of equal variance for ANOVA.
44
Summary plot of the four isometric measures for the multiple sclerosis (MS) (red boxplots) and healthy (blue boxplots) study populations. The left column of plot compares the MS and healthy populations in terms of the different directions, while the plots on the right column compare the difference between the more affected and less affected arm for the MS population, and between the left and right arms for the healthy subjects. It must be noted that the y-axis scale for the coefficient of variation has been restricted to the interval (0, 0.3) to display the boxplot properly, but there were some outliers in the data well outside this interval.
Direction control was found to be significantly different between the MS and healthy populations
Sample entropy was not found to be significantly different between the MS and healthy populations
Spectral bandwidth exhibited the same trend as sample entropy. Comparing the MS population with the healthy subjects showed a clear difference when considering the reduced dataset
How are the different clinical scales related to each other? The correlations between the four clinical scales used in this study are summarised in a scatterplot shown in the Supplementary Material, Appendix A. As expected, we observed a strong correlation between the two impairment scales (MI versus hand grip strength), as well as between the two activity scales (NHPT versus ARAT). In contrast, the pairs of impairment scales and activity scales only have a moderate to low correlation.
How are isometric strength and control measures related between the different directions? The strength of the MS subjects for the six directions had moderate to high correlation with each other, with pairwise correlation coefficients Relationship between the four isometric measures for the multiple sclerosis (MS) (red) and healthy (blue) populations. The correlations coefficients for each pair of measures are shown on above the diagonal on the row and column corresponding to the measures. The Pearson correlation coefficients are displayed. The grey background of some of the plots indicates that the both the correlation coefficients corresponding to that plot are statistically significant (p < 0.05).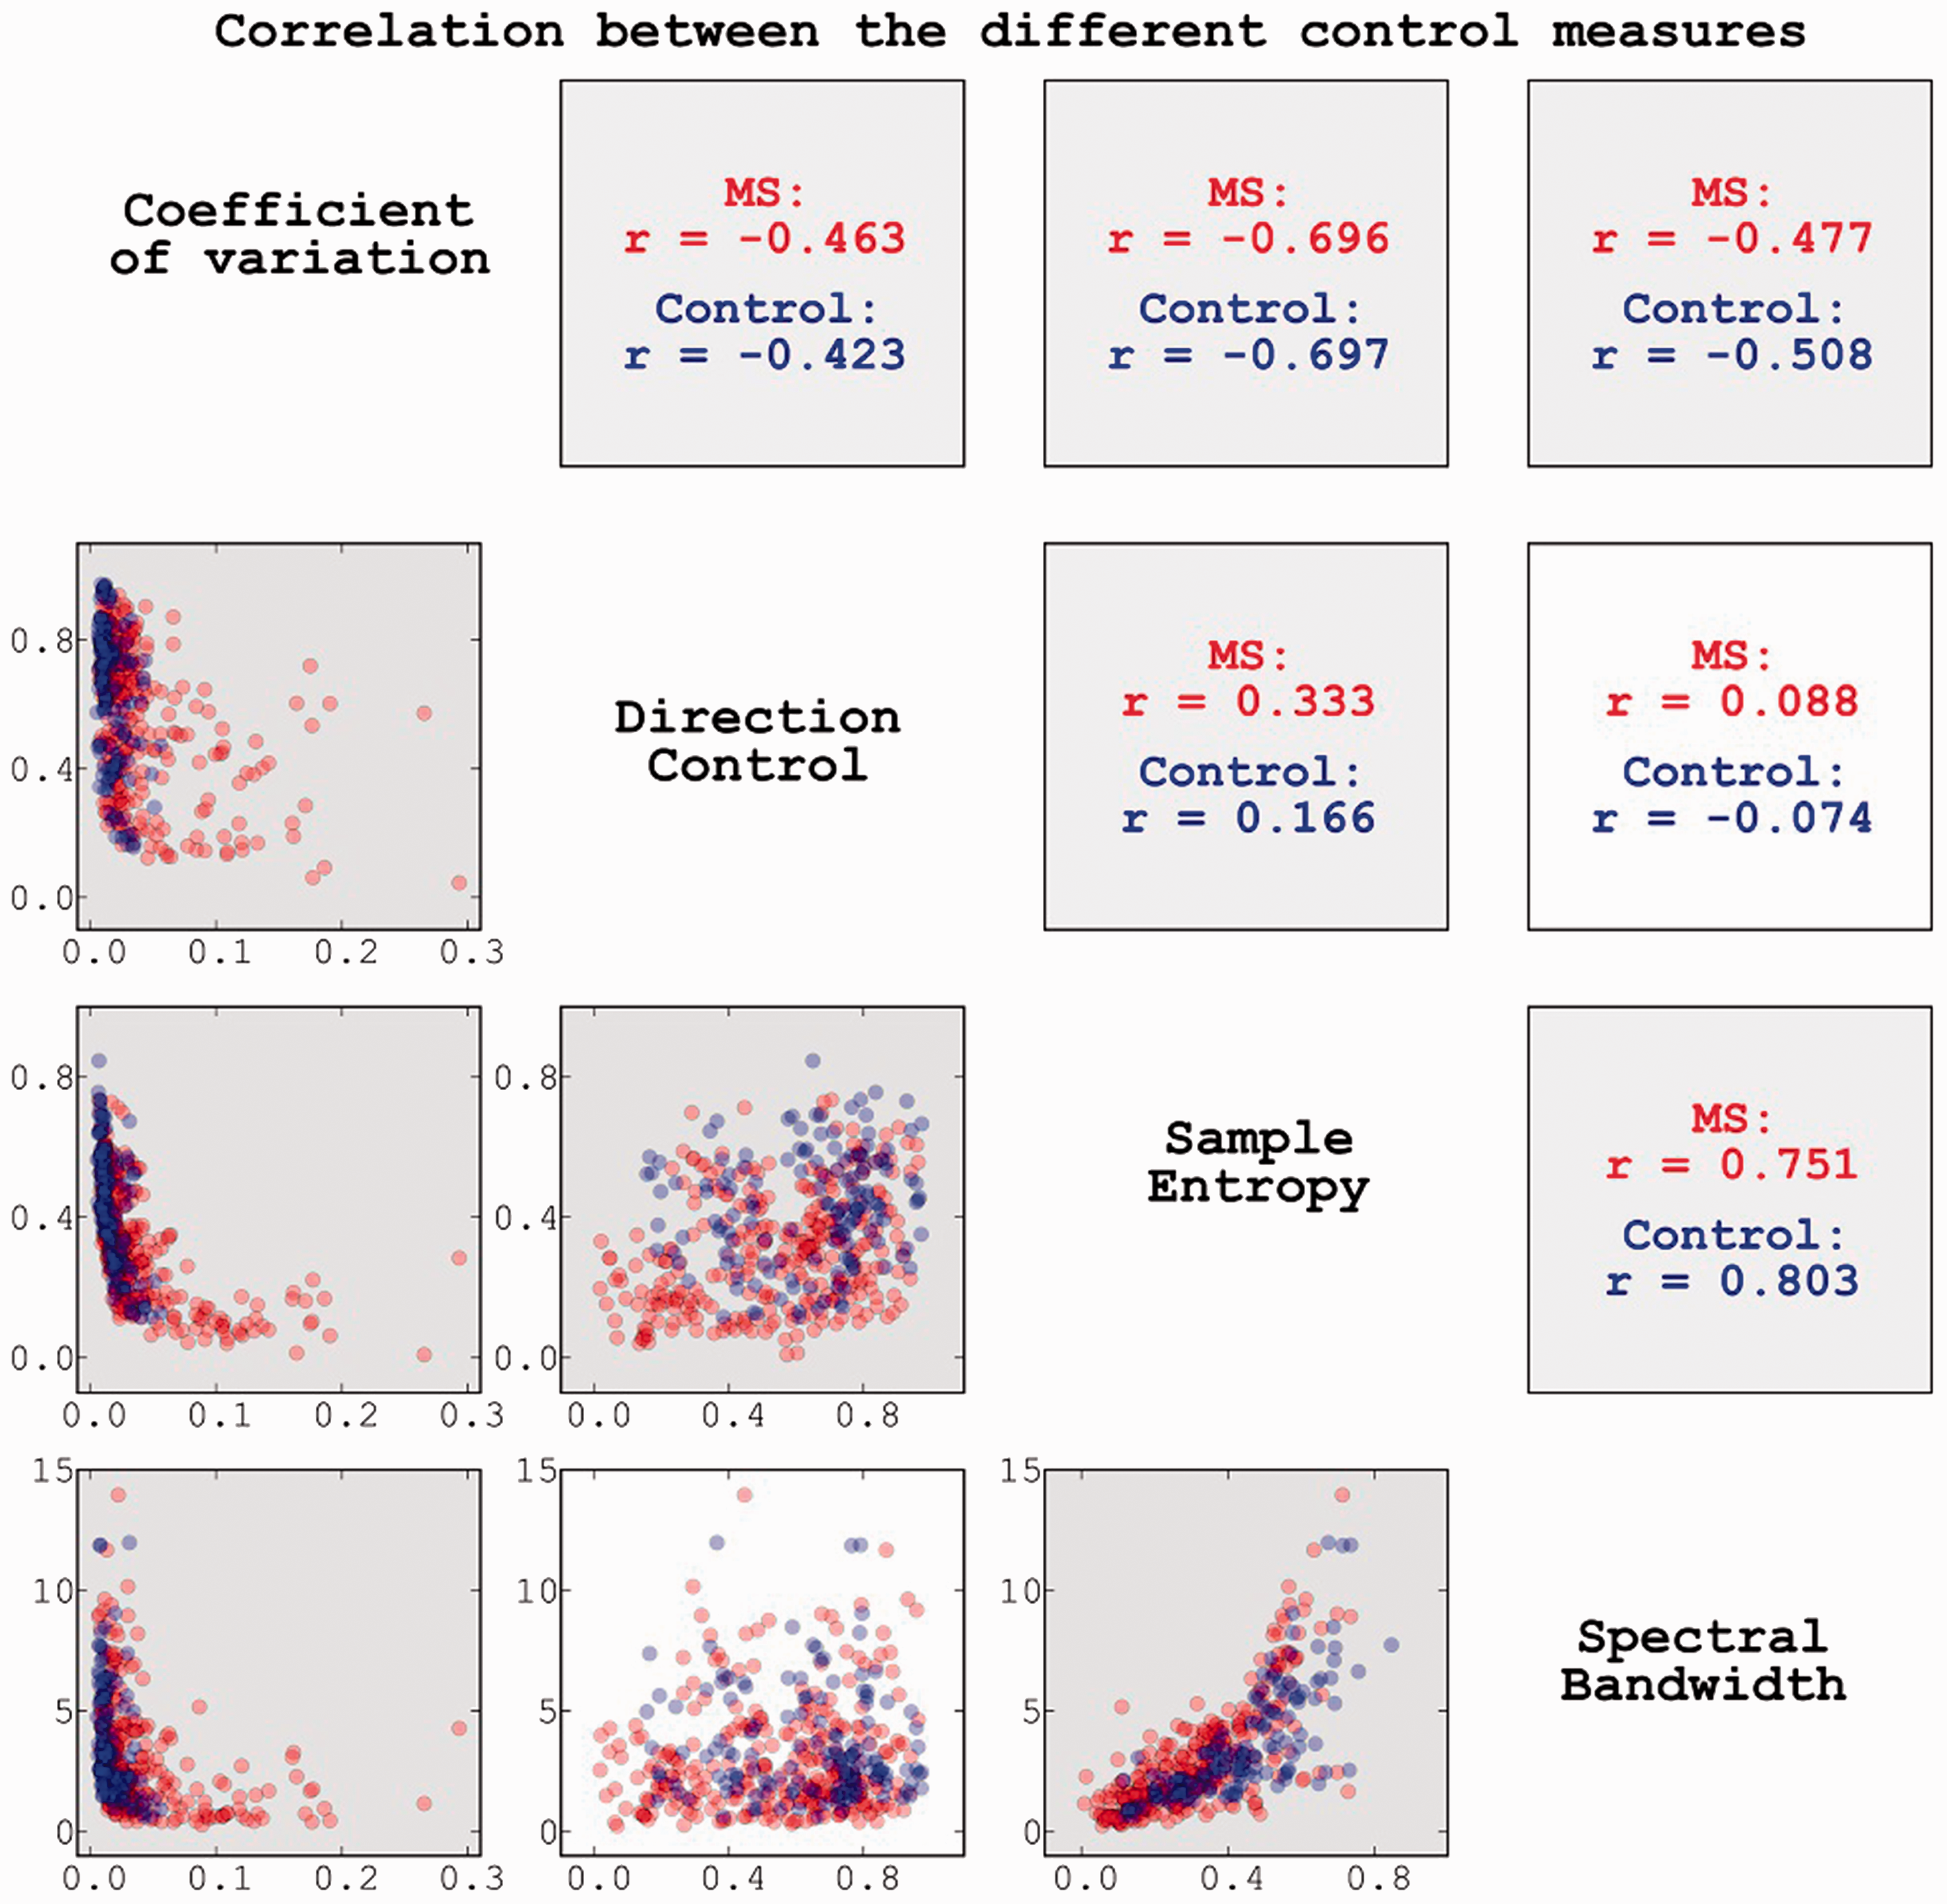
Correlation between the isometric strength and control measures for the different directions.
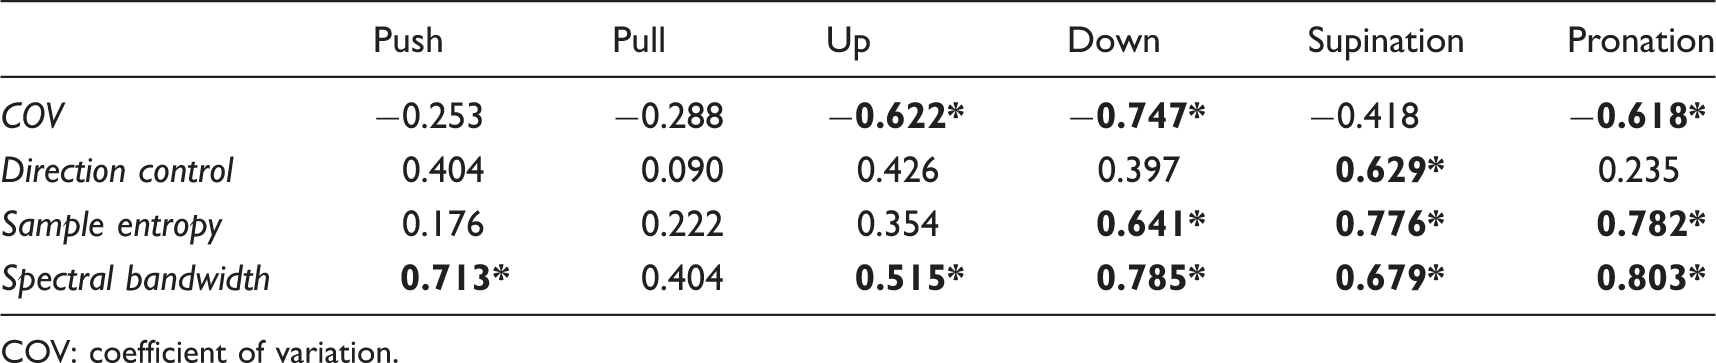
COV: coefficient of variation.
Correlation between the clinical scales and (a) isometric strength and (b) spectral bandwidth.

ARAT: Action Research Arm Test; HGS: hand grip strength; MI: Motricity Index; NHPT: Nine Hole Peg Test.
How are the isometric control measures related to the clinical scales? Among the four control measures, spectral bandwidth has moderate to high correlation with the impairment scales for all directions (except pull; see Table 3(b)). For bandwidth all directions except pull and up have correlation coefficients greater than 0.7 for MI, while down, supination and pronation were found to have correlations greater than 0.7 for hand grip strength (see Supplementary Material, Appendix C). On the other hand, a moderate correlation was observed with activity scales for push, down, supination and pronation.
Discussion
Our study investigated the relationship between isometric strength and control measures obtained from upper-extremity force/torque production task in six different directions (up, down, push, pull, pronation and supination) in MS patients using a simple isometric setup. The nature of the isometric strength and control for the different directions, the concordance of the information provided by strength and control measures, and their relationship to the standard clinical scales, were evaluated. The main observations are as follows.
Significant differences exist between MS and healthy subjects for isometric strength and control measures. Furthermore, control measures (spectral bandwidth and sample entropy) can be used for differentiating more and less affected arm of MS subjects. Spectral bandwidth (a measure of force control) is strongly related to the force/torque regularity as measured by sample entropy. Isometric strength and control, as measured by spectral bandwidth, are correlated for all directions except pull. Isometric strength for all six directions is correlated with the impairment scales (MI and hand grip strength). The same trend is observed for the spectral bandwidth except for the pull direction. For both strength and spectral bandwidth, pronation and supination directions have the highest correlation to MI and hand grip strength. The correlation of isometric strength and spectral bandwidth with the activity scales (NHPT and ARAT) are direction-dependent, with some directions having moderate to moderately high correlation and the rest having poor correlation.
These findings have implications for both our understanding of the sensorimotor impairments ensuing from MS and for the development of simple, effective and efficient isometric assessment setups and protocols to quantify sensorimotor ability.
Spectral bandwidth – a measure of control
Spectral bandwidth, a simple and intuitive measure of control that was introduced in this study, is based on the observation that for constant force/torque control tasks variations in the force/torque time series tends to occur at a lower time scale for MS subjects when compared to that of healthy subjects. In control theory terms, spectral bandwidth is a measure of how fast a system can correct errors. This measure is similar to some of the previously investigated Fourier spectrum based measures, particularly the spectral degrees of freedom. 18
The spectral bandwidth measure was found to correlate with the sample entropy, which is a time series regularity measure quantifying the rate of information generation. This strong relationship is in agreement with the previous work by Vaillancourt and Newell, who observed that the spectral slope and the spectral degrees of freedom have the similar trends to that of approximate entropy for different control tasks; 18 however, their study did not investigate the correlation between the different measures.
Regularity measures provide insight into the level of complexity of the system under study. The difference in the complexity of the sensorimotor output between young and old healthy adults has been found to be strongly dependent on task dynamics.18,28 While the regularity of force output is increased in older subjects for a constant force tracking task, for sinusoidal tracking tasks it is decreased relatively to younger subjects.18,28 In general, Sosnoff and Newell found that older subjects are not able to use the faster time scales of control when performing isometric force tracking of different random waveforms (such as white, pink, brown and black noise). 28 Thus, we hypothesise that even though regularity was different for these different waveforms, spectral bandwidth would be similar across the different waveforms, providing a measure of control ability that is independent of task dynamics. Interestingly, spectral bandwidth was found to remain invariant among the different directions tested in the current study – the mean values of the spectral bandwidth was not different for the six directions, and they were correlated to each other. It would be worth further investigating the spectral bandwidth measure to evaluate its usefulness as a task-independent measure of control ability.
Isometric strength and control are related to each other and between different directions
A strong relationship between isometric strength and isometric control, as measured by spectral bandwidth, was found for the six different directions tested in the study. This finding is in agreement with the study by Sosnoff and Newell who investigated the relationship between strength and variability in force output on young and old healthy subjects. 17 The authors found that stronger subjects had lower force variability and less regularity in their force output, thus indicating that variability in force output might be fundamentally related to strength. Our data extends this result to the studied MS population, in the upper extremity for six different functionally relevant movement directions.
In addition to this, isometric strength for the six different directions was found to be strongly correlated with each other. This is also in line with a previous observation that found strength deficits in the muscles of a limb to be correlated. 21 A similar trend was also observed for the spectral bandwidth (except pull vs. down). In particular, both strength and spectral bandwidth of the pronation and supination directions were found to be strongly correlated with that of the other directions. This means that assessing only the supination and pronation directions could provide a fast and effective isometric assessment of strength and control ability of the overall upper extremity.
Isometric strength and control correlate better with impairment scales than the activity scales
Isometric strength was found to have moderate to high correlation with the impairment scales (MI and hand grip strength), and a low to moderate correlation with the activity scales (NHPT and ARAT). The strong correlation of isometric strength with MI and hand grip strength is understandable, given that these are both strength based measures. This strong relationship is observed for all six directions investigated in the current study.
Unlike the impairment scales, the correlation between strength and the activity scales is direction dependent, with pull, up and pronation directions showing moderately high correlation and the other directions showing low correlation with both NHPT and ARAT. The primary reason for this is that ARAT and NHPT are possibly measuring a different construct, with strength as one of the sub-constructs. Also, ARAT and NHPT focus on hand function (manipulation of objects) and not general upper limb function, which was the focus of the isometric assessment. The specific directions that were found to correlate well with these two activity scales are consistent with the nature of the tasks constituting the activity scales. For example, the good correlation of up direction with ARAT makes sense as the grasp components of ARAT require subject to grasp different objects and transport them up on top of a shelf. Similarly, grasping some of objects in the ARAT and the pegs in the NHPT require subjects to place their hands in a pronated position, which possibly explains the high correlation between the pronation direction with these scales. On the other hand, the high correlation of the pull direction with ARAT and NHPT is not clear.
Similar to isometric strength, spectral bandwidth was also found to correlate with MI and hand grip strength scales for all directions, in particular strong correlation was observed for pronation and supination directions. The correlation of spectral bandwidth and NHPT and ARAT was also found to be direction dependent, with push, down, and pronation showing moderate correlation, and the others showing low correlation (with the exception of the pronation direction that has a moderate correlation with ARAT). It should be noted that these are the opposite movements of the ones from isometric strength that correlated well with ARAT and NHPT. Unlike the results of isometric strength, the results of spectral bandwidth are not easy to explain, as it is not clear how spectral bandwidth estimated on an isometric task relates to sensorimotor performance, in terms of kinematics or kinetics, of a particular task such as reaching or reach-and-grasp. This, in fact, is a general problem with measures that quantify the nature of variability (e.g. sample entropy, spectral degrees-of-freedom etc.).
The findings of the current study must be taken in light of its limitations. The size of the study population is small (N = 9), and most of the patients that participated in the study had mild sensorimotor impairments (Table 1). Thus the results of this study may not generalise to the general MS population, particularly patients with severe sensorimotor deficits. The small sample size could have also biased the outcomes of the ANOVA test and mixed effects model based on linear regression. The order of the task directions for the isometric control measurement in the protocol was not randomised, and thus any effect on the performance variables over time cannot be ruled out. One must also be cautious to generalise the current findings on isometric strength and force control, measured with hand grip position, as relations may be different for force control capacity of multiple fingers during the manipulation of objects. The task simplicity may also have favoured a simple strength criterion over the control criterion, and thus might not generalise to more complex tasks. Finally adjusting visual display with respect to each user could have affected the outcomes, as patients with low strength will notice a larger variance (visually) due to a higher visual gain.
Conclusions
The findings of the current pilot study indicate that in the MS study sample, isometric strength and isometric control, as measured by spectral bandwidth, for the upper extremity are well correlated among the six different directions – up, down, push, pull, supination and pronation. Isometric strength is also strongly correlated to spectral bandwidth for all six directions; this extends the previous result in healthy subjects that also found strength and control to be related. Isometric strength and spectral bandwidth are well correlated to the MI and hand grip strength for all six directions. In contrast, their relationship to NHPT and ARAT is direction-dependent with a moderate correlation magnitude. The results from this pilot study encourage the further investigation of these aspects in a larger, heterogeneous MS population sample.
Footnotes
Declaration of conflicting interests
The authors declare that they have no competing interests.
Funding
This work was funded in part by the EU-FP7 grant numbers PEOPLE-ITN-317488-CONTEST, ICT-601003 BALANCE, ICT-611626 SYMBITRON and by H2020 grant number ICT-644727 COGIMON.