
Abstract
How does industrial concentration influence performance outcomes in government contracting? This paper hypothesizes that concentration influences contract performance directly, as well as indirectly through reducing competition for contract awards. Tests of these hypotheses on a large dataset of US defense contracts reveal nuanced results. Increasing concentration is directly associated with a higher likelihood of contract terminations, and remains the same even after accounting for levels of competition (suggesting competition does not mediate the influence of concentration on this performance indicator). Contrary to expectations, higher competition is associated with a higher rather than a lower likelihood of terminations. Concentration is not associated with the incidence of cost ceiling breaches, and competition resulting in single (rather than multiple) offers is associated with a lower likelihood of a breach. When a breach has occurred, however, higher concentration is associated with larger breaches sizes, and higher competition with smaller breach sizes. Combined, these results partially support concerns about a connection between concentration, market power, and diminished performance incentives but suggest that the nature of these relationships depends upon the indicator of contract performance being considered.
Introduction
In recent years, economists, policymakers, and other observers have expressed growing concern over industrial concentration and the threat of monopolies in the US economy. For example, available data suggest concentration—the degree to which fewer rather than more firms account for production in a given industry—has increased significantly in US retail, utilities, and financial services and remains high in manufacturing (Autor et al., 2020). A principal concern about increasing concentration in these industries and others is that it can confer market power that firms may use to their advantage, such as through charging excessively high prices or making low quality products, or through erecting barriers to entry that rob consumers of potential benefits from competition (Kovacic and Shapiro, 2000).
As some of the world’s largest buyers of goods and services, heightened industrial concentration is also of concern to governments. Nonetheless, relative to the literature on how concentration affects individual consumers, workers, and businesses in the economy, questions of how growing concentration could impact government have received less attention. Extant research on government contracting warns of the challenges posed by thin markets—those with few buyers or sellers and little opportunity to use the credible threat of replacement by a competitor as a disciplining device, thus generating lock-in risk (Williamson, 1996)—but this work is either theoretical, or focused on small numbers of cases involving governments contracting for highly complex products in specific industries or market settings (Brown et al., 2010, 2016; Kettl, 1993; Van Slyke, 2003). This paper provides an empirical analysis that systematically examines the relationship between industrial concentration, levels of competition, and government contract outcomes in a large sample involving goods and services across a wide range of industries.
The main research question is: how does industrial concentration influence performance in government contracting?
The paper hypothesizes concentration influences performance in two ways: first, directly, and second, indirectly, through reducing competition for government contract awards. To test these hypotheses, the paper draws on a large sample of US federal defense contracts and incorporates economic statistics on levels of concentration in industrial sectors over time. The US government spends over a half trillion dollars annually through contracts, of which the Department of Defense (DOD) accounts for roughly two thirds—making it by far the largest buyer of goods and services at the federal level. Moreover, the DOD buys goods and services of numerous types, including products closely related to its national defense mission but also an array of supplies, services, and equipment used by all government agencies. Combined, such scale and scope make the DOD an important case to consider in its own right while, at the same time, providing an opportunity to uncover more generalizable insights regarding the relationships between concentration, competition, and performance outcomes in the government contracting enterprise.
Building on recent research (e.g., Brunjes, 2019; Girth and Lopez, 2019), this paper defines contract performance as whether or not a contract is fully or partially terminated before completion of the scope of work; whether or not a contract breaches its initially established cost ceiling; and the size of a ceiling breach, given its occurrence. Insofar as government concludes (or “closes out”), many contracts upon work being finished (even if the work per se varies from high quality to minimally acceptable), early termination reflects significant dissatisfaction or poor alignment with government’s expectations—making it a telling performance indicator (Brunjes, 2019). Likewise, cost ceiling breaches—here defined as increasing the initially established ceiling so as to accommodate changes in the scope of work—can indicate issues stemming from insufficient planning, poor execution, or inability to adapt within the confines of the original contract terms. Accordingly, it also conveys important information about contract performance and allows for analyzing performance using multiple indicators rather than just one or another exclusively.
Results of regression analyses examining these outcomes present a nuanced picture. Increasing concentration is directly associated with a higher likelihood of contract terminations, and this relationship remains the same after accounting for levels of competition (suggesting competition does not mediate the influence of concentration on this performance indicator). Contrary to expectations, higher competition per se makes terminations more rather than less likely. Concentration is not associated with the likelihood of cost ceiling breaches, and single- rather than multi-offer contract awards make ceiling breaches less likely. When a breach has occurred, however, higher concentration is associated with larger breaches sizes and higher competition with smaller breach sizes. Taken together, these results partially support concerns about a connection between concentration, market power, and diminished performance incentives but suggest that the nature of these relationships depends upon the indicator of contract performance being considered. Accordingly, future research should devote further attention to how concentration and competition influence different dimensions of contract performance.
The remainder of this paper is organized into five sections. The first reviews existing literature on the definition and measurement of industrial concentration, its causes, and its relationship with performance outcomes in the context of government contracting. The Hypotheses section develops and posits hypotheses regarding the relationship between industrial concentration, competition, and government contracting outcomes. The following section describes data and methods; the next presents results; and the final section discusses the results and their implications for future research and practice. A short conclusion follows.
Literature review
Industrial concentration: Definition and measurement
Industrial concentration is the degree to which a smaller versus larger number of firms account for production or other measures of market share (e.g., revenue) in some part of the economy.
Taking this idea as a point of departure, a now voluminous literature has developed around alternative approaches to measuring concentration in practice (for an early and thorough review, see Curry and George, 1983; for a more recent summary, see Shapiro, 2018).
One approach is concentration ratios, which sum the individual market shares of a pre-determined number of firms (commonly the top four, eight, 20, or 50) in a particular market or industry. The upside of this approach is its simplicity: concentration ratios are relatively easy to calculate and do not require using market share data on every single firm in the market or industry of interest. The downside is that the number of firms used to calculate the ratio is ultimately arbitrary, and even larger ratios (e.g., 20 or 50, rather than four or eight) may account for only a subset of all the relevant firms (Shugart, 2000).
An alternative approach is to calculate the Herfindahl-Hirschman Index (HHI), which accounts for the market share of each and every firm in the market or industry under consideration and sums the squares of each firm’s market share figure. This approach requires more information, but counts every relevant firm and weights leading firms more heavily. Whereas concentration ratios are expressed in percentage terms (with a 100 percent maximum), the HHI varies between a minimum of 0 and a maximum of 10,000 (where one firm accounts for 100 percent of the market, and 1002 = 10,000).
Causes of industrial concentration
Variation in industrial concentration may reflect an underlying decline in competition and attendant increases in market power for leading firms—one interpretation of recent trends in the USA, including among policymakers and public officials (see, e.g. White House Council of Economic Advisors, 2016). However, this still raises the question of where concentration comes from in the first place. Industrial concentration may stem from several sources.
Economies of scale
Higher industrial concentration may result from economies of scale, a technological feature of production that leads per unit production costs to fall as output rises, meaning an industry’s aggregate output can be most efficiently produced by a smaller rather than larger number of firms (Carleton and Perloff, 2015). In extreme cases, economies of scale are so high as to make it most efficient for a single firm to produce all of an industry’s output, a situation referred to as a natural monopoly (Posner, 1969; Kunneke, 1999).
Learning curves
Similarly, production may be subject to learning curves, where per unit costs fall as firms get better at producing output. Manufacturing of large capital assets like ships, planes, or construction equipment is often suggested to feature the learning curve dynamic because, while this activity may initially entail high costs for design and early unit production, per unit costs may fall as production expands and the firm becomes more adept in the manufacturing process (Wright, 1936).
Strategic behavior
Firms may also create barriers to entry or force competitors out through strategic behavior like predatory pricing, hostile takeovers, or alternative forms of vertical acquisition where an incumbent firm acquires lower-level suppliers (thus eliminating potential sources of productive inputs that new entrants need in order to operate). Incumbent firms may act alone to create entry barriers, or collude with one another for this purpose. A commonly cited example of collusion to prevent competition involves incumbent firms cooperating to divide up customers and exclude new entrants in lieu of vying with each other (Harrington, Jr., 2006). Such conduct has been suspected or documented in industries as diverse as health insurance and chemicals (see, e.g. de Roos, 2006).
Government policy
In some instances, governments purposefully erect structural barriers to entry that may limit competition otherwise likely to arise. Governments may create entry barriers through extending protections for intellectual property and innovation (e.g., through patents), through establishing legal and regulatory requirements that must be fulfilled in order to do business in a particular area, or by granting only one or a few firms permission to do a form of business (thereby foreclosing competitors from entering the market). Taxis are an often-cited and studied example of a monopoly that city governments have created through regulations such as requiring the purchase of a medallion to drive a cab (see, e.g. Moore & Balaker, 2006).
Market monopsony
Finally, monopsony—where a market includes a single buyer—can also be a barrier. For example, the defense industry sells its products predominately to the US government, from which decisions about policy, budgets, and procurement priorities can significantly impact defense industry structure. This is amplified by a documented preference within government agencies to provide contracts to firms with political connections—connections made increasingly possible through control over a market (Ferris et al., 2019).
Industrial concentration, competition, and performance
Past research examining the linkages between industrial concentration and performance outcomes emphasized financial dimensions of firm performance, finding, for example, positive associations between concentration, profits, and prices (Hall and Weiss, 1967). Whether this association reflects firms exercising market power to charge excessively high prices and make additional profits is less clear, however. Some research attributes the observed link between concentration and profits to efficiency gains stemming from learning and harnessing scale economies (Demsetz, 1973, 1974). These arguments suggest that efficiency-enhancing concentration generates reductions in both prices and costs but greater reductions in the latter rather than the former (Peltzman, 1977). This finding is supported by other research demonstrating that, after controlling for firm size, the relationship between concentration and profitability is less strong, which suggests that profit growth comes from efficiencies brought about by increasing the scale of production, of which increased concentration is just a byproduct (Brozen, 1982). More recent research comes to the opposite conclusion, though, finding robust connections between growing concentration, profits from both ongoing business as well as from mergers and acquisitions, and higher stock prices. (Grullon et al., 2019). To the extent it stems from factors such as reductions in competition and barriers to entry (whatever their source)—rather than economies of scale, learning effects, or other forces that reflect a firm’s active pursuit and realization of enhanced efficiency—industrial concentration is concerning because it can reduce economic welfare and generate market power that firms may use to extract rents in the form of higher prices to consumers (Carleton and Perloff, 2015).
Compared to research on relationships between concentration, competition, and financial outcomes like profitability, there has been less research on the implications of concentration for other performance outcomes of interest. As a result, explicitly examining links between concentration and firm performance along non-financial dimensions is a focus area still open for study.
Moreover, compared to research on the private sector, less work has been done to examine the implications of industrial concentration in the public sector, specifically in public procurement and contracting. Scholars and practitioners often argue markets with more firms—and ostensibly, more competition—are a key prerequisite for success when government contracts for goods and services, and that government should aspire to create and maintain competitive environments to the greatest extent practical (see, e.g. Gansler, 2011; Janiga et al., 2013). These arguments are further reflected in concerns about so-called “thin markets” where, particularly for more complex products, markets may feature fewer sellers and raise the risk of government being locked-in to an incumbent that faces no credible threat of replacement (Brown et al., 2010, 2016; Kettl, 1993; Williamson, 1996). However, this work is either theoretical, or based on case studies involving governments contracting for highly complex products in specific markets or industries.
Research that systematically explores the links between concentration, competition, and public procurement outcomes appears less frequently in the existing literature. This is despite the fact that governments, including the US federal government, are among the largest buyers of goods and services in the world. This is especially the case in national defense, where contract spending may account for large portions of annual defense budgets—upwards of 50 percent in the case of the US DOD (Carril and Duggan, 2020). Accordingly, it would seem especially relevant to examine relationships between concentration, competition, and contracting outcomes in the defense context. Few studies do, however.
One example is an analysis finding a positive relationship between concentration and firm profitability in the aerospace industry (Davis, 2006). Another finds that increased market concentration within the defense industry makes the procurement process less competitive, leading to more single-bid solicitations (Carril and Duggan, 2020). A third finds statistically significant changes in either total or per-unit costs of select weapon systems—often in the direction of lower costs—following a merger (Hensel, 2010). More closely related to the research presented in this paper, one study finds evidence that some defense industry mergers generated cost savings in Major Defense Acquisition Programs (MDAPs)—or large DOD procurement programs involving multiple contracts for the research, development, production, and maintenance of complex assets—but also found that mergers do not categorically generate program-level savings (Hoff, 2007). Unlike our article, however, this study focused on financial dimensions of performance at the program rather than the contract level (i.e., on performance aggregated across multiple contracts and time periods, rather than per contract transaction). This study extends the literature by looking at both financial and non-financial dimensions of performance, and considers outcomes at the individual contract level.
Hypotheses
This paper posits and tests hypotheses linking industrial concentration and contract performance in two ways: first, directly, and second, indirectly, where concentration influences performance through reducing competition for government contract awards. Specified in this manner, the argument broadens the approach to observing the relationship between concentration and contract performance, accounting for multiple ways that the two variables may be connected.
Industrial concentration and contract performance—direct relationship
The most straightforward way that industrial concentration impacts different markers of contract performance is through a direct relationship between the two variables. That is, changes in the level of industrial concentration are associated directly with changes in alternative performance benchmarks.
While arguments about concentration and contract performance may suggest the two are negatively related—with higher concentration leading to poorer performance—these arguments usually imply the presence of a mediating variable. Competition is one such variable, with the argument (as laid out below) being that growing concentration reduces the number of alternative sellers with which a buyer can work, thus (for instance) reducing incumbent seller (or vendor) incentives to perform well and leading to worse outcomes.
Arguments that do not imply or explicitly reference a mediating variable—but instead posit a direct concentration-performance link—are agnostic with respect to whether growing concentration levels foster better or worse performance. Therefore, for hypothesis testing purposes, this study does not suggest the direct relationship between concentration and contract performance is positive or negative. Instead, it simply hypothesizes that the former may have a direct influence on the latter:
Industrial concentration and contract performance—indirect relationship
While concentration and contract performance may be directly related, one common argument is that higher concentration negatively impacts performance by hindering competition that would otherwise act to discipline incumbent vendors. All else equal, greater competition gives the government greater control in their relationship with vendors, providing multiple options for replacement and motivating the incumbent to perform well. The argument is that higher concentration effectively blunts these forces through reducing the number of vendors from which government can select to award a contract, thus reducing the incumbent vendor’s incentive to perform effectively since the prospect of being replaced is now lower. The incumbent may therefore be less motivated to innovate, to control costs, or to otherwise ensure its product meets or exceeds government requirements. This line of reasoning points implies a link between competition and performance outcomes, where reduced competition makes poorer performance more likely. In other words:
Data and methods
Data sources and structure
The primary source of data for this study is the Federal Procurement Data System (FPDS), which tracks all prime federal contract transactions worth US$3500 or more, conducted by most US government department and agencies. The study team used FPDS to create the contract and task order dataset, which expands and updates a dataset used in previous CSIS reports on fixed-price (Sanders et al., 2015) and crisis contracting (Sanders and Hunter, 2017).
This dataset was supplemented with economics statistics broken down by North American Industrial Classification System (NAICS) category, as reported for the years 2007 and 2012 by the US Census and Bureau of Labor Statistics.
In this dataset, each contract award entry has a unique procurement identifier, and each task order entry has a unique combination of a parent award identifier and procurement identifier. 1 For brevity, when this paper refers to contracts, it includes both awards and task orders. The dataset includes all completed DoD contracts initiated between the fiscal years 2008 and 2015. 2 The data set contains over 8.3 million entries, of which 18.9 percent were removed due to missing data, primarily with reference to undefinitized contract awards (UCA). These removed entries accounted for about 11.5 percent of obligations in the original populations. For computational reasons, the analysis was limited to a random sample of 1 million contracts from the filtered dataset.
The primary addition to the datasets used in previous reports relates to the NAICS. First, the top detailed industry (NAICS 6-digit code) was calculated for each contract in the dataset. Second, a measure for industrial concentration was added, calculated at the subsector (NAICS 3-digit code) and detailed industry level. Third, the team incorporated US-wide information on the total revenue of subsectors and detailed industries, as well as the average US wage in detailed industries. Contracts that start in 2008 to 2012 rely on the 2007 economic statistics, while contracts that start from 2013 to 2015 rely on the 2012 economic statistics. For more detail on data sources and structure and for access to this dataset, see the supplemental material.
The choice of dependent variables, discussed in the next session, was driven by the data available within FPDS. To those with full access to US acquisition datasets, the Contractor Performance Assessment Reporting System, as well as Earned Value Management data, measure contract performance more directly than FPDS, but even with improving availability, these datasets are out of reach for more for most researchers. 3 Performance data at the project-level is more easily available from the Selected Acquisition Reports but is almost exclusively focused on MDAPs. 4 The terminations and ceiling breach metrics discussed below that we have chosen to develop offer a more limited view than these alternatives but are available for a dramatically wider range of contracts and to all interested researchers and practitioners. We believe that these measures could aid in a wide range of contract research and discuss in the conclusion potential next steps both for acquisition research and for refinement of these metrics.
Measures of dependent and study variables
This section introduces the key variables used in our regression model. Due to wide variation in values, all of the continuous input variables in this study have been transformed logarithmically and then rescaled such that a value of 0 corresponds to the geometric mean and a one-unit change in the transformed variable corresponds to a two standard deviation change in the log of the original input. This approach is used to more easily cross compare the magnitude of the coefficients of variables with different base scales. Gelman and Hill specifically recommend dividing by twice the standard deviation so that the continuous variables may also be more easily compared with dummy variables that have not been recentered (Gelman and Hill, 2007: 55–57).
Dependent variables
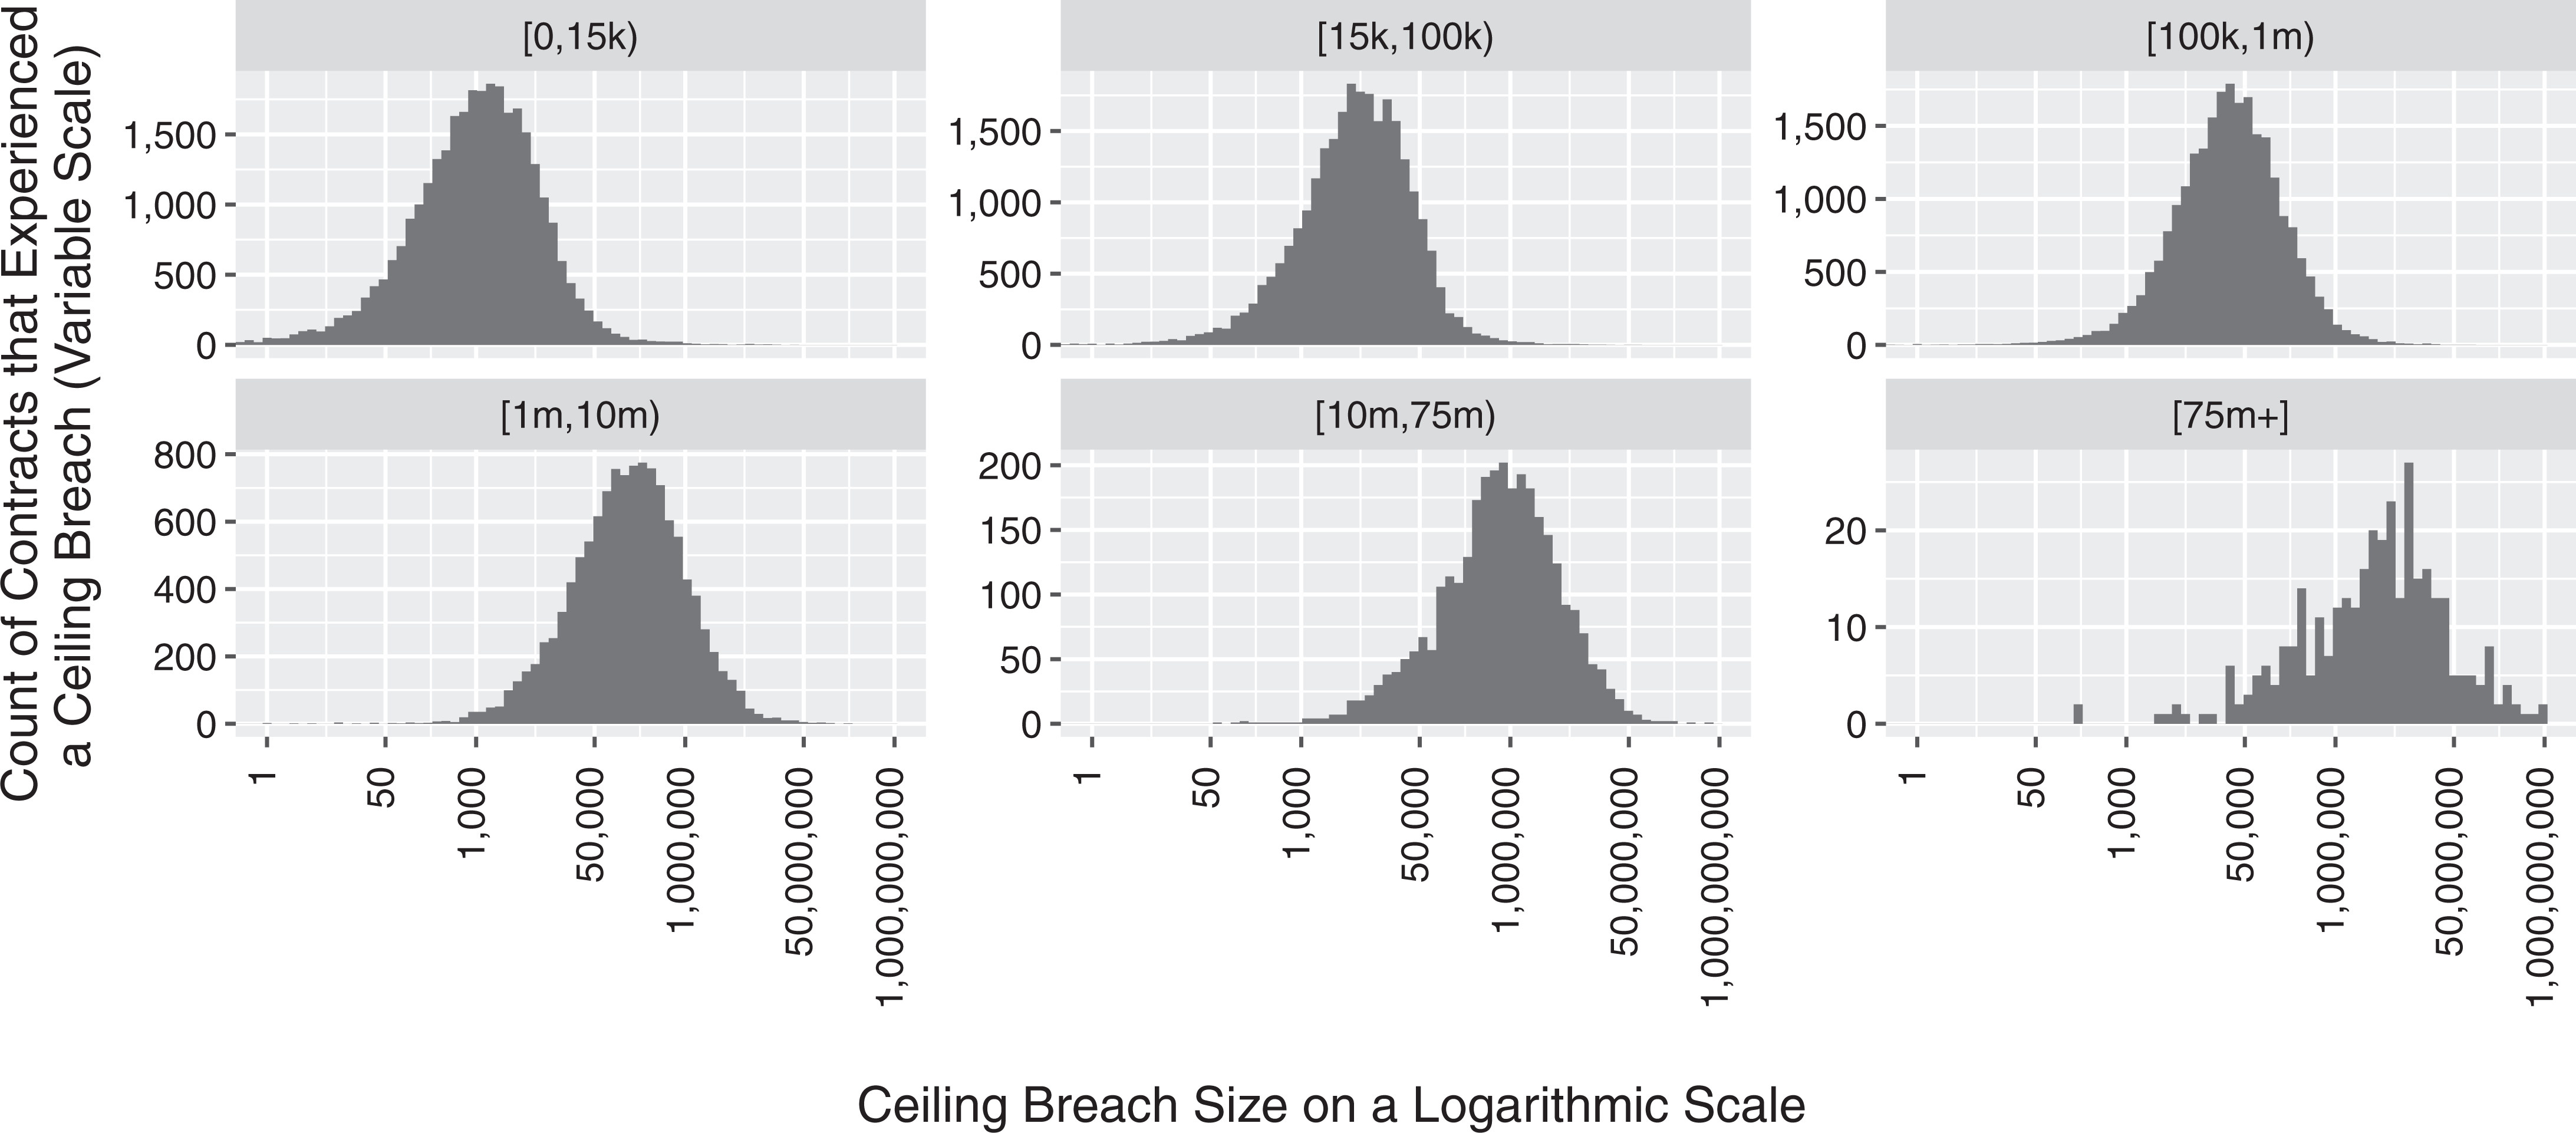
Distribution of ceiling breach size by unmodified contract ceiling size category.
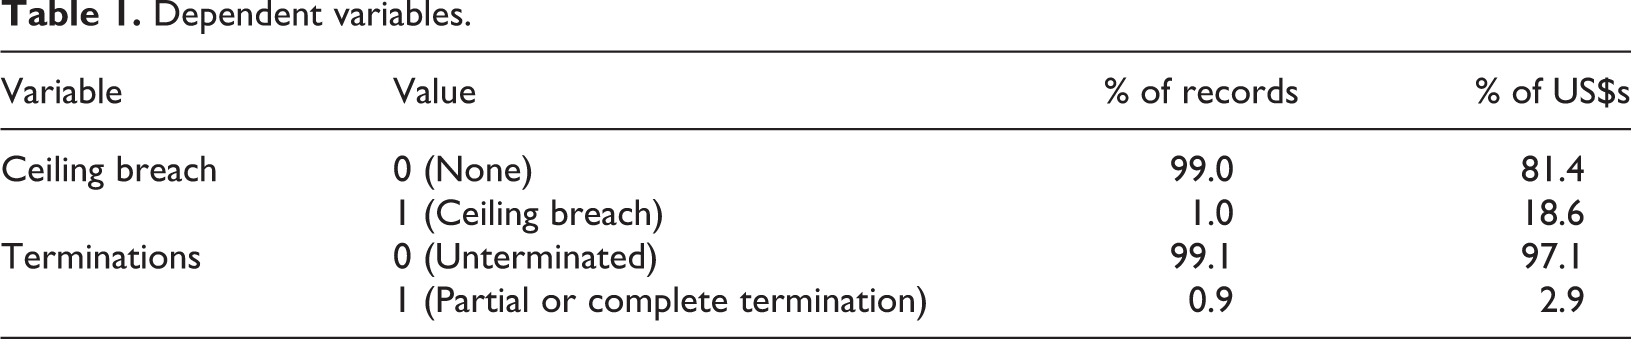
A slim fraction of terminations overlaps with ceiling breaches, despite both measures accounting for a similar percentage of contracts. See Table 1 for a breakdown of these variables. Both measures are rare and focused on bad outcomes, which makes these metrics appropriate examining the risk of costly failures or overruns but not applicable to examining relative degrees of success. 6
Dependent variables.
Study independent variables
Possible values for competition.
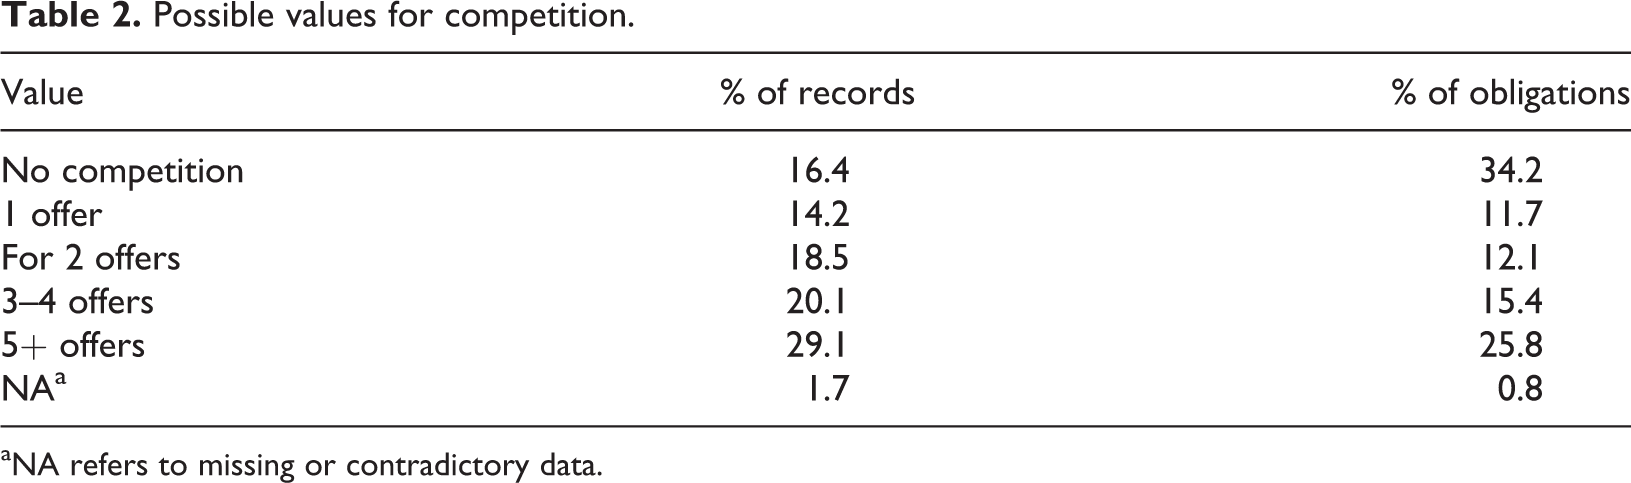
aNA refers to missing or contradictory data.
The authors chose to define markets using the six-digit NAICS detailed industry code which are nested within three-digit NAICS subsector codes. This choice includes the most detailed NAICS measure and also the highest measure that does not clump the majority of contracts and obligations within only a few categories. All else equal, defining a sector more broadly—and thereby including more firms—will tend to reduce concentration levels, whereas a more precise definition will raise them. Figure 2 shows eight of the top subsectors, selected for having most obligations over the study period, with the HHI as well as defense obligations and ratio of defense obligations to US revenue shown, all in their original form. The dotted lines are the lower and upper bounds of what the DOJ considers to be a moderately consolidated market. In the dataset, this measure is lagged by one year. Figure 3 does the same for eight of the top detailed industries.
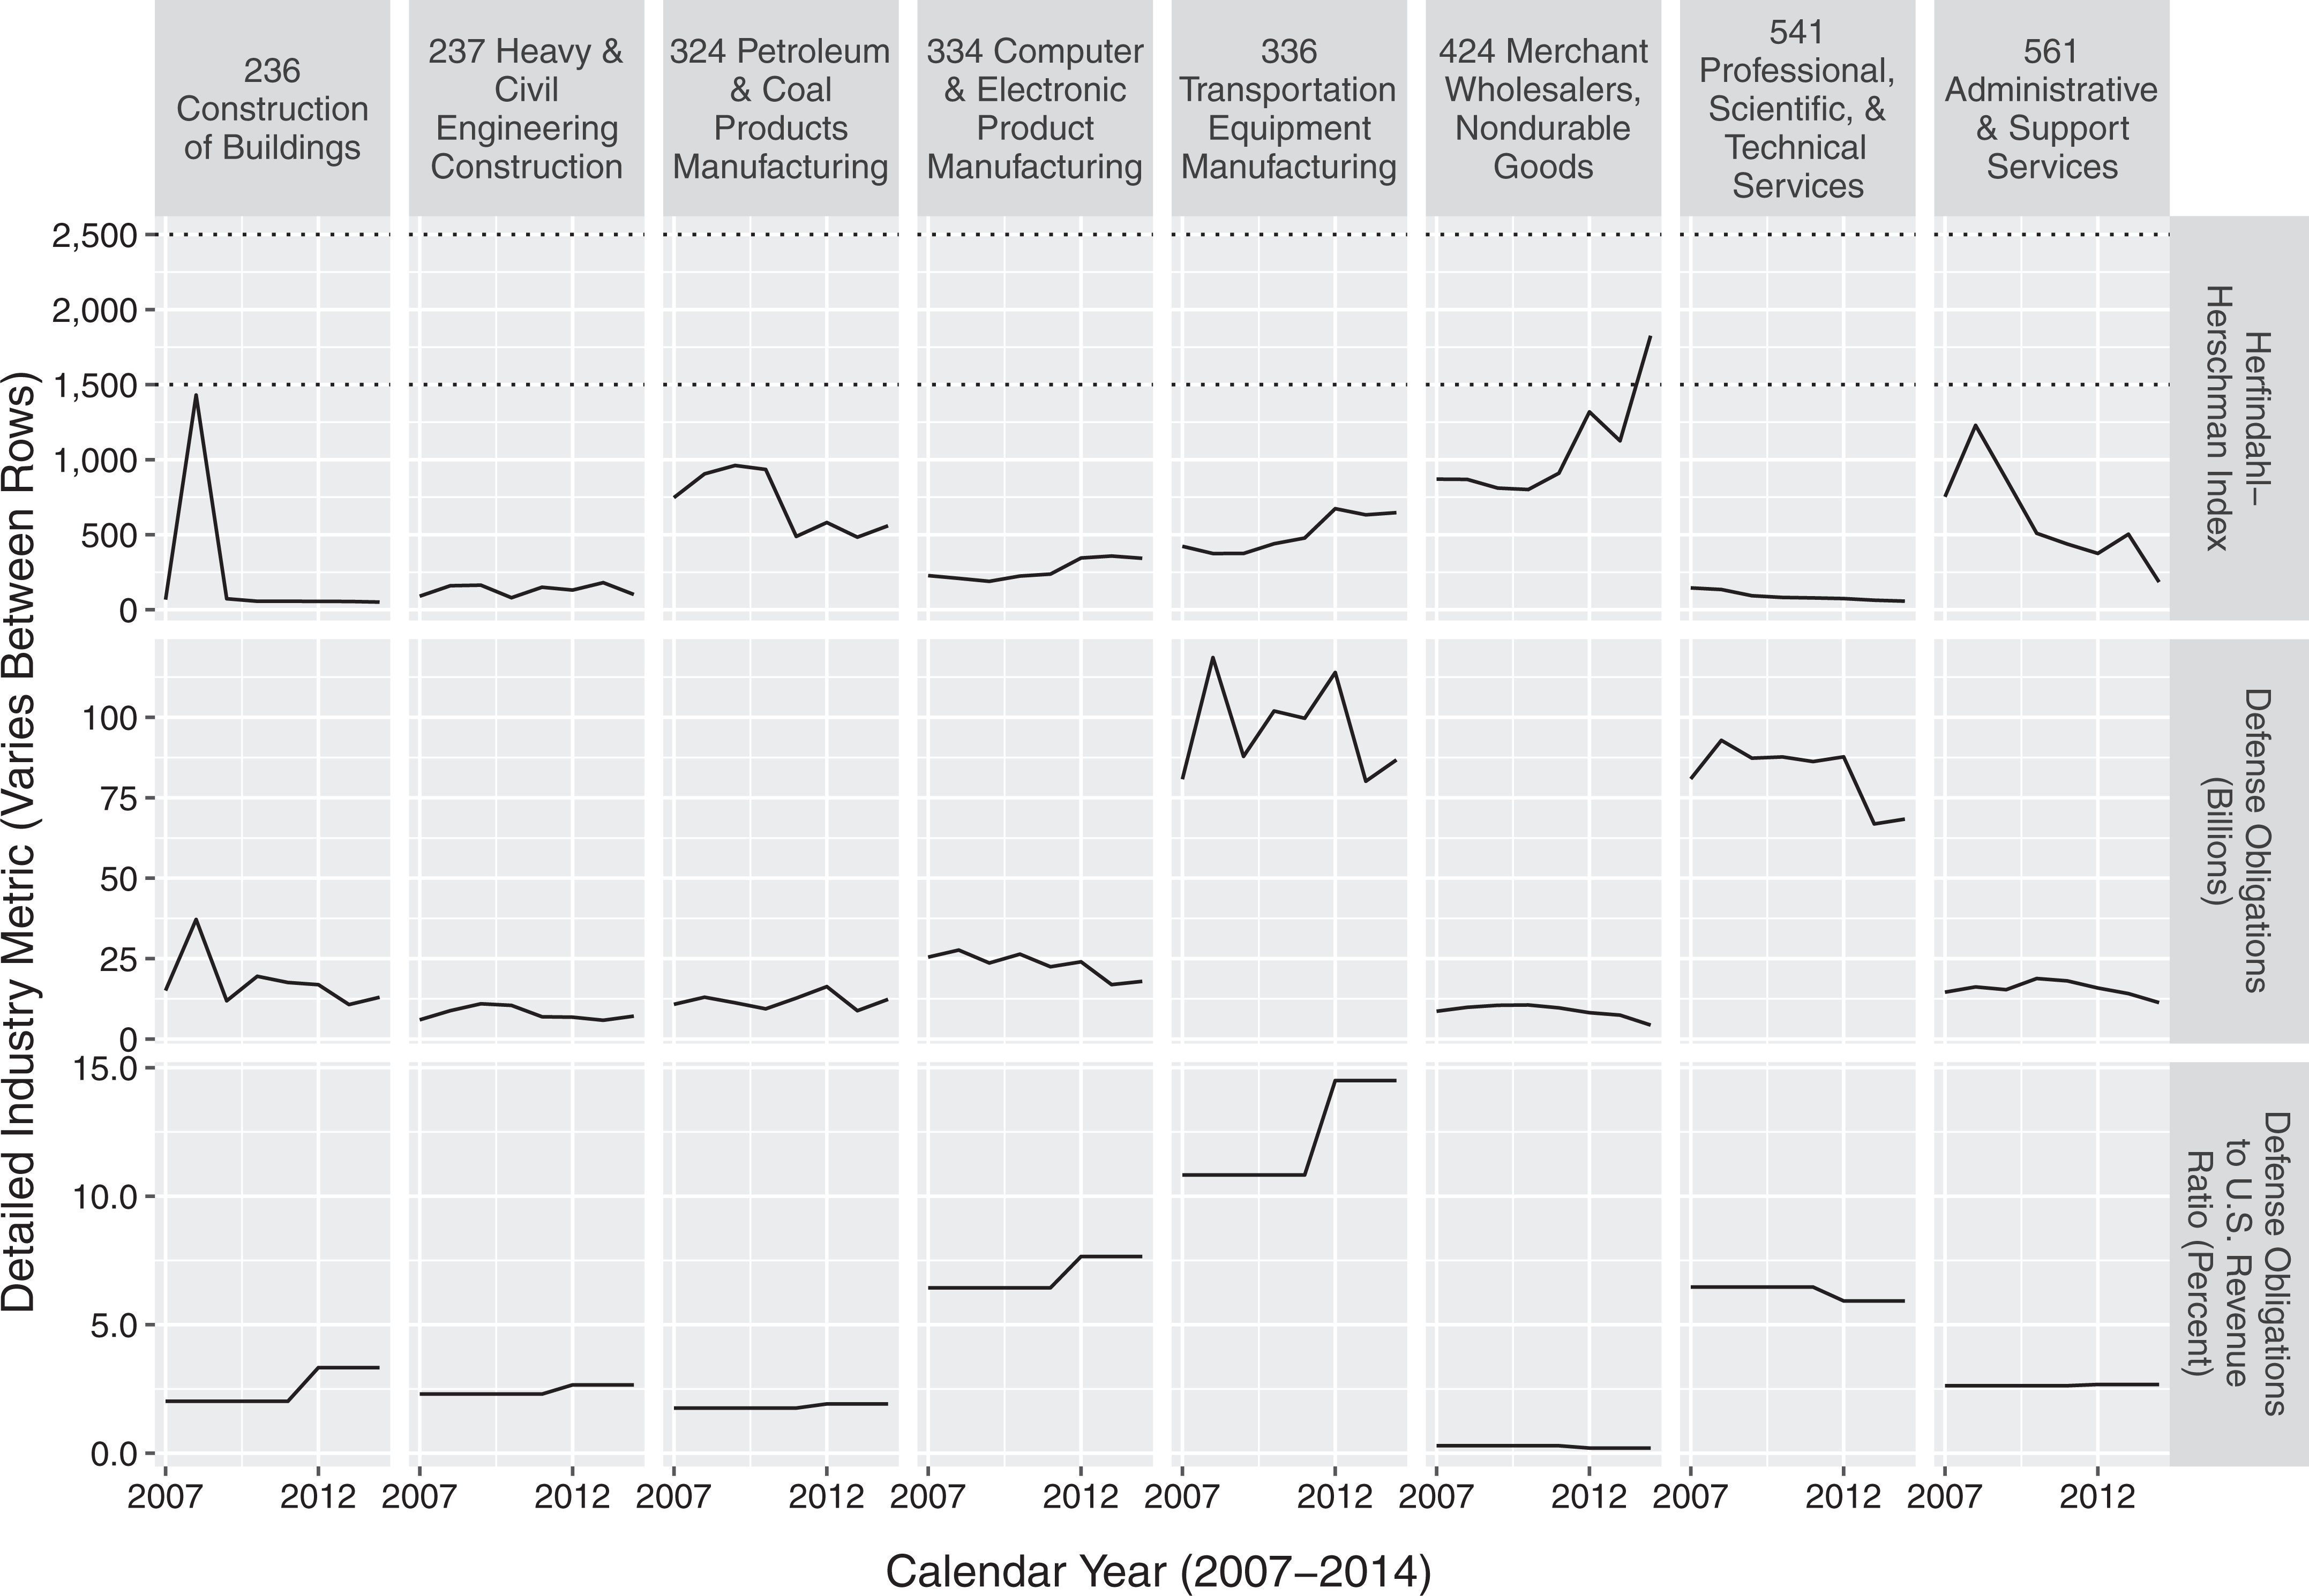
Concentration in selected defense-subsector categories.
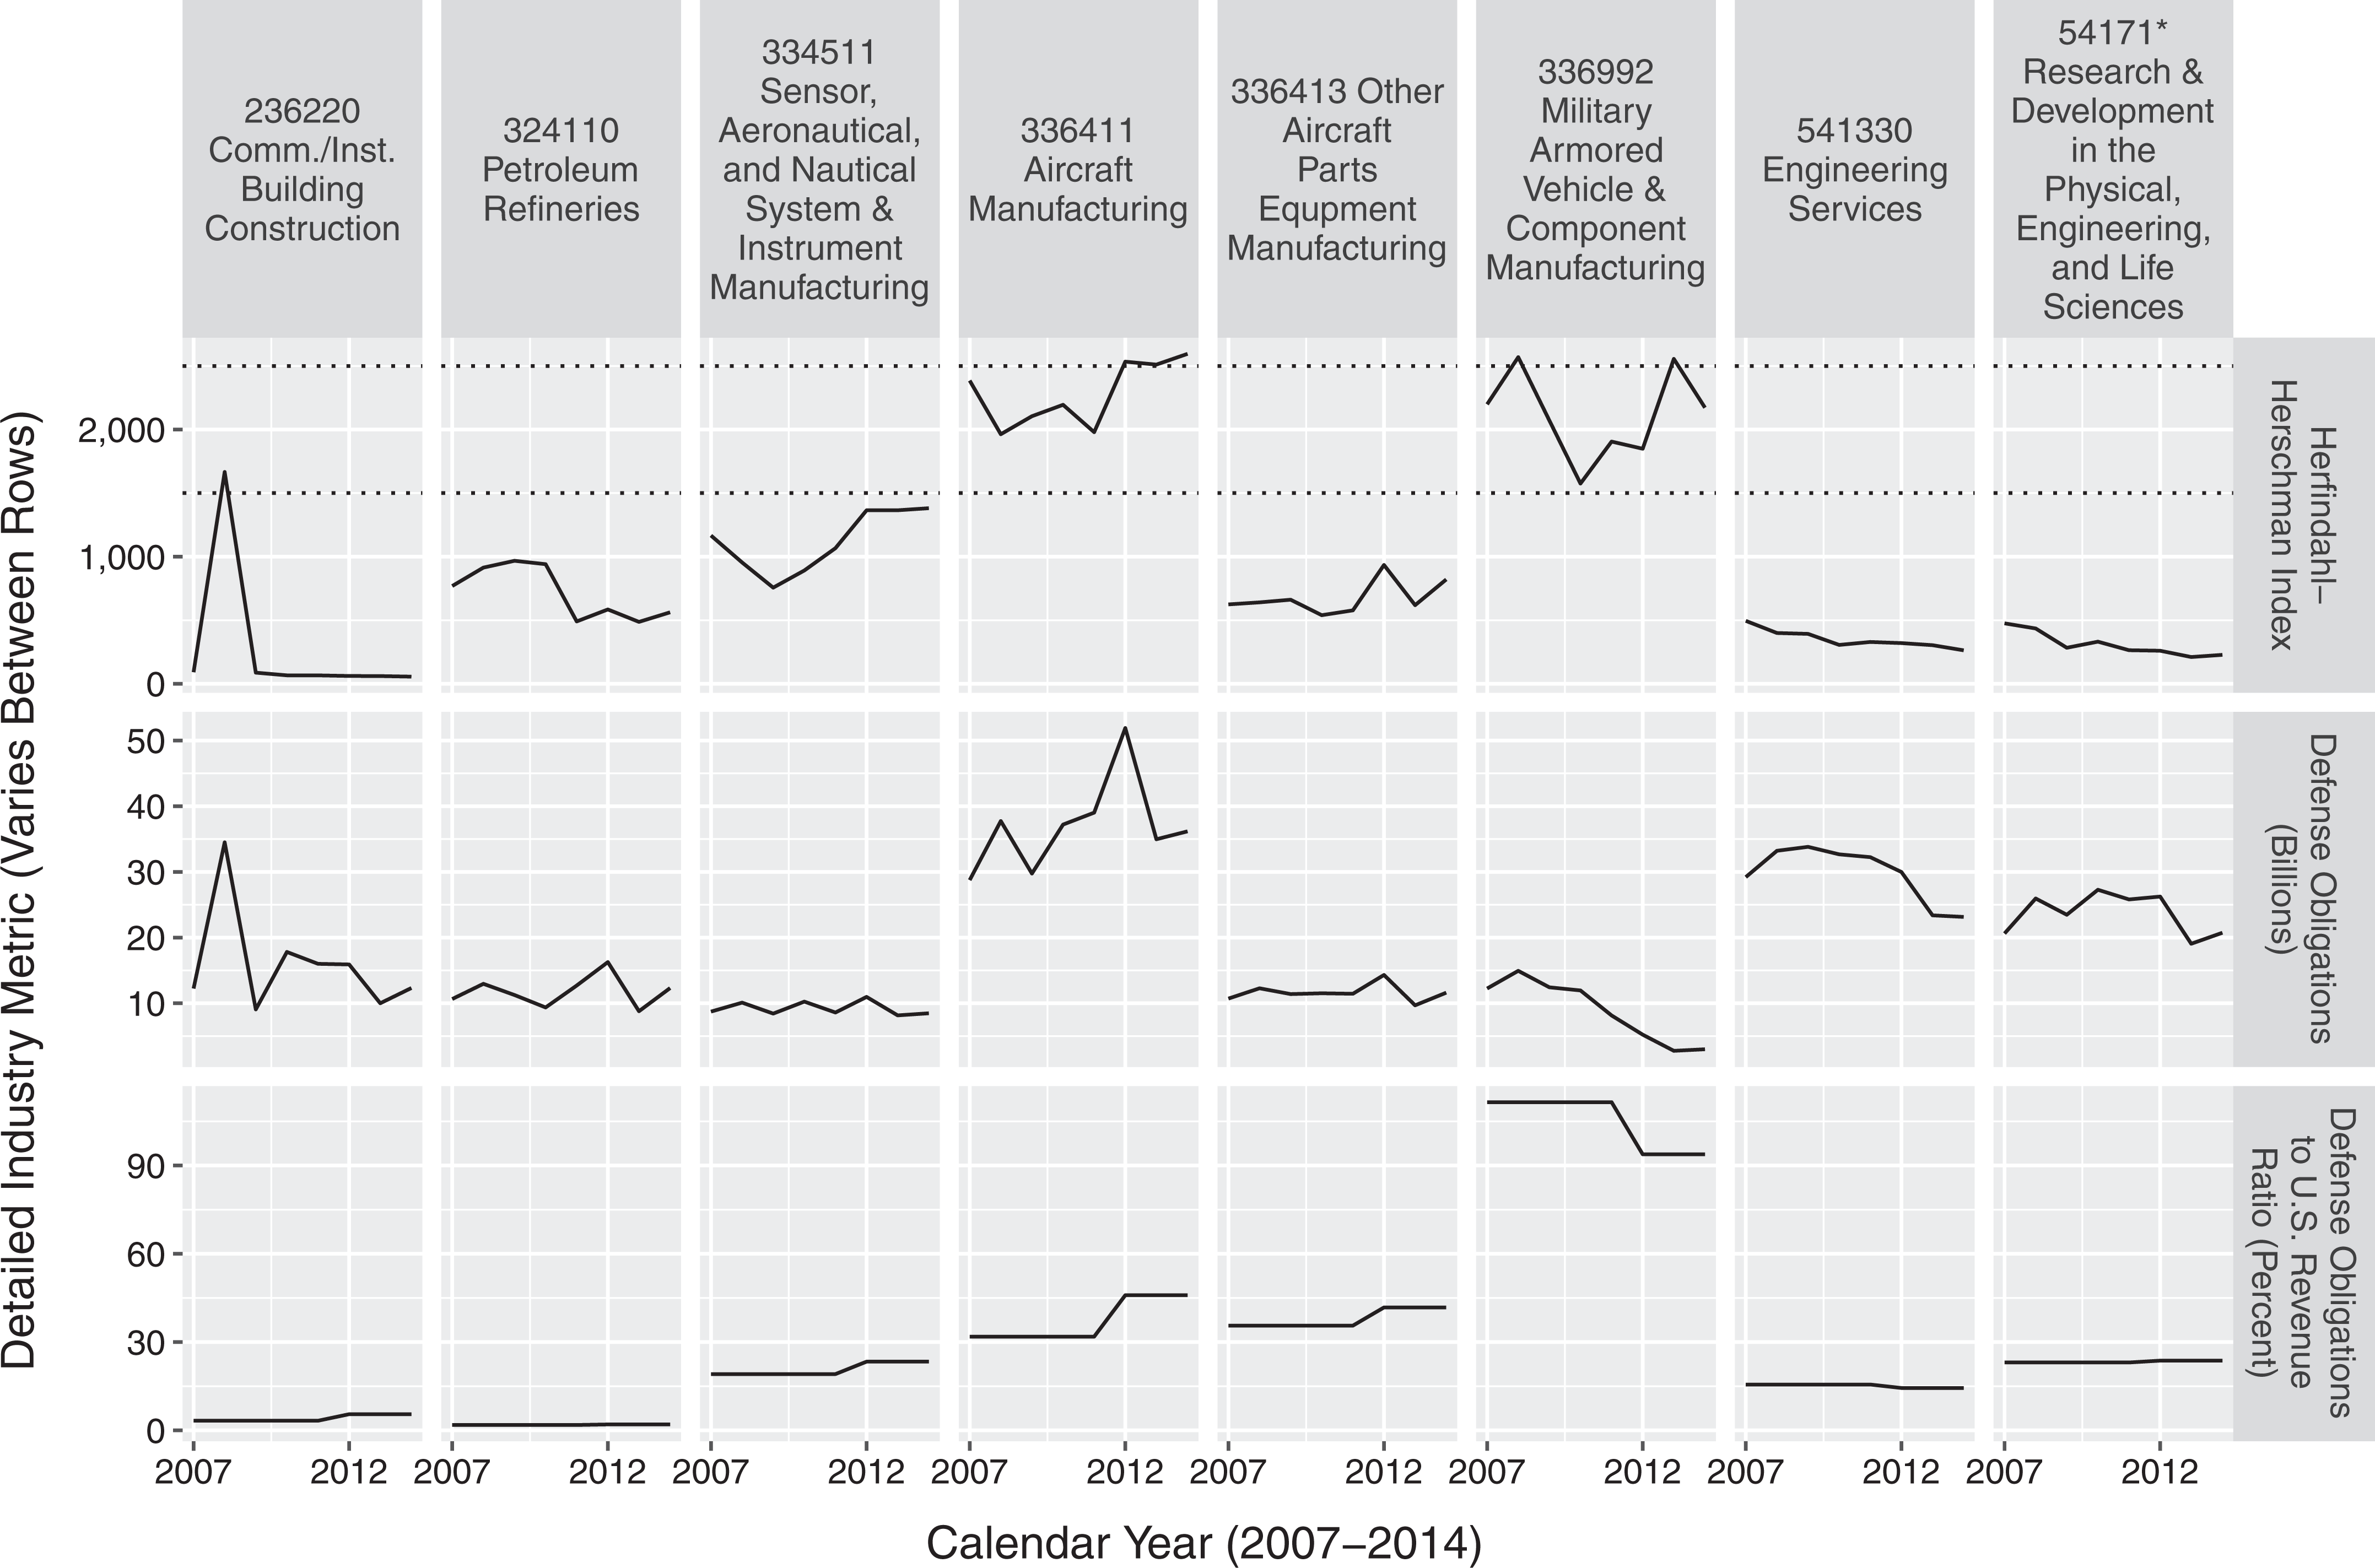
Concentration in selected defense-detailed industry categories.
These figures display three different defense industry metrics across the same range of calendar years for eight selected subsector and detailed industry categories. The topmost row displays the HHI for each industry. As described above, there are indications in the form of dotted lines for different thresholds of consolidation—values above 1500 generally indicate moderate consolidation, while those above 2500 indicate high consolidation. The second row is dedicated to the size of defense obligations (in USD) for each industry—in short, the number of dollars contracted out to each industry in the given year. The bottommost row evaluates the ratio of defense obligations to overall revenue for each NAICS sector. Because the revenue for each sector is available only in the US Economic Census, taken every 5 years, the only visible changes occur between 2011 and 2012 (the year the census was conducted). The volatility in the charts has multiple explanations, the spike in construction (subsector 236 and 236220) is due to a single multibillion dollar payment at the end of one fiscal year, rescinded in the next; for subsectors 424 and 561, a decline in defense obligations in the sector changed the shape of the market; for detailed industries 33641 and 336992 procurement of MDAPs, such as the Joint Strike Fighter and Mine-Resistant Ambush Protected vehicles respectively, have sufficient volume to shape the detailed industry with their rise and fall.
Both measures are separately logged and rescaled. Table 3 shows the descriptive statistics for these variables
Subsector and detailed industry HHI.
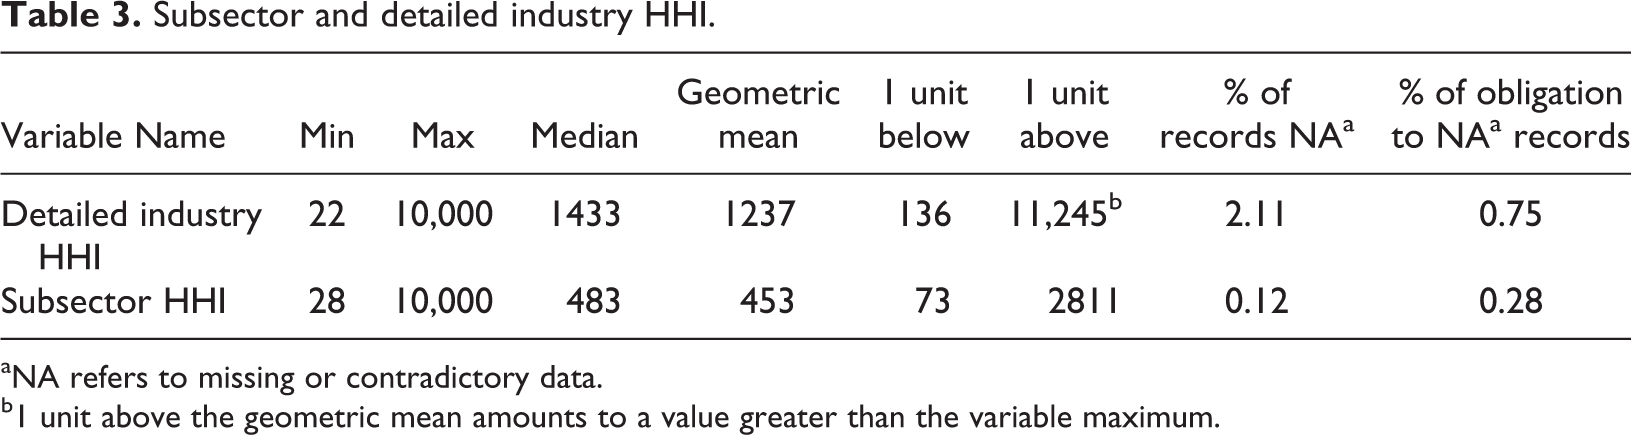
aNA refers to missing or contradictory data.
b1 unit above the geometric mean amounts to a value greater than the variable maximum.
The NA in the “% of records NA” column is in reference to the percent of records that the authors could not categorize. These instances usually come from changing NAICS classifications that take place between economic censuses, which make some codes that are used in one year impossible to locate in the next. The “% of Obligation to NA records” column refers to the percentage of government obligations that go to these unavailable records.
Empirical approach
For analysis purposes, the authors created six models evaluating all combinations of the direct and mediating variables (competition and concentration, respectively) with the three contract outcome variables (terminations, ceiling breaches occurrence, and ceiling breach size), and another three models combining the direct and mediating variables for each outcome variable. Maximum likelihood logit analysis was used to analyze both termination and ceiling breaches. Logit is suited to dependent variables which can be true or false, 1 or 0, but not values outside of that range. This approach does not allow for evaluation of the size of a ceiling breach or variations of partial or complete terminations. However, given the rarity of both, the study team chose to focus primarily on when these events occur and not differences between cases. In a follow-up analysis, ordinary least squares regression was used to model ceiling breach size for the ceiling breach size model, on a sample of all contracts in the datasets that experienced ceiling breaches. Because of this separation, the models in this paper only address the likelihood of ceiling breaches, or the size of breaches in cases where they occur. 7
For each of these models, varying intercept multilevel modeling techniques were employed to capture the differences in expected outcomes between industrial sectors as categorized by NAICS codes and contracting office. The authors employed a mix of modeling techniques recommended by Gelman and Hill (2007) 8 and Sommet and Morselli (2017). Each contract is assigned to the detailed industry NAICS sector based on the NAICS code and contracting office that received the most overall obligations over the contract’s lifespan. This multilevel approach results in four groupings, listed in Table 4. Statistics analysis employed R 3.6.3 (R Core Team, 2018), the lme4 (Bates, Maechler, Bolker, et al, 2015) and the arm (Gelman and Su, 2018) packages. Graphics were primarily prepared with the ggplot2 (Wickham, 2016) and texreg (Leifeld, 2013) packages. 9
Level 2 and level 3 variables included in the model.
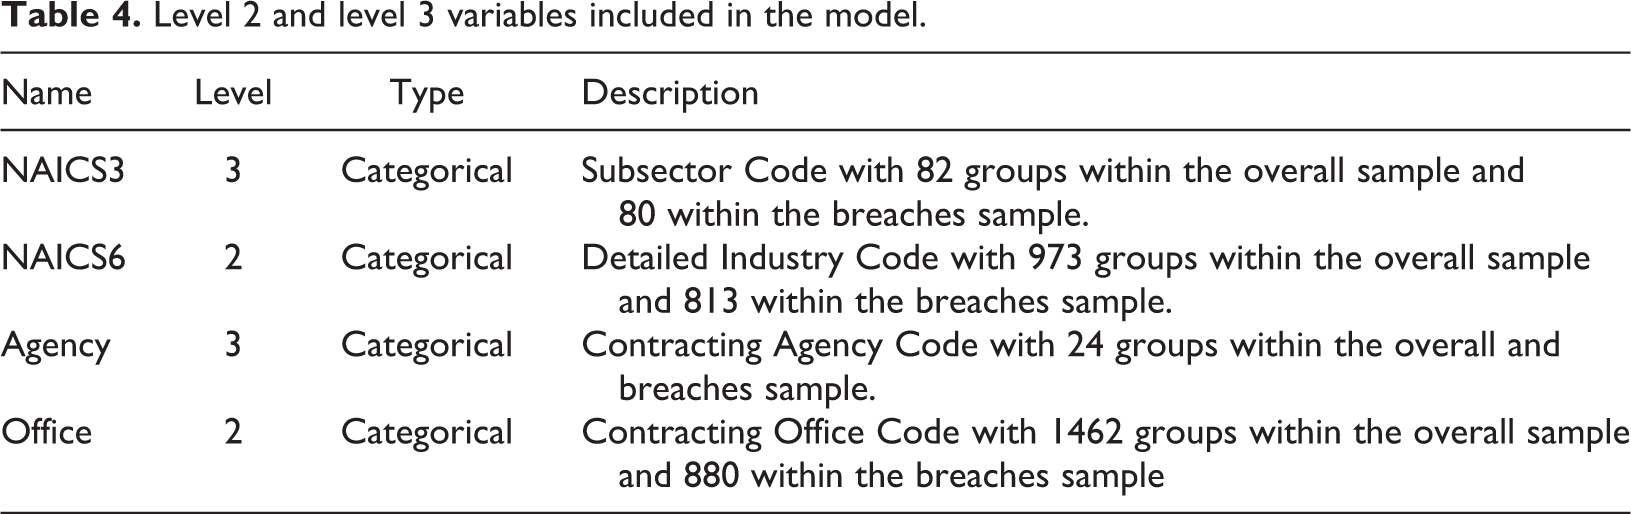
The more traditional level 1 inputs, in addition to the study variables discussed in the Study independent variables section, included two varieties of inputs as controls.
Subsector-level and detailed industry variables: both levels included the ratio of total defense obligations to US-wide revenues. In addition, the defense obligations and the average US salary for each detailed industry are added to the model. Defense obligations captures the total defense contracting market size for a given detailed industry, which is especially relevant for sectors—for example various categories of health care, where the civilian market may be notably larger but the defense market is still large enough to benefit from scale economies. The average US salary is intended to be a rough proxy of the complexity of a given detailed industry (with higher salaries tending to go to more complex, higher knowledge-content work and production).
Contract-level variables: Scope as measured by initial contract ceiling and duration. Vehicle, which has a baseline of definitive contracts and purchase orders, but also includes four types of indefinite delivery vehicles: Single-Award IDCs (S-IDC); Multi-award IDCs (M-IDCs); Federal Supply Schedule or Government-Wide Acquisition Contract (FSS-GWAC); and Blank Purchase Agreement or Basic Ordering Agreement (BPA-BOA). Pricing, which uses firm-fixed price as a baseline with five alternatives handled by dummy variables: incentive fee contracts (whether fixed price or cost-based); combination; combination or other contracts which include multiple types, time and materials, labor hours, or fixed price: level of effort (T&M/LH/FP: LoE); other fixed price (other FP) including all types of fixed price not covered by earlier categories; and other cost-based (other CB) covering all types of cost-based contracts not covered by earlier categories. Whether a contract began as an UCA. Whether any portion of a contract was performed internationally.
Results
Ceiling breaches’ correlation with industrial concentration and competition
Table 5 shows the models for the likelihood of ceiling breaches, first using industrial concentration and competition as separate inputs and then including them both in the same model. This approach was chosen to test hypothesis 2, because if competition was primarily a channel for industrial concentration, then we would expect the coefficients for the study variables to change markedly based on the inclusion of the other. This proved not to be the case, for both the likelihood and size of breach models, the magnitude of the concentration variable was not reduced, or otherwise notably influenced, by the inclusion of competition. So the results for both likelihood and size will focus on the respective model that include both variables. The second model, shown in Table 6, estimates the size of ceiling breach, is contingent on a ceiling breach occurring and is discussed for those contractions contracts where a breach occurred.
Logit models of ceiling breach likelihood.
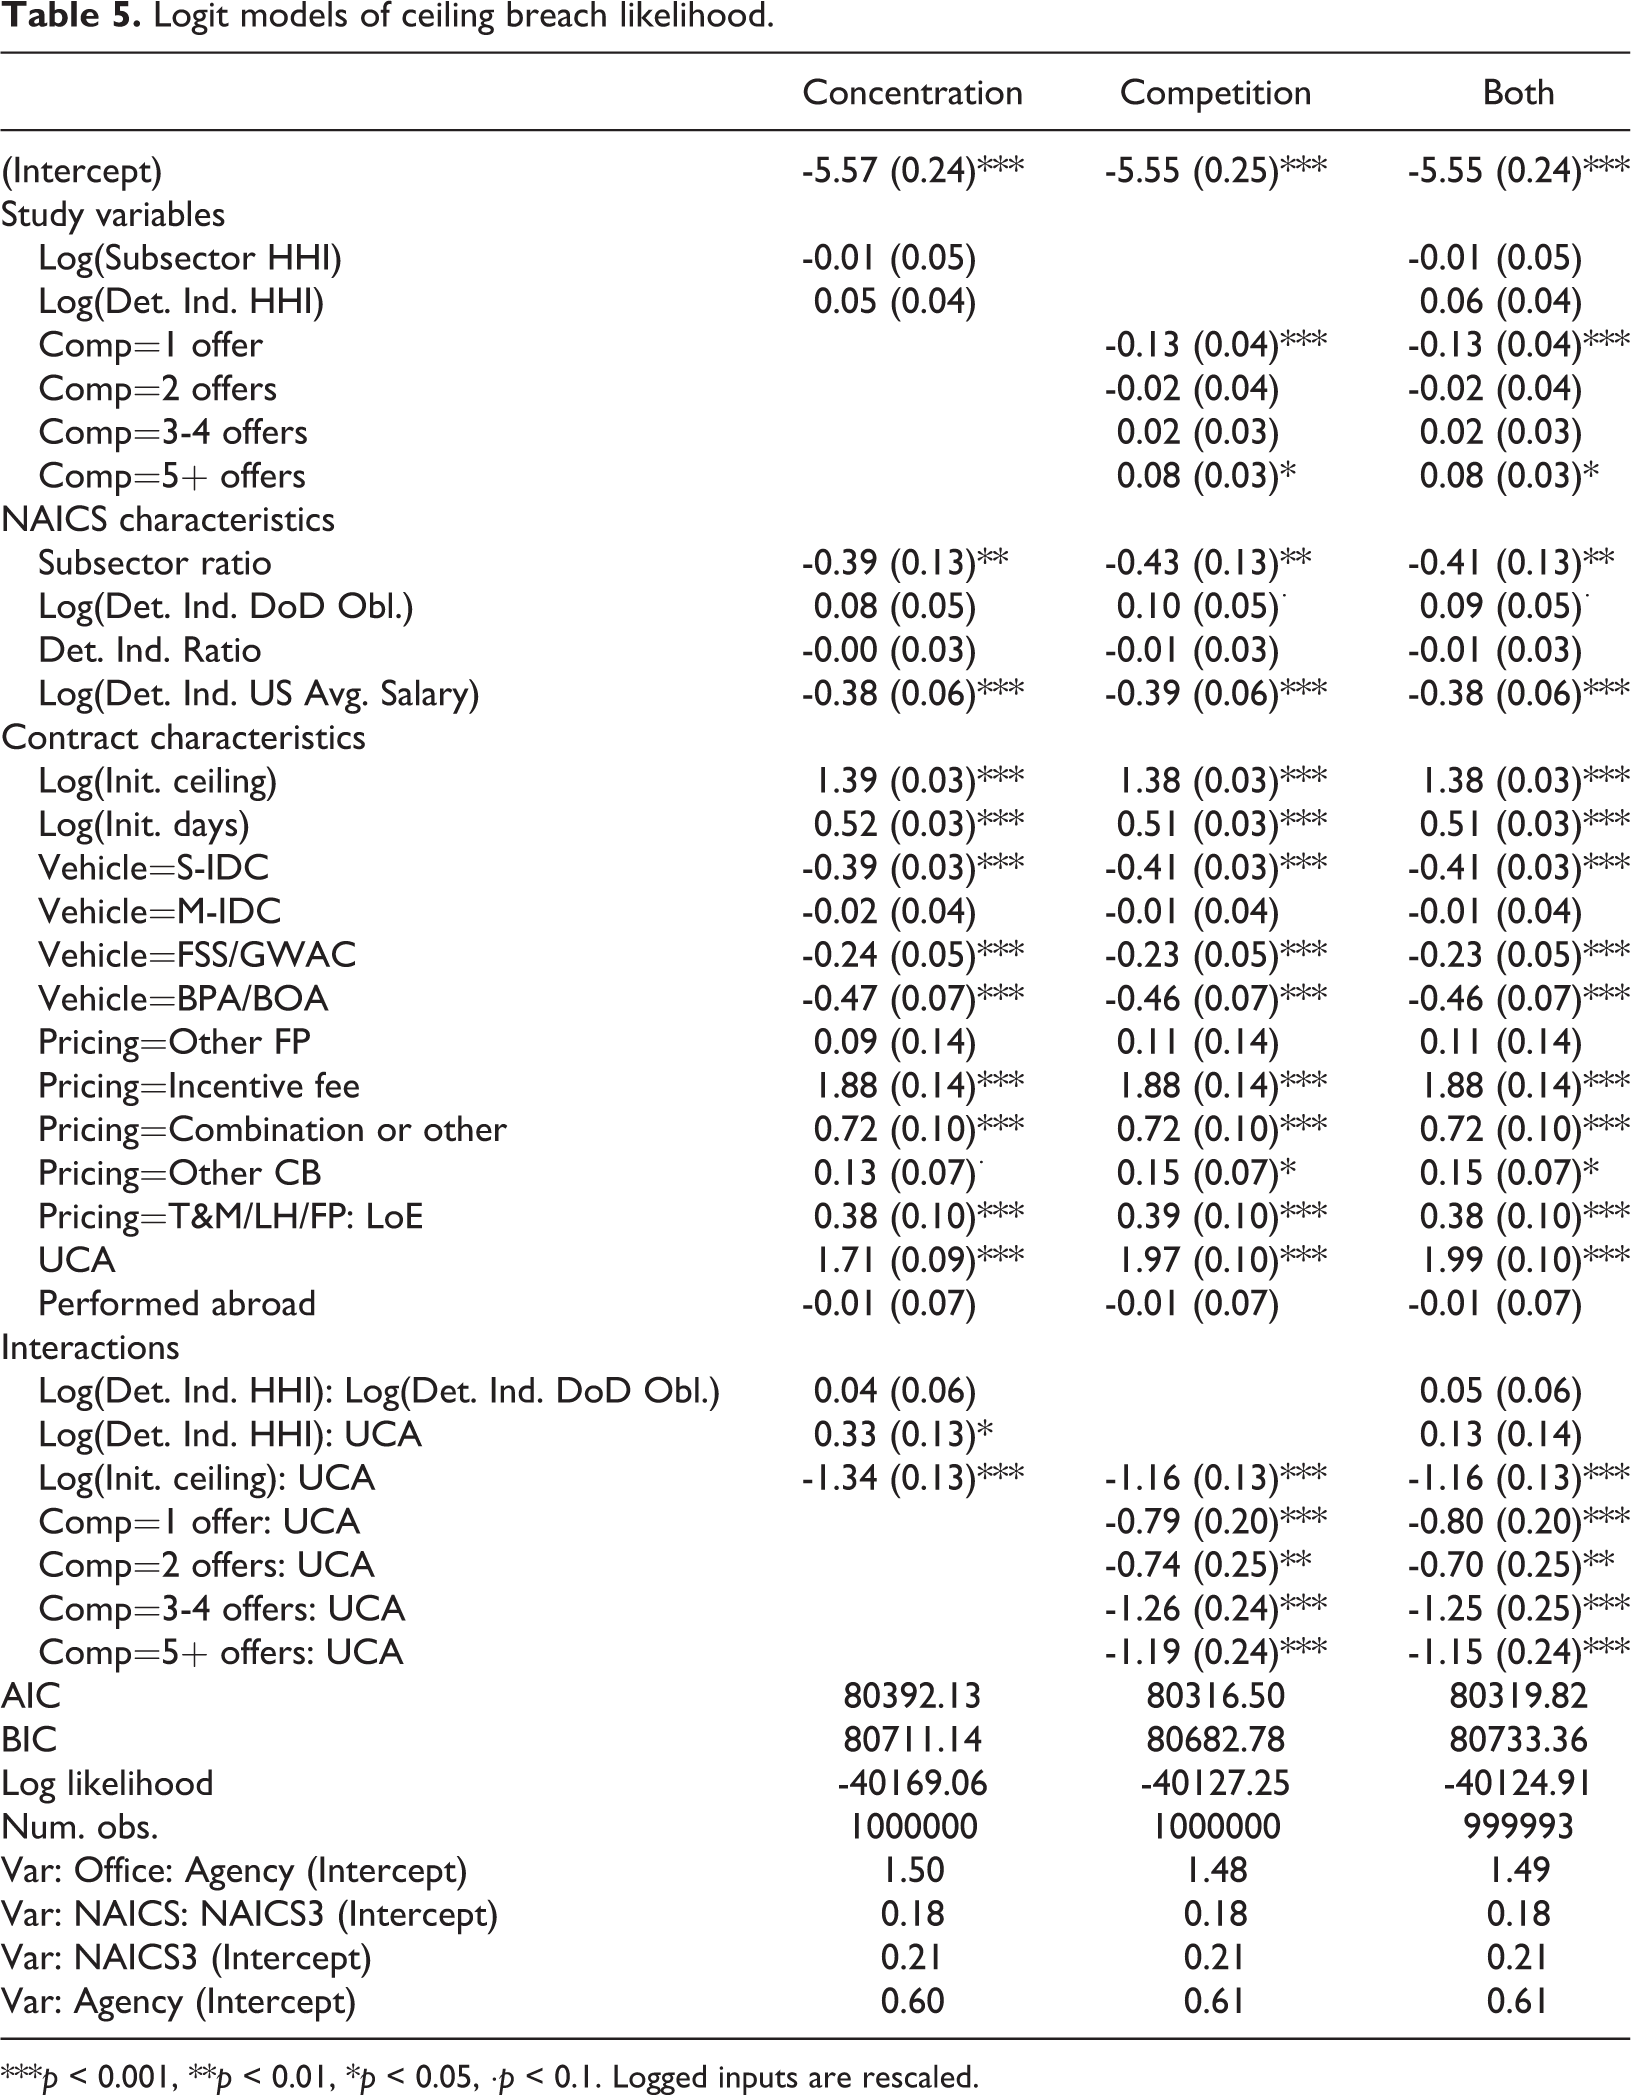
***p < 0.001, **p < 0.01, *p < 0.05, ·p < 0.1. Logged inputs are rescaled.
Regression models of ceiling breach size given breach occurrence.
***p < 0.001, **p < 0.01, *p < 0.05, ·p < 0.1. Logged inputs are rescaled.
The likelihood models show no significant relationship between concentration and ceiling breaches, at either the subsector or detailed industry level. The results for competition are significant but are also contradictory. Competition with 1 offer correlates with a lower risk of ceiling breach and is significant at the 0.1 percent level. In the opposite direction, competition with 5 or more offers correlates with a higher risk of ceiling breach, though this finding is only significant at the 5 percent level. While interpreting the sign of the relationship is straightforward, interpreting the coefficient requires an additional step because analysis of ceiling breach and terminations relied logit models (given they are both binary outcomes). To meaningfully interpret the results, it is necessary to transform them with an inverse logit function to provide an odds ratio. These results for the model examining both concentration and competition can be seen in Table 7 below. In this case, as in all subsequent ones, the correlations described assume that all else is held equal.
Ceiling breach odds ratios.
***p < 0.001, **p < 0.01, *p < 0.05, ·p < 0.1
In interpreting these ratios, a value of 1 would mean no relationship between the variable and ceiling breaches. The value of 0.88 for Comp=1 Offer indicates that a contract competed with one offer would be associated with a 12 percent reduction in ceiling breaches versus one that was not competed. The value of 1.09 for Comp=5+ Offers would estimate a 9 percent increase in the prevalence of ceiling breaches compared to an uncompleted contract. The “Lower Bound” and “Upper Bound” give the 95 percent confidence interval for the odds ratio. If this interval does not overlap with the 1, then the odds ratio is significant at the 95 percent level. One interaction in the model is also worth noting, namely competed UCAs are correlated with dramatical lower risks of ceiling breaches (significant at the 1 percent level for competition with 2 offers and at the 0.1 percent level for the other levels of competition).
The contract size model relies on ordinary least squares regression and thus can be more directly interpreted and if significant for all of the study variables, sometimes in opposite directions as the likelihood model. The model estimates that a change of one unit in the rescaled Subsector consolidation measure is associated with a six percent larger breaches (significant at the 5 percent level), though detailed industry consolidation is not a significant estimator. Strikingly, while competition estimates a greater likelihood of ceiling breaches, all four competition variables estimate a smaller ceiling breaches with one offer, two offers, 3-4 offers, and 5+ offers estimating size reductions of 8, 9, 21, and 13 percent respectively (all significant at the 0.1 percent level). The interaction with UCA contracts is significant for contracts with 2 offers, though the direction is reversed from the likelihood contracts estimating a 55 percent increase in breach size, which is larger than the 21 percent reduction estimated by the base competition with two offers variable (significant at the 0.1 level).
Termination’s correlation with industrial concentration and competition
As with ceiling breaches, the three models (just concentration, just competition, and both) have roughly similar coefficients and the authors focused on the model incorporating both study variables. As shown in Table 8, a greater subsector HHI is associated with an increased risk of termination (odds ratio 1.27), a correlation that is significant at the 0.1 percent level. The coefficient for Det. Ind. HHI, is negative but not significant.
Terminations odds ratio.
***p < 0.001, **p < 0.01, *p < 0.05, ·p < 0.1.
For exploratory purposes, the models also include interactions intended to examine whether the influence of key study variables is contingent upon other industry- or contract-level variables. Turning to interactions, as shown in Table 9, the subsector HHI’s estimation of increased risk of termination is further increased when the Subsector Ratio is high, a relationship that is significant at the 0.1 percent level. This is to say in those subsectors where the DoD obligations account for a substantial portion of total US revenues. Also of note, the results show that for detailed industries, concentration and the total defense obligations in that detailed industry correlate to a greater risk of termination when interacting. However, this result was only significant at the 10 percent level, below the threshold used in this paper.
Logit model results for partial or complete terminations.
***p < 0.001, **p < 0.01, *p < 0.05, ·p < 0.1. Logged inputs are rescaled.
No matter the number of offers, competitive procedures estimated a higher risk of termination. This relationship was significant at the 0.1 percent level for competition with two or more offers. Moreover, those categories with more offers had a greater risk, escalating from competition with a single offer (1.07 odds ratio and only significant at the 90 percent level), to competition with two offers (1.28 odds ratio, significant at the 0.1 percent level), to competition with 3–4 offers (1.48 odds ratio, significant at the 0.1 percent level), to the peak at more than doubling for competition with five or more offers (2.08 odds ratio, significant at the 0.1 percent level).
Discussion and conclusions
The multiple significant results support different portions of the past literature, particularly those aspects warning about the risks of industrial concentration and the complications of monopsony. Before discussing findings, it is worth elaborating on the limitations of the modeling effort. First, the currency variables are presented in nominal dollars due to the variable base years of contract ceiling estimates. This choice may introduce unintended temporal effects, particularly for US average wage data. Second, the authors considered a range of diagnostics to better understand the weaknesses of the models. 10
The authors plotted binned residuals for the logit models to examine the discrepancy between estimated values and actual outcome, which are displayed in the supplemental materials for the paper. This approach sorts all the data into bins based on the estimated likelihood of model’s dependent variable. Across multiple models, there tended to be a single bin where the average estimated risk of ceiling breach or termination was in the 10 to 25 percent range. In the final models, this bin also reliably has a large negative residual, which is to say that the estimated value does identify some of the highest risk contracts, yet still underestimates their risk. This suggests that there is some important input for differentiating between high risk contracts that this model is missing.
Industrial concentration
This paper found firm support for the first hypothesis for terminations but not for ceiling breaches:
The termination model, as shown in Table 9, found significant (at the 0.1 percent level) positive correlation between subsector HHI and the risk of terminations. This support was echoed in the ceiling breach size model, as shown in Table 6 (significant at the 5 percent level) but not in the ceiling breach likelihood model. While not casual models, these results are consistent with the idea that consolidation may be driven by market power or barriers to entry that undercut the performance delivered to the government, similar to conclusions drawn by Carleton and Perloff (2015) as well as Kovacic and Shapiro (2000). Specifically, consolidation may influence performance, which may lead to contractors taking a harder line in negotiations over troubled projects, which could result in larger ceiling breaches if accord is reached or termination if it is not. However, if this is the case, there are no significant signs of this phenomenon for the likelihood of ceiling breaches. Thus, it does not appear that greater contractor leverage directly leads to a failure to invest in risk mitigation, which would be expected to show negative results by both metrics. This suggests that these results cannot simply be attributed to the government being locked-in, as separately discussed by Brown et al. (2010, 2016), Kettl (1993), and Williamson (1996), as lock-in would make terminations harder but also would logically contribute to a greater likelihood of ceiling breaches, and not just a greater size, conditional on a breach occurring. Instead these results may suggest a more conflicted relationship between consolidation and cost overruns that echoes the disagreement in findings between Hensel’s (2010) and Hoff’s (2007) examinations of the cost implications of mergers and acquisition. As suggested by the literature on concentration that limits competition (in the vein of Carril and Duggan, 2020), as firms with more market power would be better able to include room for profits or unexpected costs in their prices. However, if this room for unexpected costs is used up, vendors in consolidated markets may have the market power to shift more of those costs to government customer resulting in larger breaches.
The interactions for terminations suggest that industrial concentration matters even more under certain circumstances. Namely, subsector industrial concentration appears to matter more when there is less of a commercial industry to fall back on, as measured by the ratio of defense obligations to US economy (odds ratio 1.79), a result that is significant at the 0.1 percent level. While detailed industry HHI did not correlate directly with changes in performance, detailed industries that are both consolidated and have substantial defense obligations are associated with a higher risk of terminations (odds ratio 1.13), but this relationship is only significant at the 10 percent level.
The detailed industry HHI variable was not significant in any of the models. To check the robustness of this result, the authors also experimented with a model that included only the detailed industry level and the coefficient for detailed industry in that test resembled the coefficient for the omitted subsector HHI variable. Nonetheless, the greater correlations for subsector HHI than detailed industry HHI suggests possible implications. While deep diving efforts, such as the sector-by-sector tier-by-tier review under the DoD’s Better Buying Power Initiative and the current Administration’s industrial base review, are important, the big picture also matters. The interactions in the model also suggest that the risk is concentrated in those subsectors that are more defense-centric as well as detailed industries with sizeable defense obligations regardless of the size of their commercial counterparts. For a sense of the variation between subsectors, refer back to Figure 2, which shows the eight subsectors with the most obligations over the study period, with the HHI as well as defense obligations and ratio of defense obligations to US revenue shown before logging. Subsector defense obligations are not included in the model, but still provides useful context.
Competition
The second has a stricter requirement of support, as in it indicates the direction of the relationship:
H2 was rejected. Across both measures of ceiling breaches and terminations, consolidation variables’ estimates of the dependent variable were not notably influenced by the inclusion of competition in the model. As a result, even if reductions in competition led to decreased performance, the competition variable does not appear to be mediating the consolidation variable. For both of the likelihood models, the results for competition also ran contrary to the expectation of this hypothesis. All categories of multi-offer competition are associated with a greater risk of terminations. Single-offer competition has the same sign, albeit with a smaller magnitude and at the 10 percent significance level. For ceiling breaches, H2’s premise that competition estimated better performance found mixed support. In the likelihood model, only competition with a single offer significant estimated fewer ceiling breaches and competition with 5+ offers estimated more breaches, albeit at a lower level of significance (0.1 percent versus 5 percent). In contrast in the ceiling breach size model, regardless of number of offers, competition estimated smaller ceiling breaches (significant at the 0.1 percent level). For both likelihood measures, those categories of competition with more offers, in ascending order, faced greater risk of negative outcomes (though in the case of ceiling breaches, not all are significant). However, for contract breach size, competition with 3—4 offers estimated the greatest reduction in breach size. Oddly, the interactions between competition and UCAs run contrary to most of these trends, estimating better performance for ceiling breach likelihood but worse performance for ceiling breach size for UCAs competed with 3–4 offers.
The mixed support for ceiling breaches is quite surprising, because single-offer competition is typically not considered to be effective competition. 11 One explanation might be that multi-offer competition may introduce mounting pressure for bids that will win the competition, even if they are not necessarily profitable for the vendor or may involve other risks. This could also explain why competition with 5+ offers had a significant positive correlation with ceiling breaches as a wide-open pool of competitors may raise the risk that at least one competitor will bid aggressively.
The bid-to-win phenomenon may also help explain the dramatic difference between termination rates for competition with two offers (significant at the 10 percent level) and with five or more (significant at the 0.1 percent level), which have odds ratios of 1.23 and 2.08 respectively. The steady increase in termination risk with higher number of offers also may suggest that outright unqualified bidders, who would need more than a change order to turn around their contract, may be more likely to win when there are many offers in play.
There are additional explanations that are less concerned with whether greater than two offers were received. One form of partial and complete termination, bid protests, is most relevant for competed contracts because they are launched by vendors whose offers were not accepted. Another explanation that may clarify why competition is associated across the board with a higher rate of terminations is that competition does presume that the government has another offer available. If they have no viable alternatives to turn to, the government may prefer means of sanction short of outright termination. This question may be better addressed by a research design that incorporates deobligations or other sanctions. 12
A flip side of this bid-to-win explanation is that the government may still be receiving an important benefit from competition, just not one captured in the output variables used. Namely, consistent with the literature on the price lowering potential of competition, if potential vendors bid more aggressively for multi-offer competition then competed contracts should generally be less expensive than their sole source alternatives. Both ceiling breaches and terminations remain quite rare in the total universe of DoD contracts. As a result, if competition results in aggressive bids and lower prices, the DoD may still come out ahead from an expected value perspective. The ceiling breach and termination rate may be higher but saving money on all contracts might be worth more than doubling a low baseline termination rate. This possibility is reinforced by the ceiling breach size findings that suggest, consistent with Williamson, that the threat of replacement with a competitor can be used to discipline vendors and moderate the size of breaches in those cases when one occurs. Likewise, the possibility of another vendor stepping in does mitigate the downside of non-mission critical terminations. However, this calculation will vary based on the risk tolerance of the contracting office and the need being met.
Directions for future research
Four avenues appear particularly promising for incremental new steps or for plucking related low hanging fruit. First, a next step to employ with this approach would be to use a two-step approach to predicting contract breach side. This will require additional modeling work but would allow for the calculation of an expected value of breach size that incorporates both likelihood and size when a breach occurs. Second, by narrowing the focus of a quantitative or case study analysis to those troubled or inherently high-risk contracts, future researchers could explore the casual mechanism suggested by this papers results. Namely, whether contractors in more consolidated markets behave differently once major change orders or the threat of termination is on the horizon but not yet realized. Third, incentive fee contracts were associated with more and larger ceiling breaches, which is contrary to past research (Kendall, 2014), but interactions with detailed industry average salary in the ceiling breach size reversed this relationship in higher salary detailed industries. This suggests that the benefits of incentive fee contracting may depend on the complexity of the service or item being acquired. Finally, the most direct way to build on this research would be to look closer at the mechanisms of competition, such as exclusion of sources or small businesses set asides and targets. Such research may help identify the mechanism or hidden variable accounting for the correlation of more offers with worse outcomes.
Supplemental material
2020-03-31_Supplementary_Materials - What does consolidation mean for performance? Concentration, competition, and defense contracting outcomes
2020-03-31_Supplementary_Materials for What does consolidation mean for performance? Concentration, competition, and defense contracting outcomes by Gregory Sanders and Zachary Huitink in Journal of Strategic Contracting and Negotiation
Footnotes
Acknowledgements
This paper is directly adapted from a larger final technical report sponsored by a grant awarded by the Naval Postgraduate School. The authors would like to thank editors Amanda Girth, Tyrone S. Pitsis, Mariela Campuzano, and two anonymous reviewers for constructive feedback, comments, and suggestions that significantly improved this manuscript; Nancy Moore for the presentation that initially inspired this idea; Lindsay Mahowald’s careful editorial review and thoughtful suggestions; and interns that contributed to the larger paper Xinyi Wang, Ravi Maddali, Zhian Wang, Sam Mooney, Nicholas Blanchette, Madeleine Gagne, and Schuyler Moore, and, finally, the original paper editor Jim McNeirney.
Disclaimer
The Center for Strategic and International Studies (CSIS) does not take specific policy positions; accordingly, all views expressed in this presentation should be understood to be solely those of the author(s).
Declaration of conflicting interests
The author(s) declared no potential conflicts of interest with respect to the research, authorship, and/or publication of this article.
Funding
The author(s) disclosed receipt of the following financial support for the research, authorship, and/or publication of this article: This material is based upon work supported by the Naval Postgraduate School Acquisition Research Program under Grant No. N00244-17-1-0014. The views expressed in written materials or publications, and/or made by speakers, moderators, and presenters, do not necessarily reflect the official policies of the Naval Postgraduate School nor does mention of trade names, commercial practices, or organizations imply endorsement by the U.S. Government. This article was primarily completed out of the authors’ own time, but also included analytical advances from subsequent Acquisition Research Program grants and time supported by the Center for Strategic and International Studies’ Defense-Industrial Initiative Group, including indirect support from corporate contributions.
Supplemental material
Supplemental material for this article is available online.
Notes
References
Supplementary Material
Please find the following supplemental material available below.
For Open Access articles published under a Creative Commons License, all supplemental material carries the same license as the article it is associated with.
For non-Open Access articles published, all supplemental material carries a non-exclusive license, and permission requests for re-use of supplemental material or any part of supplemental material shall be sent directly to the copyright owner as specified in the copyright notice associated with the article.