
Abstract
Background
Multiple sclerosis (MS) is an autoimmune condition characterized by inflammatory and neurodegenerative traits. Recently, DNA methylation has emerged as a promising field of investigation for elucidating dynamics characterizing MS development and progression.
Objectives
This study aimed to comprehensively investigate the role of epigenetics in MS by analyzing the methylation profiles from blood and brain tissues from public datasets.
Methods
Employing a meta-analytical framework for differential methylation analyses, the study extended beyond conventional analyses to explore additional dimensions of epigenetic regulation, including epigenetic drift, age acceleration, and rare epivariations.
Results
Results of the differential methylation analysis were in line with previously reported findings. No significant differences were observed in age acceleration or global epigenetic drift between MS cases and controls. However, upon closer analysis at the gene level, distinctive patterns of epigenetic drift emerged, particularly within genes implicated in neural biological functions.
Conclusions
These findings underscore the role of epigenetic modifications in shaping MS pathology. Furthermore, the study unveiled the exclusive presence of rare epivariations within the MS cases, some of which involved genes previously linked to MS or other autoimmune diseases. This highlights the potential significance of rare genetic aberrations in driving MS susceptibility and progression.
Introduction
Multiple sclerosis (MS) is a neurodegenerative autoimmune disease affecting the central nervous system (CNS) leading to neurodegeneration over time. 1 An interplay of genetic, immunologic, and environmental factors contributes to its onset. For this reason, it is defined as a complex trait disease. Genetic models have been proposed to study its familial susceptibility for levels of proteins 2 and several bioinformatic strategies have been applied to unravel the complexity behind plausible molecular factors and RNAs involved in its progression.3,4 To go further, in recent years, epigenetics has emerged as a promising field to be combined for clinical research. 5 Through methylation profiles, gene expression may be regulated, providing evidence of molecular links between genetic variation and MS.6,7 Although less is known about epigenetic factors causing neurodegeneration, extensive studies on epigenetic mechanisms regulating axonal loss, apoptosis, and mitochondrial dysfunction highlight the significance of DNA methylation in MS.8,9 In recent literature, the attention has turned mainly to blood 10 and brain cells methylomes11–14 to capture the plausible description concerning nervous and immune systems. Findings often encountered challenges due to underpowered studies, especially in brain-related research, which led to limitations in drawing definitive conclusions. This study prioritized identifying episignatures, overlooking aspects such as epigenetic age, drift, and rare epigenetic variations, also named epivariations. They aimed to consolidate previous findings through a meta-analysis. Notably, epigenetic drift and rare epivariations, which involve abnormal DNA methylation linked to genome dysfunction, are implicated in neurodegenerative diseases such as amyotrophic lateral sclerosis (ALS), Parkinson's, and Alzheimer's.15–17 This highlights a gap in understanding the biological impact of epigenetic factors in MS pathogenesis and progression. Epigenetic drift, involving gradual changes in the epigenome, includes stochastic epigenetic mutations (SEMs) arising from random errors during cell division and environmental influences. 15 Epivariations are regions with abnormal methylation patterns, resulting from primary epigenetic modulation due to random errors in epigenome maintenance and genetic alterations such as copy number variants (CNVs), CGG repeats, and SNVs.15–17 Understanding these origins is crucial for elucidating the molecular mechanisms underlying epigenetic changes.
Materials and methods
Selection of MS datasets
To accomplish the meta-analyses, a search was conducted in the Gene Expression Omnibus (GEO) data repository (up to September 2023). The GEO Database 18 was filtered to identify datasets from BeadChips microarray experiments related to MS, using the following criteria: (1) public datasets, (2) MS, (3) case–control studies, and (4) datasets from different array platforms such as HumanMethylation27, Illumina HumanMethylation450, or Infinium MethylationEPIC, specifically conducted in whole blood and in the brain tissues. The procedure of exclusion/inclusion criteria is described in SM1. Eventually, epigenetic differences were investigated by combining results from six public datasets. Table 1 represents the information on the included dataset. The analysis was performed on a total of 182 MS cases and 171 controls in blood samples and on a total of 40 MS cases and 45 controls in brain samples.
Reporting the features of the included dataset.

In the table are reported: the name of the study reference (GSE code), the number of cases and controls that were included per each study; the array type in the methylation experiment; and the sampled tissue with respective sampled methylomes/subgroups of cells is reported. Moreover, there is the eventual issue per each study or the description of the methodology we adopted (NR means that no issue was reported and data from all individuals was downloaded and processed), the total number of downloaded and processed files and the link of the publication.
Data preprocessing, quality control for methylation analysis
The analysis was integrated in R Studio (URL: https://www.R-project.org/). Firstly, the Champ package was used to import and filter the data. Each dataset was analyzed separately, employing the same procedures. Following the data import, each study underwent multistep quality control (QC) and normalization procedures. These steps aimed to pinpoint and rectify low-quality data, while also tackling batch effects caused by nonbiological factors, representing systematic technical errors’ sources. 19
First, QC of the array signals was conducted at both sample and site levels. Probes were removed when they did not contain CpGs’ sites, when bead count was <3 in at least 5% of samples, when they contained SNPs probes and multiple location. 19 Moreover, probes were excluded when they belong to X and Y chromosomes and when they report a p-value > 0.01 for the background. In the exploratory analysis, an unsupervised technique was employed to address potential batch effects, taking into account each sample's Illumina Sentrix ID and its position during the array experiment. For this purpose, single value decomposition 20 was used, applying the prcomp function.
Differential analyses of methylated probes and meta-analyses
For each study, the differential methylation analysis was conducted using the limma package, employing gene-specific logistic models on DNA methylation data. 21 Based on its proficiency in handling complex experimental designs and limited sample sizes, this approach facilitated the exploration of methylation discrepancies among cases and controls. Additionally, within each study, potential confounders (i.e., proportion of immune cell types, sex, and age) were taken into account during the analysis of differential methylation. Proportions of CD8 T cells, CD4 T cells, NK cells, B cells, monocytes, and granulocytes were estimated using the EpiDISH R package. 22 For blood tissue, we estimated the cellular components (CCs), with robust partial correlation using centDHSbloodDMC.m as reference matrix. To address collinearity and refine the analysis with a reduced set of variables, principal component analysis was employed to synthesize these potential confounders. PCs explaining 80% of the overall variability were chosen as covariates. Meta-analyses were conducted separately for whole blood and brain tissues by utilizing the METAL tool to combine multiple studies. 23 Eventually, METAL was used to estimate heterogeneity for each CpG site through Cochran's Q test.
Stochastic epigenetic mutations analysis and epigenetic drift
In each study, the epigenetic drift was assessed through the identification of stochastic epigenetic mutations (SEMs), which are defined as rare, stochastic, and inconsistent DNA methylation changes. SEMs are random, scattered variations in DNA methylation levels throughout the genome that occur independently among different individuals. These variations are not uniformly shared across a population but instead, they manifest as extreme outliers in methylation psteerns. Stochastic epigenetic mutations are identified by detecting these outliers which significantly deviate from the expected range given by three times the interquartile range, given by the formula:
Once assessed SEMs, the epigenetic drift was described per each subject, via generating epimutation load (EML) scores. These scores aimed to measure the overall burden of SEM's counts across the entire genome (Global-EML) and at gene level (Gene-EML). To investigate the relationship between Global-EML and MS, we employed a logistic regression model considering the same set of covariates utilized in the EWAS step. Global-EML was log-transformed and compared between cases and controls. The method described by Gentilini et al. 24 for Global-EML analysis was adopted.
To enhance result reliability, a meta-analytical method was applied to investigate epigenetic drift. This involved employing a mixed-effects model, which accounted for discrepancies across studies. This approach aimed to combine findings from multiple studies, increasing statistical power and yielding a more consistent estimation of the role of epigenetic drift in MS. This analytical process was carried out using the metafor package supported by R. Alongside pooled estimates, metafor computed heterogeneity statistics such as the Q-statistic and the I2 statistic. 25 Ultimately, the outcomes were visually presented using a forest plot created with the Forest function. For examining associations between MS and Gene-EML (i.e., Gene-specific epigenetic drift scores), we adopted the sequence kernel association test SKAT. Stochastic epigenetic mutations calls at each methylation probe were treated as variants of interest, following the approach outlined by Chen et al. 16 The RVTESTS tool, initially designed for mapping a contiguous set of rare variants to a specific trait, was extended to accommodate other measures like CNVs, methylation counts. This extension operated under the assumption that a cluster of variations in adjacent sites could be relevant to the trait. By considering the joint effect of multiple rare epigenetic variants, SKAT enhanced the statistical power to identify associations with the burden of SEMs. The analyses were conducted both in whole blood and brain tissue, and the results obtained from each study, depending on the tissue, were eventually aggregated using Fisher's method. 18 Results of EML are reported in terms of odds ratio (OR) and confidence interval (95% CI), with the null assumption that the presence of outliers in methylation level does not increase the risk of MS.
Epivariation analysis
To detect epivariations, we adopted the established and validated approach previously described by Gentilini et al. 26 For each subject, a test for overrepresentation of epimutated probes was conducted using a sliding window approach. This method assessed the accumulation of epimutations with the hypergeometric cumulative function. Each epivariation emerged as a p-value associated with the sliding window, indicating the probability of enrichment for epimutations within the annotated genomic region. After identifying rare epivariations, we employed a heuristic approach to pinpoint those relevant to MS. Specific regions with significant enrichment in SEMs, known as epivariations, were identified for each subject, aggregating the genes uniquely altered with epivariations in MS and absent in controls in whole blood and brain. Eventually, we referenced a list of rare epivariations described by Garg et al. 25 in a large study involving 23,116 individuals from the general population. This allowed us to concentrate on rare epivariations found in at least three MS cases, arbitrary threshold, and absent in a large control cohort, suggesting these regions might be novel epigenetic markers for MS.
Overrepresentation and prioritization analyses
The Over-Representation Analysis (ORA) used the WEB-based GEne SeT AnaLysis Toolkit WebGestalt 27 to determine if gene sets linked to specific Biological Process (BP), CC, Molecular Function (MF), and Kyoto Encyclopedia of Genes and Genomes (KEGG) pathways were overrepresented and enriched in a given gene list compared to chance. Additionally, a phenotype enrichment strategy analyzed genes involved in epivariations, focusing on those relevant to MS. Genes and intergenic regions with epivariations, absent in the control population, 25 were described. The list was further filtered to include only regions with epivariations in more than three cases across studies.
Age acceleration
Epigenetic aging was assessed using the GrimAge clock, which calculates age acceleration by integrating DNA methylation-based surrogates for various plasma proteins and self-reported smoking history. These measures were derived from DNA methylation data using the dnaMethyAge R package 28 with the PCGrimage clock. 29 To examine the association between the GrimAge clock and MS, a general linear model was employed under the null hypothesis of no effect of MS on the mean difference between epigenetic age and chronological age, adjusting for potential confounders such as sex and the principal components of CCs. For more robust results, a meta-analytic approach was applied across the two tissue types.
Epigenetic aging was assessed using the GrimAge clock, which calculates age acceleration. GrimAge is a composite epigenetic clock that integrates DNA methylation-based surrogates for various plasma proteins and self-reported smoking history. These measures were derived from DNA methylation data using the dnaMethyAge R package 28 with PCGrimage clock. 29 To examine the association between the GrimAge clock and MS, we employed a general linear model, under the null hypothesis of no effect of MS on the mean difference between epigenetic age and chronological age, adjusting
for potential confounders such as sex and the principal components of CCs. For more robust results, a meta-analytic approach was applied across the two tissue types.
Results
Differential methylation analyses and meta-analyses
Differential methylation analyses were conducted at probe level for both blood and brain tissues. The analyses were adjusted for potential confounding factors, as detailed in the method section. No signal retained the 5% FDR meta-analytical level significance after correction. A prioritization was performed with threshold for significance <10−5, focusing on findings that consistently showed the same direction of the effect, that is, up methylated or down methylated in all the studies for both tissues separately. The prioritization is shown in Table 2.
The probes found homogeneously differentially methylated between studies.

Reported probes passed the nominal threshold of 10−5 and showed consistency between studies (i.e., all up methylated “+++” or all down methylated “—“), respectively, for blood tissue and brain tissue. The name of the probe is reported with respective direction, chromosome, BP, name of the gene involved, p-value before correction (P.val) and p-value after FDR correction (P.val.fdr). No probes were still significant after FDR correction. Extensive table with precise genomic position is reported in Supplementary Material (SM1).
Notably, in the blood methylome, the HLA-DRB1 region exhibited distinct methylation profiles with both hypermethylation and hypomethylation. The up methylated cg17416722 (chr6:32554385) was the most robust at the meta-analytical level, close to the FDR threshold of 5%, reporting a FDR p-value = 0.07. While the cg09139047 (chr6:3255042) was found to be down methylated, already highlighted in.13,30 Similarly, genes such as DENND2B and COL20A1 showed hypomethylation, while the noncoding transcript region, LOC102723436, displayed hypermethylation. In the brain tissue, the goal was to identify a solid and consistent epigenetic marker by examining the methylation patterns across different brain regions, including white matter, astrocytes, and microglia, although these diverse brain areas are meta-analyzed together. Genes showing increased methylation levels in cases were NAV2, KCNQ4, KAZN, LIN03033, CADM1, KCNA2, CDH11, SGMS1, CKB, MCF2L, SREBF1, SSH1, VPS13D, and GLYATL2. In contrast, METTL21C displayed down methylation. Over-Representation Analysis showed a significant enrichment in pathways related to sphingolipid metabolism, arginine, and proline metabolism. Full results of meta-analyses annotated are shown in Supplementary Material (SM1_Blood, SM1_Brain). Furthermore, the results of the Cochrane's Q test for heterogeneity analysis are reported (Tables SM12) per each CpG.
Stochastic epigenetic mutation analyses and EML
Differences between cases and controls were investigated using two distinct metrics to evaluate the epigenetic drift: one examining the broader influence of epimutations, while the other focused on assessing drift at the gene level. Adjustment was done using the same set of covariates, as described for differential methylation analysis.
The meta-analyses did not report a significant increase/decrease of global epigenetic drift impacting on cases compared to controls: in blood the estimated OR = 0.77, 95% CI = [0.15–3.96]). The wide CI indicates a high level of uncertainty. In the brain tissue, results report OR = 0.75, 95% CI = [0.37–1.49]. The comprehensive forest plot of the Global-EML is shown in Figure 1. The plot reveals no heterogeneity in epimutation estimates for the brain (I² = 0%) and a corresponding null variance between studies (τ² = 0), indicating consistent EML estimates across the three studies. In contrast, blood samples exhibited substantial heterogeneity (I² = 88.7%), suggesting varying effects across studies, with a non-null variance between studies (τ² = 1.77). Differences in Gene-EML between cases and controls were investigated using a SKAT test and results obtained from different studies were combined by Fisher's method. Meta-analysis results from Gene-EML are shown in Supplementary Material (SM2_Blood, SM2_Brain).

Forest plot of epigenetic drift. The forest plot describes the effect size expressed as odds ratio (OR) and 95% confidence interval (CI) obtained from a multiple logistic regression model evaluating the effect of epigenetic drift on case–control status. The dashed vertical line represents an OR of 1 or no effect. Squares to the left of the line represent a decrease in OR while squares to the right of the line indicate an increase. Each square represents the mean effect size for that study and reflects the relative weighting of the study to the overall effect size estimate. In both tissues, the estimated effect of disease status on epigenetic drift seems to be heterogeneous and nonsignificant across studies.
Over-Representation Analysis was conducted to identify biological elements potentially affected by the observed epigenetic drift. GO terms with FDR < 0.05 in the brain highlighted the importance of neuro projection, neurons, and axons, along with synapse-related terms for CC. Conversely, in blood tissue, the most significant findings included terms associated with striated muscle cell differentiation, the glutamate receptor signaling pathway, forebrain development, muscle cell differentiation, and neuron differentiation for BP terms. For CC terms, the focus was on neuron projection, the somatodendritic compartment, neurons, dendritic components, and synapse parts. The detailed results are provided in tables within Supplementary Table (SM4–SM11), showing BP, CC, MF, and KEGG pathways, respectively, for brain and blood.
Age acceleration
Epigenetic age was assessed in all subjects whose chronological age was available. Age acceleration was calculated both for brain and blood samples. Estimates were combined through a meta-analysis shown by the forest plot in Figure 2. No difference in age acceleration was observed between MS cases and controls in blood [mean = 0.04, CI = (−0.59, 0.67)] and brain [mean = −0.69, CI = (−1.53, 0.16)]. Only GSE16648 reported a significant estimate of Grimage clock [mean = −0.91, CI = (−1.75, −0.08)].

Forest plot of age acceleration with Grimage clock. The forest plot of the effect size or standardized mean difference and 95% confidence interval (CI) of the effect of case–control status on age acceleration. The Grimage clock was used as an algorithm to provide a robust epigenetic predictor of mortality and aging-related health status. The dashed vertical line represents a mean difference of 0 or no effect. Squares to the left of the line represent a decrease in age acceleration differences, while squares to the right of the line indicate an increase. Each square represents the mean effect size for that study and reflects the relative weighting of the study to the overall effect size estimate. For whole blood, the effect of disease status seems to be null, while for the brain it seems to coherently positively increase on the Grimage clock across studies, although no significant estimate.
Epivariation
Specific regions with significant enrichment in SEMs, known as epivariations, were identified for each subject, aggregating the genes uniquely altered with epivariations in MS and absent in controls in whole blood and brain. Twenty-one epivariated genomic regions were found exclusively in MS cases and were never reported in the list of rare epivariations from Garg et al. 25 The list of epivariations is presented in Table 3, which includes their frequency in MS cases (Column 2) and their respective positions (Column 5). Columns 6 and 7 detail the average Delta Beta (aDB) value and the range for each epivariation. The Delta Beta represents the difference between the methylation values for epimutated probes in cases compared to the median value of the reference population, with positive values indicating hypermethylation and negative values indicating hypomethylation. Concentrating on rare epivariations found in at least three MS cases but absent controls and in the large control cohort, suggesting these regions might be interesting for further investigation for MS. Fourteen epivariated regions were found in whole blood, while no epivariation appeared in the brain in at least three MS cases. Among these, the only down methylated one (aDB = −0.27) was found in the intronic region of PRMD8, and this one was the largest epivariation (chr4:1108070–81111527). Other intronic epivariations were found in AGPAT1 (aDB = 0.10) and HOOK2 (aDB = 0.4), in this latest gene also extending in its exonic stretch (chr19:12876846–12877188). In intron regions were found epivariations in CENPF (aDB = 0.25), TRIM68 (aDB = 0.19); while CAB38; ITMC2 (aDB = 0.26) and RPP21; HLA-E (aDB = 0.08) were intergenic. Four upstream epivariations were found in; AGPAT1; RNF5 (aDB = 0.05), CREB3L3 (aDB = 0.23), ZNF563 (aDB = 0.11), and TRMT12 (aDB = 0.18). Eventually, noncoding exonic (nc-exonic) epivariations were found in DHRS4-AS1 (aDB = 0.23) and in LOC100133286 (aDB = 0.17) and the only coding exonic was TXNRD2 (aDB = 0.22).
The 21 epivariated genomic regions present in MS cases.
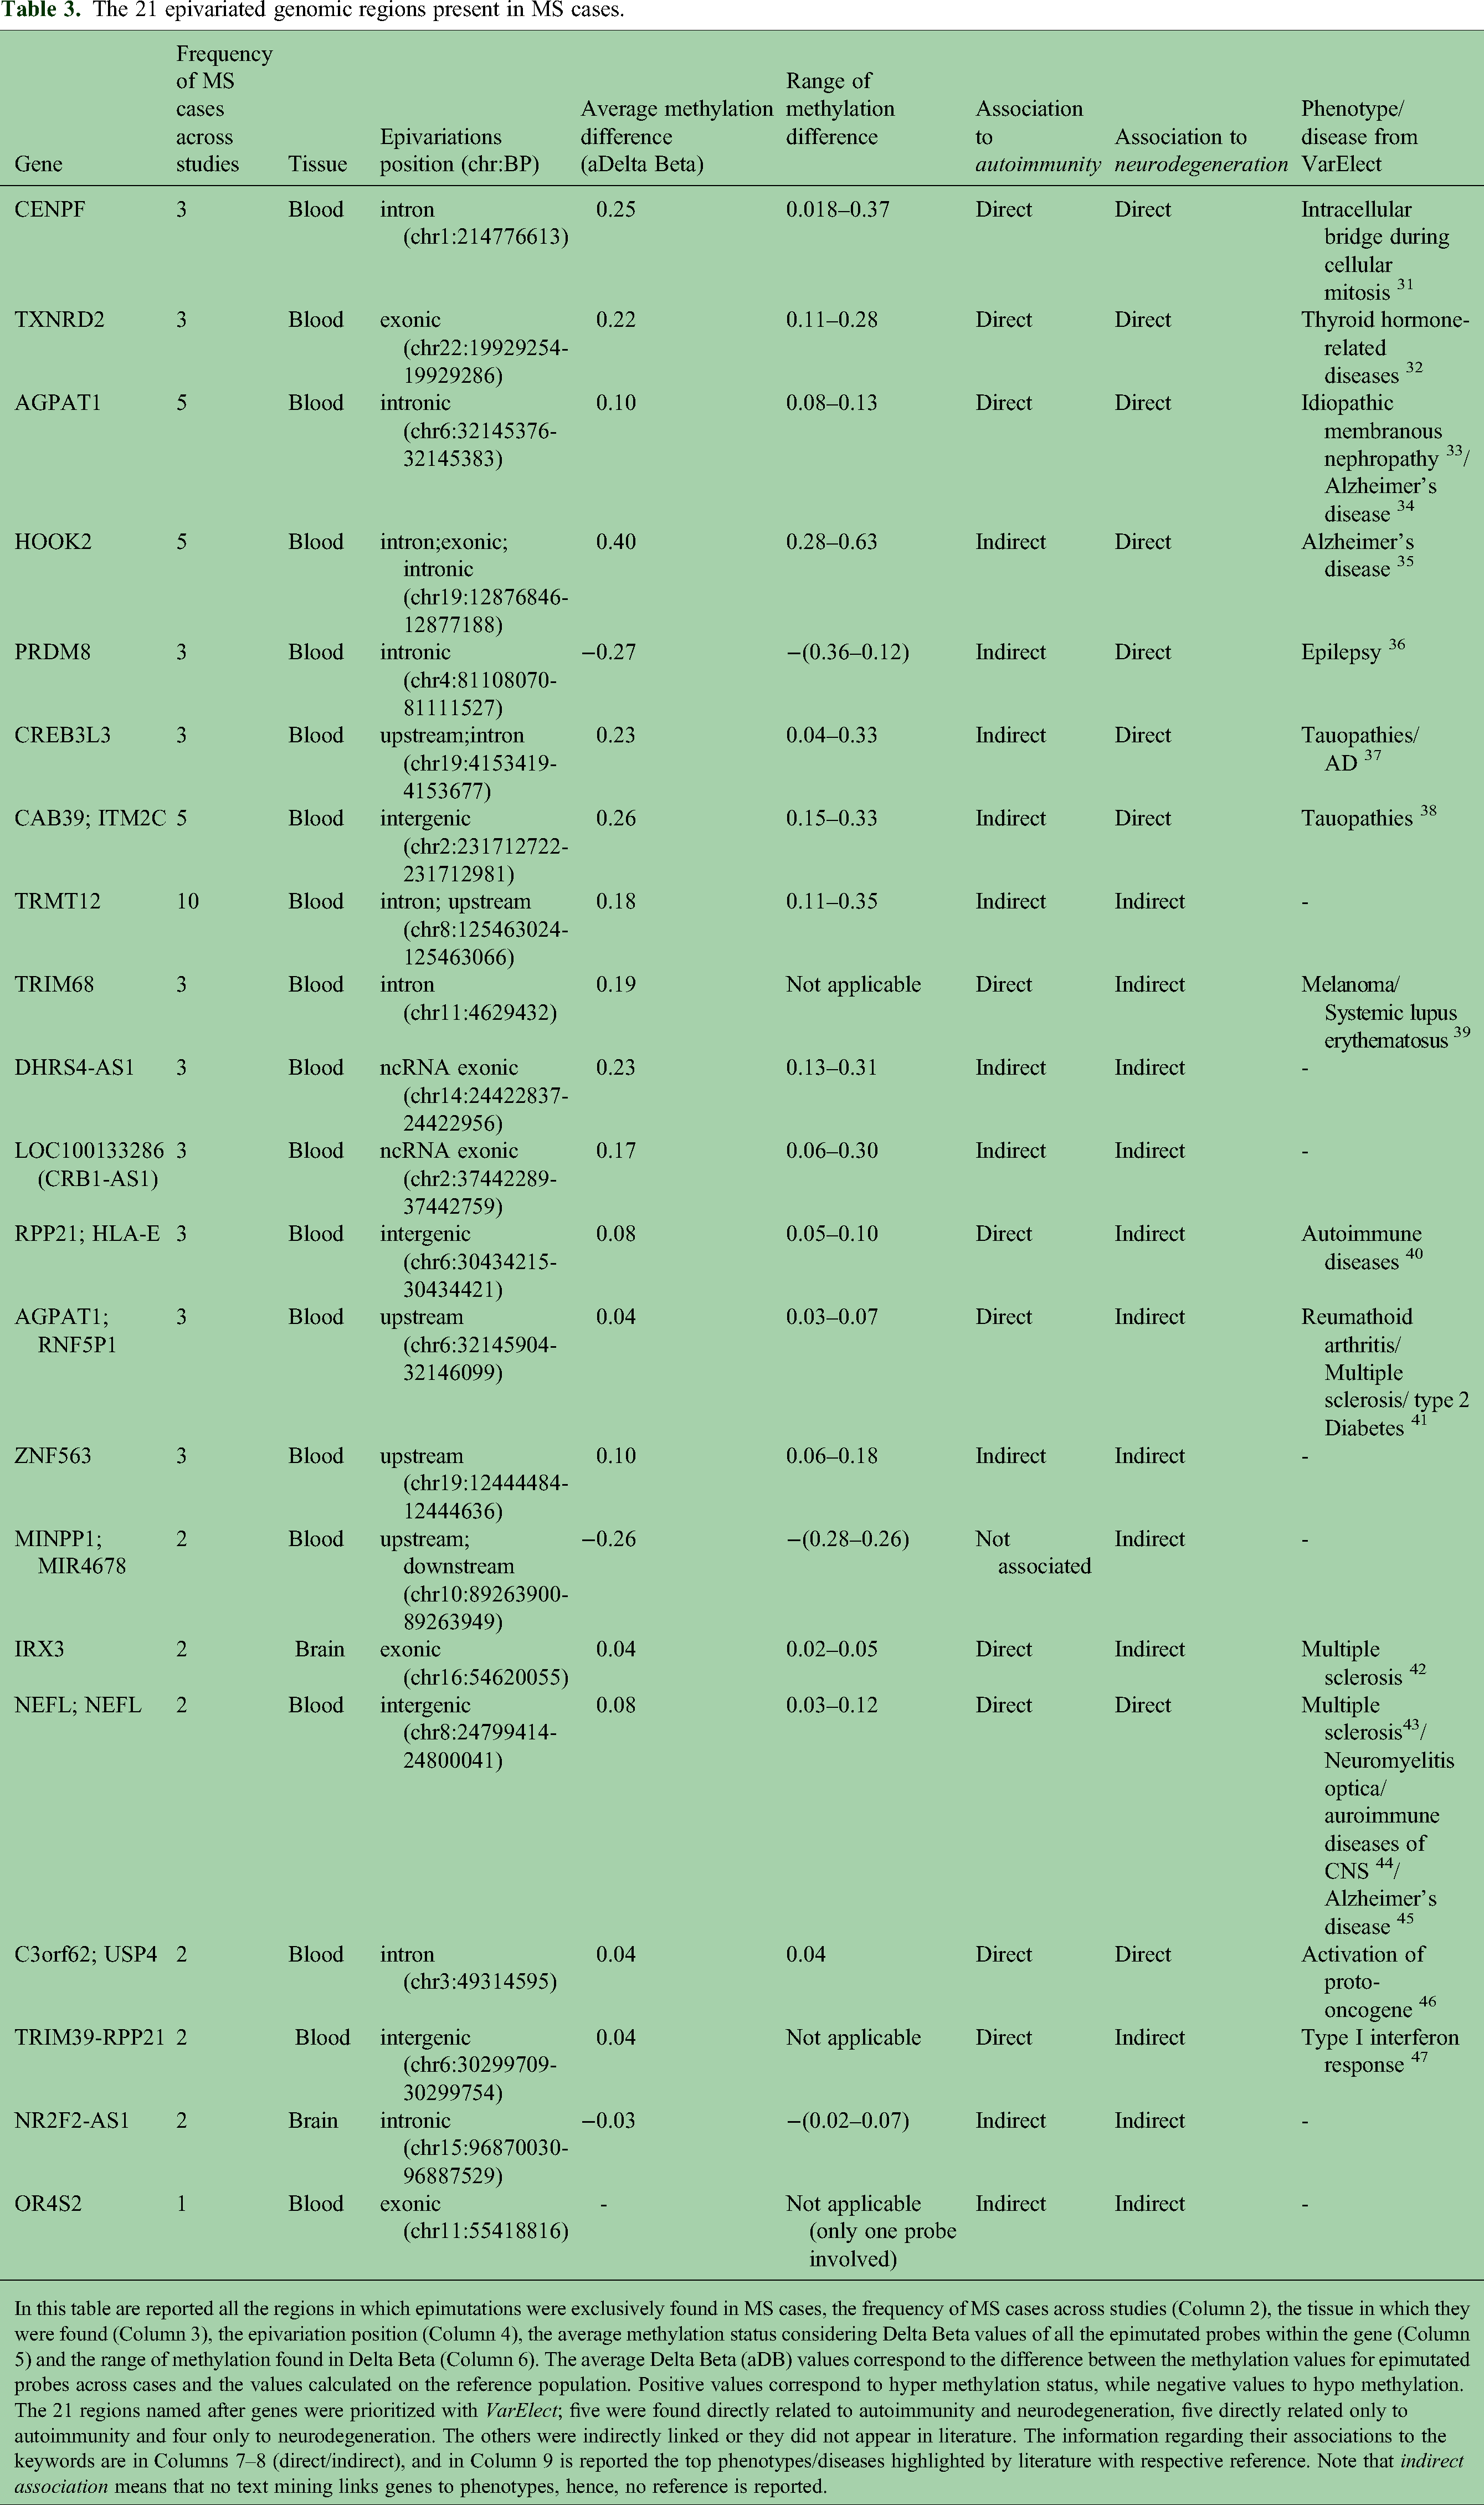
In this table are reported all the regions in which epimutations were exclusively found in MS cases, the frequency of MS cases across studies (Column 2), the tissue in which they were found (Column 3), the epivariation position (Column 4), the average methylation status considering Delta Beta values of all the epimutated probes within the gene (Column 5) and the range of methylation found in Delta Beta (Column 6). The average Delta Beta (aDB) values correspond to the difference between the methylation values for epimutated probes across cases and the values calculated on the reference population. Positive values correspond to hyper methylation status, while negative values to hypo methylation.
The 21 regions named after genes were prioritized with VarElect; five were found directly related to autoimmunity and neurodegeneration, five directly related only to autoimmunity and four only to neurodegeneration. The others were indirectly linked or they did not appear in literature. The information regarding their associations to the keywords are in Columns 7–8 (direct/indirect), and in Column 9 is reported the top phenotypes/diseases highlighted by literature with respective reference. Note that indirect association means that no text mining links genes to phenotypes, hence, no reference is reported.
Moreover, we used VarElect 30 to prioritize the most relevant genes, focusing on those associated with autoimmunity or neurodegeneration keywords in the phenotype.
Eventually, the set of genes was subsequently explored using the Genotype-Tissue Expression (GTEx) 48 database showing the expression profiles across both whole blood and 13 distinct brain regions. Among the 21 genomic regions found epivariated in brain and blood tissues, the gene LOC100133286 (CRB1-AS1) found epivariated in three MS cases, was not found in the GTEx database, hence was not shown in pattern of genes’ expression (Figure 3). Expression was measured in transcripts per million, which is the ratio of the number of transcripts per gene over the total number of transcripts in the sample multiplied by 10⁶, with reference to databases where each gene's expression has already been registered. Combining methylation data with expression data from GTEx allows for a more holistic understanding of gene regulation. This integrated approach can identify key regulatory mechanisms and pathways involved in diseases. Comprehensive results of epivariations can be found in Supplementary Tables (SM3_Blood, SM3_Brain). Phenotype analysis revealed that five genes are directly linked to both phenotypes (highlighted in bold: TXNRD2, NEFL, AGPAT1, USP4, and CENPF). Another five genes were specifically associated with autoimmunity (HLA-E, TRIM68, TRIM39-RPP21, IRX3, and RNF5P1), while four genes were related only to neurodegeneration (ITM2C, HOOK2, CREB3L3, and PRDM8).31–47 Other genes were found to have indirect associations. This prioritization helped identify the most significant genes for MS research.

Expression of the 21 genes found epivariated in MS case (more than two MS cases). The 21 genes found epivariated in brain and blood have been annotated in with GTEx database. The expression was checked in brain tissues (yellow) and in whole blood (purple), and it is shown as matrix of expression with color scale showing the increment (from straw yellow to dark blue) of measured transcripts per kilobase million (TPM). Note that the Long non-coding RNA LOC100133286 was absent from the database.
Discussion
This research explores the epigenetic landscape of MS through a meta-analytical approach primarily to identify plausible epigenetic markers that serve as signatures for the disease, in particular in whole blood, considering the different cellular composition and consistency across various races and ethnicities. By utilizing larger datasets from the GEO database, we aimed to achieve a more robust and precise identification of significant methylation changes associated with MS, which may be attributed to the disease's pathogenesis, 49 thereby reducing the likelihood of spurious findings. Results reported a notable differential methylation pattern within the HLA-DRB1 region (p-value < 10-6) between MS cases and controls, in the whole blood methylome. HLA-DRB1, the major histocompatibility complex (MHC), is one of the most significant genetic factors associated with an increased risk of developing MS. 50 Specifically, cg17416722 showed increased methylation while cg09139047 displayed decreased methylation. These findings aligned with previous studies by Kular et al. 13 and Xavier et al., 51 which underscore the HLA-DRB1 gene's role in MS. Although consistent, findings may not reach the 5% FDR level of statistical robustness required to make broad conclusions. By using a significance threshold of 10−5 for prioritization, no specific pathway was significantly enriched by ORA in whole blood. On the other hand, for the brain tissue, our analysis aimed to identify consistent common epigenetic alterations across different regions, including white matter, astrocytes, and microglia. This approach was adopted to ensure more robust and reliable results. The analysis revealed several genes with increased methylation in MS cases, such as NAV2, KCNQ4, KAZN, and CADM1, while METTL21C exhibited decreased methylation. ORA suggested that MS-related changes in brain tissue methylation may involve genes associated with neurodevelopment and cellular signaling. Pathway analysis highlighted significant enrichment in pathways related to sphingolipid metabolism and arginine/proline metabolism.
Moreover, as an innovative aspect of this study, epigenetic drift and rare epivariations were analysed. Epigenetic drift refers to the gradual accumulation of epigenetic changes, such as DNA methylation alterations, over time, contributing to age-related diseases and variability in gene expression. Stochastic epigenetic mutations, recognized as markers of epigenetic drift, may play a significant role in the development and progression of complex diseases. 24 While the analysis of Global-EML revealed no disparities in epigenetic drift between cases and controls, across studies, the Gene-EML analysis revealed a significant difference between the two groups. Specifically, a list of 247 genes in blood and 566 genes in the brain exhibited an elevated epigenetic drift in cases compared to controls. Over-Representation Analysis findings in the brain included terms associated with neuroprojection, neurons, axons, and synapses, all crucial for CNS activity. Furthermore, alterations and dysfunction in synapses, particularly in glutamatergic synapses, are likely correlated with the presence of cognitive and mental symptoms in MS. 52 These findings highlight the potential impact of epigenetic drift on these critical functions, suggesting a possible role in the pathophysiology and evolution of MS. In the blood tissue, enriched terms were linked to striated muscle cell differentiation, glutamate signaling in telencephalon development, muscle cell differentiation, and neuron differentiation. These results can be consistently gathered with the previous studies’ findings investigating the impact of MS on skeletal muscle characteristics, 53 indicating adverse effects on the cross-sectional area of muscle fibers, muscle strength, and muscle mass.
Another aim of the study was to analyze biological age between cases and controls in terms of means. The Grimage clock was employed to investigate the potential impact of MS progression on cellular population changes. Our findings indicated no significant differences in age acceleration between MS cases and controls in whole blood (mean = 0.04, 95% CI = −0.59 to 0.67) and brain tissue (mean = −0.69, 95% CI = −1.53 to 0.16). Apparently, these are in contrast with the study by Maltby et al., 54 which reported a significant increase in age acceleration among MS patients versus controls, specifically observing a nine-month increase in age acceleration. Firstly, this discrepancy may be attributed to differences in sample size, as Maltby's study included a larger cohort, potentially allowing for the detection of smaller effect sizes. Secondarily, despite this notable result, it is important to interpret such minor biological effects with caution. In light of the existing literature, which has identified only limited changes in age acceleration in blood samples and more pronounced differences specifically in B lymphocytes, the results of this study suggest that biological aging may not be a high impact and widespread phenomenon in MS patients. Furthermore, the data from brain tissue also do not indicate a generalized state of brain aging. This supports the notion that, at least in the context of MS, biological age might not be uniformly elevated across different tissues.
An additional level of analysis focused on rare epivariations, which are rare but substantial changes in DNA methylation affecting specific regions or genes. While these epivariations have been linked to various neurological conditions such as ALS, 15 autism, 26 and their potential role in MS remains unexplored. The analysis identified 21 rare epivariations that were unique to MS patients. Notably, these epivariations were absent in the control group and had never been observed in a large cohort of 23,116 subjects from the general population. Comprehensively, the genes associated with these epivariations were further prioritized based on their relevance to autoimmunity or neurodegeneration phenotypes, as highlighted in literature (Table 3). This analysis identified direct associations with several genes, including TXNRD2, NEFL, HLA-E, TRIM68, CENPF, USP4, TRIM39-RPP21, AGPAT1, IRX3, and RNF5P1, many of which were investigated in neurodegenerative diseases as highlighted in Table 3.31–47 Among those present in at least three MS cases related to neurodegeneration, the highest aDB value was found in HOOK2 (aDB = 0.4), predominantly expressed in astrocytes, which belongs to the Hook family of coding-genes associated with pathological hallmarks in AD. 35 Other consistent aDB values in epivariations were found in CREB3L3 (aDB = 0.23), which, through its role in endoplasmic reticulum chaperones, may be implicated in both physiological and pathological processes in neurodegenerative diseases. 55 The region CAB39;ITM2C (aDB = 0.26), which has been proposed to differentiate MS patients from healthy controls based on the expression profile of peripheral blood mononuclear cells, emphasizing the role of autoreactive T cells in MS. 56 The major hypomethylated epivariation was found in PRDM8 (aDB = −0.27), predominantly expressed in testis and in various districts of the CNS, with significant levels found in the hippocampus, amygdala, and cerebral cortex. 57 This gene belongs to a coding-gene family of histone methyltransferases that are believed to act as negative regulators of transcription and play an important role in the development and cell differentiation. 58 Their level of methylation was found to have an aggregating effect with MS-associated variants in the MHC (chromosome 6), influencing DNA methylation near PRKCA (chromosome 17).
Additionally, two epivariated regions for coding proteins involved in cell division and cellular processes were found hypermethylated: CENPF (aDB = 0.25), and AGAPT1 both associated with neurodegeneration and autoimmunity phenotypes. In particular, AGPAT1, involved in neural inflammation, was found epivariated in two regions: in one intronic segment (aDB = 0.1) and shortly in upstream AGPAT1; RNF5P1 (aDB = 0.04). Eventually, the oxidase enzyme coded by the TXNRD2 gene (aDB = 0.22), implicated in oxidative stress defense, could emerge as a potential therapeutic target for MS, as inflammation-associated oxidative bursts in activated microglia and macrophages, and free radical-mediated tissue injury play a significant role in the demyelination process of MS pathogenesis. 59 After prioritizing the epivariated regions in the brain, no consistent accumulation was observed, taking into account only those epivariations that appeared in at least three MS cases.
It is important to note that the Delta Beta value represents an average of methylation differences, which might not fully capture the heterogeneity present within the epivariation region. 60 Moreover, the Delta Beta can reflect mosaicism, a condition where different cells within the same tissue have distinct methylation states. Hence, the Delta Beta does not necessarily indicate a uniform change across all cells but rather may highlight a complex and varied pattern of methylation within the cell population.
In conclusion, this study advances our understanding of the epigenetic landscape of MS by integrating a meta-analytical approach with novel analyses of epigenetic drift, rare epivariations, and biological age. Despite these contributions, there are notable limitations. The study did not yield genome-wide significant results after adjusting for FDR, suggesting that, while some findings are promising, they may not fully elucidate the complex nature of MS pathology at the moment. Additionally, the lack of comprehensive clinical data and the heterogeneity among the populations studied may affect the interpretation and generalizability of the results. Although the sample size was limited, this research focused exclusively on publicly available datasets with direct access to raw data to ensure greater transparency and replicability of the findings. Nevertheless, the inclusion of epigenetic age analysis, alongside the innovative exploration of epigenetic drift and rare epivariations, provides new insights and sets the stage for future research into the epigenetic mechanisms of MS.
Supplemental Material
sj-docx-1-mso-10.1177_20552173241296726 - Supplemental material for Exploring the complexities of epigenetics in multiple sclerosis: A study involving meta-analysis of DNA methylation profiles, epigenetic drift, and rare epivariations
Supplemental material, sj-docx-1-mso-10.1177_20552173241296726 for Exploring the complexities of epigenetics in multiple sclerosis: A study involving meta-analysis of DNA methylation profiles, epigenetic drift, and rare epivariations by Giulia Nicole Baldrighi, Rebecca Cavagnola, Davide Sacco, Lucy Costantino, Luisa Bernardinelli and Davide Gentilini in Multiple Sclerosis Journal – Experimental, Translational and Clinical
Supplemental Material
sj-xlsx-2-mso-10.1177_20552173241296726 - Supplemental material for Exploring the complexities of epigenetics in multiple sclerosis: A study involving meta-analysis of DNA methylation profiles, epigenetic drift, and rare epivariations
Supplemental material, sj-xlsx-2-mso-10.1177_20552173241296726 for Exploring the complexities of epigenetics in multiple sclerosis: A study involving meta-analysis of DNA methylation profiles, epigenetic drift, and rare epivariations by Giulia Nicole Baldrighi, Rebecca Cavagnola, Davide Sacco, Lucy Costantino, Luisa Bernardinelli and Davide Gentilini in Multiple Sclerosis Journal – Experimental, Translational and Clinical
Supplemental Material
sj-xlsx-3-mso-10.1177_20552173241296726 - Supplemental material for Exploring the complexities of epigenetics in multiple sclerosis: A study involving meta-analysis of DNA methylation profiles, epigenetic drift, and rare epivariations
Supplemental material, sj-xlsx-3-mso-10.1177_20552173241296726 for Exploring the complexities of epigenetics in multiple sclerosis: A study involving meta-analysis of DNA methylation profiles, epigenetic drift, and rare epivariations by Giulia Nicole Baldrighi, Rebecca Cavagnola, Davide Sacco, Lucy Costantino, Luisa Bernardinelli and Davide Gentilini in Multiple Sclerosis Journal – Experimental, Translational and Clinical
Supplemental Material
sj-xlsx-4-mso-10.1177_20552173241296726 - Supplemental material for Exploring the complexities of epigenetics in multiple sclerosis: A study involving meta-analysis of DNA methylation profiles, epigenetic drift, and rare epivariations
Supplemental material, sj-xlsx-4-mso-10.1177_20552173241296726 for Exploring the complexities of epigenetics in multiple sclerosis: A study involving meta-analysis of DNA methylation profiles, epigenetic drift, and rare epivariations by Giulia Nicole Baldrighi, Rebecca Cavagnola, Davide Sacco, Lucy Costantino, Luisa Bernardinelli and Davide Gentilini in Multiple Sclerosis Journal – Experimental, Translational and Clinical
Supplemental Material
sj-xlsx-5-mso-10.1177_20552173241296726 - Supplemental material for Exploring the complexities of epigenetics in multiple sclerosis: A study involving meta-analysis of DNA methylation profiles, epigenetic drift, and rare epivariations
Supplemental material, sj-xlsx-5-mso-10.1177_20552173241296726 for Exploring the complexities of epigenetics in multiple sclerosis: A study involving meta-analysis of DNA methylation profiles, epigenetic drift, and rare epivariations by Giulia Nicole Baldrighi, Rebecca Cavagnola, Davide Sacco, Lucy Costantino, Luisa Bernardinelli and Davide Gentilini in Multiple Sclerosis Journal – Experimental, Translational and Clinical
Supplemental Material
sj-xlsx-6-mso-10.1177_20552173241296726 - Supplemental material for Exploring the complexities of epigenetics in multiple sclerosis: A study involving meta-analysis of DNA methylation profiles, epigenetic drift, and rare epivariations
Supplemental material, sj-xlsx-6-mso-10.1177_20552173241296726 for Exploring the complexities of epigenetics in multiple sclerosis: A study involving meta-analysis of DNA methylation profiles, epigenetic drift, and rare epivariations by Giulia Nicole Baldrighi, Rebecca Cavagnola, Davide Sacco, Lucy Costantino, Luisa Bernardinelli and Davide Gentilini in Multiple Sclerosis Journal – Experimental, Translational and Clinical
Supplemental Material
sj-xlsx-7-mso-10.1177_20552173241296726 - Supplemental material for Exploring the complexities of epigenetics in multiple sclerosis: A study involving meta-analysis of DNA methylation profiles, epigenetic drift, and rare epivariations
Supplemental material, sj-xlsx-7-mso-10.1177_20552173241296726 for Exploring the complexities of epigenetics in multiple sclerosis: A study involving meta-analysis of DNA methylation profiles, epigenetic drift, and rare epivariations by Giulia Nicole Baldrighi, Rebecca Cavagnola, Davide Sacco, Lucy Costantino, Luisa Bernardinelli and Davide Gentilini in Multiple Sclerosis Journal – Experimental, Translational and Clinical
Supplemental Material
sj-xlsx-8-mso-10.1177_20552173241296726 - Supplemental material for Exploring the complexities of epigenetics in multiple sclerosis: A study involving meta-analysis of DNA methylation profiles, epigenetic drift, and rare epivariations
Supplemental material, sj-xlsx-8-mso-10.1177_20552173241296726 for Exploring the complexities of epigenetics in multiple sclerosis: A study involving meta-analysis of DNA methylation profiles, epigenetic drift, and rare epivariations by Giulia Nicole Baldrighi, Rebecca Cavagnola, Davide Sacco, Lucy Costantino, Luisa Bernardinelli and Davide Gentilini in Multiple Sclerosis Journal – Experimental, Translational and Clinical
Supplemental Material
sj-xlsx-9-mso-10.1177_20552173241296726 - Supplemental material for Exploring the complexities of epigenetics in multiple sclerosis: A study involving meta-analysis of DNA methylation profiles, epigenetic drift, and rare epivariations
Supplemental material, sj-xlsx-9-mso-10.1177_20552173241296726 for Exploring the complexities of epigenetics in multiple sclerosis: A study involving meta-analysis of DNA methylation profiles, epigenetic drift, and rare epivariations by Giulia Nicole Baldrighi, Rebecca Cavagnola, Davide Sacco, Lucy Costantino, Luisa Bernardinelli and Davide Gentilini in Multiple Sclerosis Journal – Experimental, Translational and Clinical
Supplemental Material
sj-png-10-mso-10.1177_20552173241296726 - Supplemental material for Exploring the complexities of epigenetics in multiple sclerosis: A study involving meta-analysis of DNA methylation profiles, epigenetic drift, and rare epivariations
Supplemental material, sj-png-10-mso-10.1177_20552173241296726 for Exploring the complexities of epigenetics in multiple sclerosis: A study involving meta-analysis of DNA methylation profiles, epigenetic drift, and rare epivariations by Giulia Nicole Baldrighi, Rebecca Cavagnola, Davide Sacco, Lucy Costantino, Luisa Bernardinelli and Davide Gentilini in Multiple Sclerosis Journal – Experimental, Translational and Clinical
Footnotes
Availability of data and material
The datasets analysed in this study can be found in the online repository Gene Expression Omnibus (GEO) with study accession numbers GSE219293, GSE166207, GSE40360, GSE88824, GSE106648, and GSE119532.
Declaration of conflicting interests
The author(s) declared no potential conflicts of interest with respect to the research, authorship, and/or publication of this article.
Funding
The author(s) disclosed receipt of the following financial support for the research, authorship, and/or publication of this article: This work is supported by BIBLIOSAN.
Supplemental material
Supplemental material for this article is available online.
References
Supplementary Material
Please find the following supplemental material available below.
For Open Access articles published under a Creative Commons License, all supplemental material carries the same license as the article it is associated with.
For non-Open Access articles published, all supplemental material carries a non-exclusive license, and permission requests for re-use of supplemental material or any part of supplemental material shall be sent directly to the copyright owner as specified in the copyright notice associated with the article.