
Abstract
Background
Excessive daytime sleepiness (EDS) in multiple sclerosis (MS) can be a significant source of disability. Despite this, its prevalence as a patient-reported outcome in this condition has not been well established, and its causes are not well understood.
Methods
We prospectively assessed EDS as part of an observational study for patients referred for diagnostic neuro-ophthalmological testing. EDS was evaluated by the Epworth Sleepiness Scale (ESS), and visual data were also collected as part of a research protocol. Analysis with patient data was performed following the exclusion of patients with known primary sleep disorders.
Results
A total of 69 patients with MS were included in the analysis. The mean ESS was 6.5 with a SD of 4.3. ESS ≥ 10 was present in 23% of the cohort even in the presence of minimal mean neurological disability (Patient Determined Disease Steps (PDDS) = 1.5). The ESS score was not associated with age, sex, disease-related disability, retinal nerve fiber layer (RNFL), or optic neuritis (ON), but displayed an association with visual dysfunction.
Conclusions
There is an increased prevalence of EDS in MS. The increased values of the ESS are not explained by other sleep disorders, suggesting separate mechanisms. Further study of the underlying mechanisms is warranted.
Keywords
Introduction
Multiple sclerosis (MS) is a central nervous system disease with quite variable symptomatology, and it is the most common nontraumatic cause of disability in young people. 1 Fatigue and excessive daytime sleepiness (EDS) are among the most common symptoms of the disease,2,3 affecting up to 93% of patients. These symptoms contribute significantly to disability and impaired quality of life while often demonstrating a positively correlated relationship.4,5 Complicating the literature and clinical practice is the use of imprecise language in the clinic and in research to differentiate fatigue from sleepiness. Linguistically, fatigue is the subjective lack of physical and/or mental energy that is perceived by the individual or caregiver to interfere with usual and desired activities. Sleepiness on the other hand is the inability to stay awake and alert during the major waking episodes of the day, resulting in periods of irrepressible need for sleep or unintended lapses into drowsiness or sleep. 6 Importantly, EDS is cited as one of the most common barriers for gainful employement. 7 While abstract, disentangling EDS from fatigue physiologically has allowed us to understand their separate mechanisms and impact.
EDS as a symptom often implies an association with an impairment of sleep and wakefulness as physiological processes. From the neurological perspective, sleep is thought to play a role in neocortical maintenance, memory consolidation, as well as maintenance of the monoaminergic system.8,9 In addition, intact sleep optimizes immune function, with sleep and the immune system having a strong symbiotic relationship. 10 Conversely, chronic sleep impairment is associated with a pro-inflammatory state, which may further drive inflammation and neurodegeneration in conditions such as MS. 11
Impaired sleep and EDS in MS are at least partially explained by an increased risk of primary sleep disorders, including obstructive sleep apnea and periodic limb movement disorder. Despite this association, EDS in MS does not correlate well with established primary sleep disorders, including obstructive sleep apnea 12 or restless leg syndrome (RLS). 13 Even in RLS, the degree of restlessness does not correlate well with patient-reported metrics of sleepiness, 14 suggesting alternative pathophysiological mechanisms at play for the majority of patients with MS and EDS. Circadian rhythm disorders have been posited as a potential explanation of EDS in patients with MS. There is preliminary evidence to support this claim,6,15 but the true prevalence of circadian rhythm dysfunction, and its contribution to EDS in MS remain unclear.
In the previous work, we described dysfunction of the intrinsically photosensitive retinal ganglion cell (ipRGC)-driven retino-retinohypothalamic tract which could significantly contribute to circadian rhythm disturbances. 16 Analogous to those with delayed sleep-wake phase and non-24-hour sleep-wake rhythm disorder, 17 aberrations in ipRGC function through visual system disease could lead to free-running circadian rhythms that are not able to synchronize with environmental photic stimuli. The subsequent miscommunication between environment signals and circadian rhythm could shift internal cues, yielding sleep pressure during the day. If present, this deficit would fluctuate over time, and be particularly present during times of lower photic stimulation.18,19 To evaluate our central hypothesis, we sought to investigate whether the Epworth Sleepiness Scale (ESS) as a patient-reported outcome for EDS in MS was associated with visual, and more specifically our marker of ipRGC-mediated retino-retinohypothalamic tract, dysfunction.
Methods
This study was a prospective, observational analysis of patients with MS who were referred for an ongoing study on visual dysfunction in MS between 2020 and 2021 (inclusive) at the University of Texas Southwestern Multiple Sclerosis & Neuroimmunology Clinic. No study procedures took place prior to consent through an IRB-approved protocol. The diagnosis of MS was confirmed by independent chart review to fulfill the 2017 Revised McDonald Criteria. 20 Patients with known confounding primary sleep disorders defined as sleep-related breathing disorders, narcolepsy, periodic limb movement disorder, or RLS were excluded from the analysis.
EDS was assessed by the validated ESS, an eight-question scale intended to capture the probability of falling asleep during certain activities.21,22 Each question consists of a 4-point Likert scale ranging from 0 to 3, with total scores ranging from 0 to 24. EDS is classified in our study as an ESS ≥ 10 as suggested in the literature, 23 with values obtained at baseline and follow-up. Disability was assessed by the Patient Determined Disease Steps (PDDS), which was collected and scored as previously described.24–26 The PDDS is provided for use by the NARCOMS Registry: www.narcoms.org/pdds. NARCOMS is supported in part by the Consortium of Multiple Sclerosis Centers (CMSC) and the CMSC Foundation. All baseline data were collected during the same visit. Optic neuritis (ON) was confirmed by clinical history and required structural confirmation of disease, either by optical coherence tomography (OCT) by standardized criteria 27 or magnetic resonance imaging (MRI) by an independent neuroradiologist. Low-contrast visual acuity (LCVA) testing was performed in the right eye first, left eye second, both eyes last using separate 2.5% contrast 4 m Early Treatment of Diabetic Retinopathy Study (ETDRS) charts, with low-contrast letter acuity (LCLA) reported as previously described. 28 Trained technicians in vision research examinations performed this testing.
OCT was performed on a Spectralis OCT-2 (Heidelberg Engineering, Heidelberg, Germany) operated by one of two users acquiring both macular as well as optic nerve head scans with included eye tracking software. Images were acquired in a dark, quiet room without mydriasis through Nsite and applicable software. OCT scans that did not fulfill at least five of the seven OSCAR-IB criteria 29 were excluded, and retinal segmentation was performed with a semi-automated algorithm. Manual correction of segmentation was performed as required following the review of acquisition while blinded to clinical data. The retinal nerve fiber layer (RNFL) was taken as a 3.4 mm ring scan centered on the optic disc. Ganglion cell layer (GCL) and inner plexiform layer (IPL) was taken as an average thickness across the standard 6 mm ETDRS grid. Interpretation was performed by a single reader. Results are reported in accordance with APOSTEL recommendations 30 with additional information available upon reasonable request. Pupillometry to test the ipRGC-mediated retino-retinohypothalamic tract was performed on a subpopulation as previously described 16 as testing suspended during the fall of 2020 during a high prevalence of COVID-19. The pupillometry protocol briefly explained is a measure of pupil reactivity to a narrow wavelength of blue light that stimulates the primary chromophore of the ipRGC, normalized to the same intensity and duration of a red-light stimulation response. While a handful of ipRGC biomarkers are present in the literature, this marker is normalized to the rod response as there is well-documented rod-mediated pupil dysfunction in patients with MS, 31 and averaged over both pupils to minimize efferent visual system confounders such as the numerous symptomatic medications used in MS that can change pupil reactivity, in principle increasing its specificity. In calculating the ipRGC response, if a pupil tracking was lost during the red or blue stimulus, or within 1 s of the 6 s mark, the results were discarded as suggested in the literature. 32 Seasonal definitions and historical daylight exposure for the Dallas area was obtained by data provided through the National Oceanic and Atmospheric Administration.
Summary statistics were calculated for all variables (mean/SD, or number/percentage for categorical variables). Statistical Analysis was performed with R and MATLAB. Multiple linear regression was used to model the impacts of ipRGC, RNFL, GCL + IPL, and LCLA independently on the ESS. Covariates included in the analysis of ESS based on LCLA included the minimum monocular LCLA, LCLA interocular difference (IOD), the interaction of the two covariates, and binocular LCLA. Covariates included in the analysis of ESS based on ipRGC, RNFL, and GCL + IPL included the minimum monocular value, IOD, and the interaction between the minimum monocular value and IOD. Covariates included in the analysis of ESS based on ipRGC, RNFL, and GCL + IPL included the minimum monocular value, IOD, and the interaction between the minimum monocular value and IOD. Assumptions of linear regression were verified using the Shapiro–Wilk test for normality and residual plots for the homogeneity of variance. Seasonal variation was analyzed using pairwise Mann–Whitney U test. Significance level was defined to be 5%. Given the exploratory nature of the proposal, no adjustment was performed for multiple analyses.
Results
The study included 69 participants with MS, and the characteristics of which are shown in Table 1. The mean age of the cohort was 43.6 years, and 75% were female. The cohort had limited disability, as the mean PDDS was 1.5, with only four subjects requiring bilateral gait support. The demographics of the subpopulation that completed pupillometry were comparable to the overall cohort, with the exception of a slightly higher incidence of ON (36% vs. 23%). Relative to the entire cohort, there was generally less sleepiness, and less individuals who fulfilled the predefined definition for EDS.
Summary of subject characteristics.

ESS: Epworth Sleepiness Scale; PDDS: Patient Determined Disease Steps.
Based on the results of the multiple linear regression, age, sex, PDDS, and history of ON had no significant association with the ESS, with coefficient estimates and standard errors are shown in Table 2.
Linear regression covariates for excessive daytime sleepiness (EDS).

PDDS: Patient Determined Disease Steps; ON: optic neuritis.
An analysis of season effects on individual patients with MS through the ESS did not reveal a statistically significant difference between the four seasons, as shown in Figure 1, but perhaps with a slight trend toward higher sleepiness in winter relative to fall, when the total light daytime duration shortens the most. This trend was similarly reflected in the prevalence of EDS, as well as degree of sleepiness in those with EDS (Supplemental Figures 1 and 2).

Box–Whisker plot for Epworth Sleepiness Scale (ESS) in individual patients with multiple sclerosis (MS) relative to season at baseline measurement.
There was no significant association of the ESS with minimum monocular or binocular LCLA, but a near-significant effect (p ≈ 0.05) was observed for the IOD, shown in Table 3. An interaction term between LCLA and LCLA IOD was not statistically significant, indicating that as the minimum monocular LCLA increases, there is no change in the impact of LCLA IOD on the ESS. When examining the more specific role of ipRGC function in the subpopulation, the three covariates examined were similarly not significant, albeit with perhaps a slightly similar trend toward ipRGC IOD. Lastly, regarding RNFL and GCL + IPL, no association was found between the minimum monocular value, the IOD, or the interaction between the minimum monocular value and IOD.
Visual metric covariates for Epworth Sleepiness Scale (ESS).
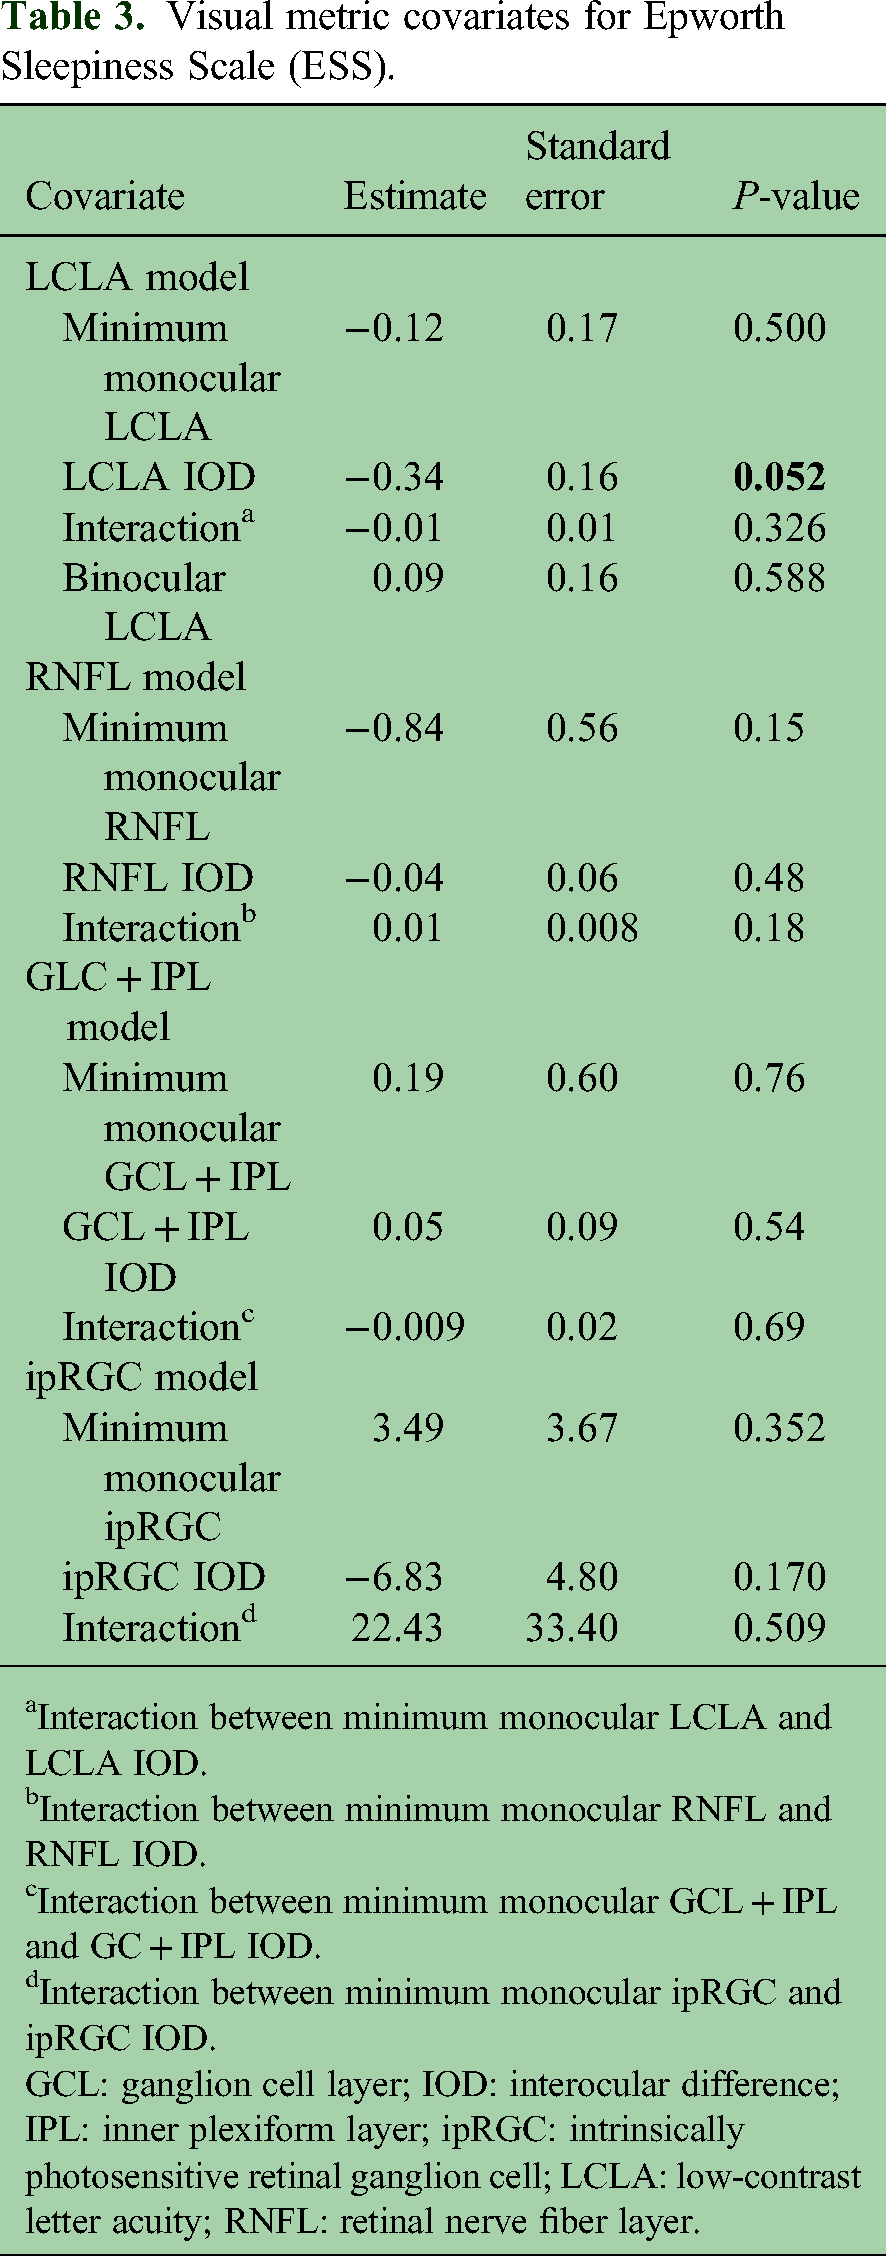
Interaction between minimum monocular LCLA and LCLA IOD.
Interaction between minimum monocular RNFL and RNFL IOD.
Interaction between minimum monocular GCL + IPL and GC + IPL IOD.
Interaction between minimum monocular ipRGC and ipRGC IOD.
GCL: ganglion cell layer; IOD: interocular difference; IPL: inner plexiform layer; ipRGC: intrinsically photosensitive retinal ganglion cell; LCLA: low-contrast letter acuity; RNFL: retinal nerve fiber layer.
Discussion
EDS is a particularly disabling symptom among patients with MS, and its pathophysiology is incompletely understood. While there is an increased risk of certain sleep disorders, there remains a substantial gap in our understanding of the cause of EDS. Herein we provide preliminary data for disease associations of EDS in patients with MS, which has implications for understanding its pathophysiology.
We did not find any significant association of EDS with age, sex, interocular RNFL, interocular GCL, ON, or reported physical disability in patients with MS, which is congruous with what has been reported in the literature. 33 There was slight seasonality of the patient-reported outcome, which coincides with degree of sun exposure in the southern United States. During the summer there is generally greater photic exposure relative to the winter. At our study site in Dallas, TX, the temporal difference in total daylight duration between winter and summer can exceed 4 h.
Retinal and optic nerve disease is ubiquitous in MS, with 50% of patients experiencing ON in their lifetime, and nearly all patients displaying evidence of disease postmortem, making it a plausible foundation for highly prevalent symptomatology in the disease. 34 The visual system has many interactions with human physiology, but to the authors’ knowledge, this is the first description of an association between visual dysfunction and EDS in MS at the risk of an additional 0.2% risk of Type I error. The speculation of a physiologic correlate of this relationship is of interest. At the cellular level, light stimulation is interfaced through rods, cones, and ipRGCs to control not only vision but also to influence many aspects of homeostasis. While the ipRGC has unique neuro-ophthalmological circuitry, rods, and cones both can interface directly with the ipRGC, which may reflect why the isolated ipRGC biomarker did not reach a statistically significant relationship with EDS.
The statistical strategies and data presented yields insight into the neuro-ophthalmological circuitry influencing EDS. The minimum monocular ipRGC (or LCLA) was chosen because it was hypothesized that lower values of ipRGC (or LCLA) would negatively impact the ESS. Furthermore, it was hypothesized that those subjects whose ipRGC (or LCLA) was low in both eyes, and thereby a small ipRGC IOD, would have the lowest ESS. However, this is problematic to the estimate of the effect of ipRGC IOD because of subjects having low ipRGC IOD when both monocular ipRGC values are high. Therefore, all covariates in the regression models mentioned above were centered so that the interaction term would be positive for subjects whose monocular ipRGC (or LCLA) values were both low (i.e. centered minimum monocular value is negative and centered IOD is negative) versus a negative interaction value for those subjects whose monocular ipRGC (or LCLA) values were both high. In doing so, we are able to avoid the differential impact of low ipRGC (or LCLA) IOD in patient groups, both low ipRGC (or LCLA) and both high ipRGC (or LCLA). This statistical paradigm is rooted in neuroanatomy. Unlike the visual circuitry in perception, is known that binocular facilitation takes place for retino-retinohypothalamic melatonin suppression 35 meaning that even in the case of a severe unilateral deficit, the effect of an intact contralateral retino-retinohypothalamic tract can often maintain the integrity of phase synchronization of the suprachiasmatic nucleus and circadian rhythms (albeit with slightly lower photic sensitivity).
Given the high prevalence of ipRGC dysfunction with the lack of associated EDS, it is likely there is at least one other alternate explanation for EDS in patients with MS. Pathophysiologically, it is plausible that the expanded photic exposure during the summer may be overcoming visual deficits in this patient population, and that this deficit is only uncovered in the setting of decreased photic stimulation (i.e. winter and spring). Unfortunately given the COVID-19 pandemic, pupillometry was largely suspended during this time, which may be a partial explanation for the lack of statistical significance in the hypothesized relationships. While there was no trend toward significance between ipRGC function and EDS, the unusually low prevalence of EDS in this patient subpopulation may have also precluded the detection of this relationship.
The prevalence of EDS from our cohort is lower than that what is reported in the literature3,34 which may be an effect in sampling our patient cohort who had limited disability. Patients with known histories of other primary sleep disorders such as obstructive sleep apnea, periodic limb movement disorder, and RLS were excluded from our study, which may serve as a partial explanation for this discrepancy. Additional longitudinal data will give additional insight into whether such seasonal fluctuations in EDS are repeatable. In addition, while the ESS is a useful clinical screening tool, it may be insensitive as a measure of daytime sleepiness in MS, and other measures of sleepiness and wakefulness, such as wake EEG, may be explored in future work.
There are a few limitations to our study. First would be the inherent bias in sampling patients who are referred for visual testing in our neuro-ophthalmology laboratory. This is unlikely to have contributed significantly from our results as history of ON did not associate with patient-reported outcomes of EDS. Second is the limitations for generalizations given the relatively small number of patients with the disease, and limitations in terms of disability. Logistically, it is difficult to perform pupillometry on patients who lack truncal stability and/or strength, or are stretcher bound. This may be bypassed by engineering a mobile pupil stimulation box. Lastly, not all patients had polysomnography to screen for other primary sleep disorders. Clinically it is difficult to advocate for this in minimally symptomatic patients without risk factors, and in addition, meaning the possibility of ignoring a missed diagnostic covariate of obstructive sleep apnea seems less likely.
Conclusions
This study examines the role of the ESS as a patient-reported outcome in patients with MS, and provides fundamental associations with disease demographics and findings. We provide two lines of evidence that suggest a significant association between visual dysfunction and EDS. As a component of the visual system, the ipRGC is quite pleiotropic, and its dysfunction could contribute to this and symptomatology, including fatigue and impaired mood. Whether visual dysfunction's possible influence on EDS is mediated through circadian rhythm desynchronization or through other mechanisms requires additional study.
Supplemental Material
sj-docx-1-mso-10.1177_20552173231159560 - Supplemental material for Disease associations of excessive daytime sleepiness in multiple sclerosis: A prospective study
Supplemental material, sj-docx-1-mso-10.1177_20552173231159560 for Disease associations of excessive daytime sleepiness in multiple sclerosis: A prospective study by Peter V Sguigna, Sabeen Toranian, Lauren M Tardo, Kyle M Blackburn and Lindsay A Horton, Darrel Conger, Ethan Meltzer, R Nick Hogan, Morgan C McCreary, Phyllis C Zee, Joseph S Takahashi, Benjamin M Greenberg in Multiple Sclerosis Journal – Experimental, Translational and Clinical
Footnotes
Author’s contribution
Peter V. Sguigna has no disclosures related to this publication. He has received grant support from the NMSS, CTM, PSTP, and the PRC. He has received consulting fees from Medical Logix LLC, Genentech, and Bristol Myers Squibb; Sabeen Toranian has nothing to declare; Lauren M. Tardo has nothing to declare; Kyle M. Blackburn has received consulting fees from Genentech; Lindsay A. Horton has nothing to declare; Darrel Conger has nothing to declare; Ethan Meltzer has received research support from Genentech through the University of Texas Dell Medical School. He has received consulting fees from 2nd.MD; R. Nick Hogan has nothing to declare; Morgan C. McCreary has nothing to declare; Phyllis C. Zee serves as a consultant and/or advisor for Jazz Pharmaceuticals, Harmony Biosciences, and Eisai Pharmaceuticals, and served as a consultant/advisor for CVS/Caremark in 2019 and 2020. She has equity ownership/stock options in Teva Pharmaceuticals and received lecture fees/honoraria from Eisai Pharmaceuticals in 2020; Joseph S. Takahashi is a co-founder and SAB member of Synchronicity Pharma and a co-founder and SAB member of Circadian Biotherapies. He receives research support from the Howard Hughes Medical Institute, NIH, A.L. Chilton Foundation, and Milky Way Research Foundation; Benjamin M. Greenberg has received consulting fees from Alexion, Novartis, EMD Serono, Horizon Therapeutics, Genentech/Roche, Signant, IQVIA, Sandoz, Genzyme, Immunovant, and PRIME Education. He has received grant funding from NIH, Anokion, Clene Nanomedicine, and Regeneron. He serves as an unpaid member of the board of the Siegel Rare Neuroimmune Association. He receives royalties from UpToDate.
Declaration of conflicting interests
The author(s) declared no potential conflicts of interest with respect to the research, authorship, and/or publication of this article.
Funding
The author(s) disclosed receipt of the following financial support for the research, authorship, and/or publication of this article: This work was supported by the National Center for Advancing Translational Sciences (grant number UL1TR001105).
ORCID iDs
Supplemental material
Supplemental material for this article is available online.
References
Supplementary Material
Please find the following supplemental material available below.
For Open Access articles published under a Creative Commons License, all supplemental material carries the same license as the article it is associated with.
For non-Open Access articles published, all supplemental material carries a non-exclusive license, and permission requests for re-use of supplemental material or any part of supplemental material shall be sent directly to the copyright owner as specified in the copyright notice associated with the article.