
Abstract
Background
Nearly 70% of individuals with multiple sclerosis report sleep disturbances or poor sleep quality. Sleep disturbances may exacerbate or complicate the management of multiple sclerosis-related symptoms. While sleep variability has been associated with several health outcomes, it is unclear how sleep variability is associated with multiple sclerosis-related symptoms.
Objective
The purpose of this study was to determine how total sleep time variability combined with self-reported sleep quality is associated with fatigue, depression, and anxiety in individuals with multiple sclerosis.
Methods
This study involved a secondary analysis of actigraphy data and questionnaires to assess sleep quality, fatigue, anxiety, and depression.
Results
There were significant differences between the Good Sleepers (good sleep quality/low sleep time variability; n=14) and Bad Sleepers (poor sleep quality/high sleep time variability; n=23) in overall fatigue (p=0.003), cognitive (p=0.002) and psychosocial fatigue (p=0.01) subscales, and in trait anxiety (p=0.007). There were significant differences in state (p=0.004) and trait (p=0.001) anxiety and depression (p=0.002) between the Good Sleepers and Poor Reported Sleepers (poor sleep quality/low sleep time variability; n=24).
Conclusion
These results indicate different factors are associated with poor sleep quality in individuals with low versus high total sleep time variability. Considering the factors that are associated with sleep quality and variability may allow for better tailoring of interventions aimed at improving sleep issues or comorbid conditions.
Introduction
Studies have found that nearly 70% of individuals with multiple sclerosis (MS) report sleep disturbances or poor sleep quality.1,2 Sleep disturbances in individuals with MS can be caused by the disease itself (if demyelination affects the suprachiasmatic nucleus) 3 or by secondary factors often experienced by individuals with MS (such as spasticity, anxiety, stress, depression, and nocturia).4–6 While approximately 50% of individuals with MS have been diagnosed with a sleep disorder, a recent study found that over 70% of individuals with MS screened positive for having at least one sleep disorder although only 13% indicated having a diagnosis of a sleep disorder. 7 Although sleep issues are common in individuals with MS, sleep disorders are often undiagnosed and, therefore, untreated in this population.
Sleep disturbances may exacerbate or complicate the management of MS-related symptoms. Sleep disturbances have been associated with an increase in perceived fatigue, depression, and anxiety in individuals with MS.5,8,9 Sleep issues can also impede physical and cognitive functioning, participation in activities, ability to work, and interpersonal relationships.2,10–13 Furthermore, poor sleep quality has been shown to be an independent predictor of reduced quality of life in individuals with MS.10,11 Sleep disturbances also contribute to increased pain perception, 14 reduced learning of motor skills, 15 and can increase the risk for falls, accidents, and other injuries. 16 Sleep and circadian rhythm influence the expression and modulation of the immune system17,18 which may have particular implications for individuals with MS. Sleep disruption has been associated with a heightened proinflammatory state including an increase in cytokines and oxidative stress.17,18 As immune-mediated demyelination is a well-established mechanism of MS, 19 it is possible that sleep disturbances contribute to the onset and/or exacerbation of MS. 20
Sleep diaries and actigraphy are common methods to gather information about sleep duration and quality over multiple nights of sleep. However, this data is typically averaged across nights and the mean value is reported. There is increased interest in the research community to examine intraindividual variability (IIV) or the extent to which sleep varies from night to night. 21 For example, someone could sleep five hours on night 1, nine hours on night 2, and seven hours on night 3 and the duration would be averaged to seven hours/night. Another person could sleep for seven hours all three nights and the duration would still be averaged to seven hours/night. Reporting the mean excludes valuable information about variablity across the nights. However, reporting sleep time variability alone does not provide a complete picture. For example, someone could sleep for five hours every night and another person could sleep for eight hours every night. Both individuals would have no variability in their sleep, but the first individual would be considered to have less optimal sleep due to sleeping less than the recommended seven or more hours of sleep for adults. 22 Therefore, sleep needs to be considered in multiple ways, including duration, perceived quality, and variability.
IIV is also important to consider as it has been associated with several health outcomes in adults, including increased stress, 23 negative affect, 24 reduced cognitive functioning, 25 and symptoms of insomnia. 26 However, it is unclear how IIV may contribute to MS-related symptoms. Therefore, the purpose of this secondary analysis was to determine if total sleep time variability used in combination with self-reported sleep quality would provide a clearer picture of how sleep issues are associated to MS-related symptoms, including fatigue, depression, and anxiety.
Materials and methods
This is a secondary analysis of sleep data from 66 individuals collected via actigraphy as part of studies to assess the association between sleep quality and cognitive function (although the actigraphy data was not reported) 2 and to assess the association between sleep quality and fatigability. 27 Both studies included individuals with relapsing remitting or secondary progressive and a score of >24 on the Mini Mental Status Examination (MMSE). The study that assessed the association between sleep quality and fatigability 27 had additional inclusion criteria of between ages of 18–60 years and the ability to ambulate with/without an assistive device. Exclusion criteria for both studies were similar and included self-report of known untreated sleep disorder (such as sleep apnea, insomnia, or restless leg syndrome), a history of alcohol/drug abuse or nervous system disorder other than MS, severe physical, neurological, or sensory impairments that would prevent completion of testing, history of learning disability or attention-deficit/hyperactivity disorder, relapse and/or corticosteroid use within four weeks of assessment, and uncorrected vision loss that would interfere significantly with testing. The study that assessed the association between sleep quality and fatigability 27 had additional exclusion criteria that included acute ischemic cardiovascular event or coronary artery bypass surgery less than three months ago, and uncontrolled blood pressure (BP) with medication (BP>190/110 mm Hg).
For both studies, participants completed in-persontesting first and were then issued the actigraphnear the end of the visit. Participants were given apostage-paid envelope to return the actigraph. Participants were recruited from the MS specialty clinic at the University of Kansas Medical Center, the Mid-America Chapter of National MS Society, referral from consented subjects, area physicians, or study personnel, and The University of Kansas Medical Center Frontiers Research Participant Registry. Participants were paid for participating in the study to determine the association between sleep quality and cognitive function 2 but not to participate in the study to determine the association between sleep quality and fatigability. 27 Both studies were approved and conducted in accordance with the Institutional Review Board at the University of Kansas Medical Center. Ninety-one participants participated in the two prior studies, and 66 were included in this secondary analysis. Twenty-five people were excluded from this secondary analysis because 12 did not have actigraphy data, three did not complete the Pittsburgh Sleep Quality Index (PSQI), three were determined to be outliers, and seven had less than four nights of actigraphy data.
For both studies, individuals with MS wore an actigraph (Model wGT3X-BT, ActiGraph Corp., Pensacola, Florida, USA) on their wrist for seven consecutive days. ActiLife software (version 6.11.8) was used to perform wear-time validation and to analyze the sleep data using the Cole-Kripke algorithm. 28 Participants all had at least four valid days of wear time which was defined as at least 10 h of wear time per day. 29 Participants also completed the PSQI to assess self-report sleep quality over the past month. The PSQI yields a global score that ranges from 0–21 and consists of seven items including sleep quality, sleep latency, sleep duration, sleep efficiency, sleep disturbances, use of sleep medication, and daytime dysfunction. These items are individually scored from 0–3, with three representing the negative extreme. The item scores are summed to provide a global score. Poor sleepers have a score >5 as a cutoff global PSQI score with sensitivity (89.6%) and specificity (86.5%). 30 Fatigue was assessed using the Modified Fatigue Impact Scale (MFIS), 31 which consists of physical, cognitive, and psychosocial functioning subscales. The MFIS is a 21-item scale with a combination of nine items for physical status, 10 items for cognitive status, and two items for psychosocial function status over the past four-weeks. A five-point, Likert-type scale with anchors of never (=0) and always (=4) deliver the total scores of these items for the global score of the MFIS which ranges from 0–84. Overall MFIS scores of 38 or above are indicative of MS-related fatigue. State and trait anxiety was assessed using the State Trait Anxiety Inventory (STAI). 32 The STAI is a 40-item Likert scale that measures two dimensions of “state” anxiety (items 1–20) and “trait” anxiety (items 21–40). Each item is rated on a four-point Likert-type scale. Both State and Trait scales were established as unidimensional measures. Scores of each scale range from 20–80, with higher scores associated with greater anxiety. Depression was assessed using the Beck Depression Inventory-Fast Screen (BDI-FS). 33 BDI-FS contains a seven-item self-report inventory measuring the severity of depression symptoms in adolescents and adults, and a high score indicates severe depression symptoms. The scores on BDI-FS range between 0–21. Demographic information including age, sex, MS type, and disease duration was also gathered.
Participants were divided into four groups based on total sleep time (TST) variability gathered by actigraph and the PSQI. To describe TST variability, the coefficient of variance (CV) was calculated for each participant by dividing the sleep duration standard deviation by the sleep duration mean multiplied by 100. Participants were divided into high or low TST variability based on the mean CV for TST variability which was 16.01%. Participants were also divided based on perceived sleep quality. Individuals with a score of >5 on PSQI were classified as having poor sleep quality and those with ≤5 were classified as having good sleep quality. 30 Thus, participants were distributed into four groups: good sleep quality and low sleep variability group (Good Sleepers), good sleep quality and high sleep variability group (Moderate Sleepers), poor sleep quality and low sleep variability group (Poor Reported Sleepers), and poor sleep quality and high sleep variability group (Bad Sleepers).
Data analysis was performed using SPSS (version 24; IBM SPSS Statistics Software). Chi-square tests were used to determine group differences in categorical demographic outcomes (sex, disease type). Due to the unequal sample distribution, Kruskal-Wallis Tests were used to compare outcomes between the four groups. If the omnibus Kruskal-Wallis Test was statistically significant, Bonferroni tests were used to investigate which groups were significantly different. The significance level was set at 0.0125 to adjust for multiple comparisons.
Results
Fourteen participants were in the Good Sleepers group, five participants were in the Moderate Sleepers group, 24 participants were in the Poor Reported Sleepers group, and 23 participants were in the Bad Sleepers group (Figure 1). Descriptive results are reported in Table 1. As expected, the Moderate Sleepers and Bad Sleepers had higher TST variability than the Poor Reported Sleepers and the Good Sleepers (Figure 2).
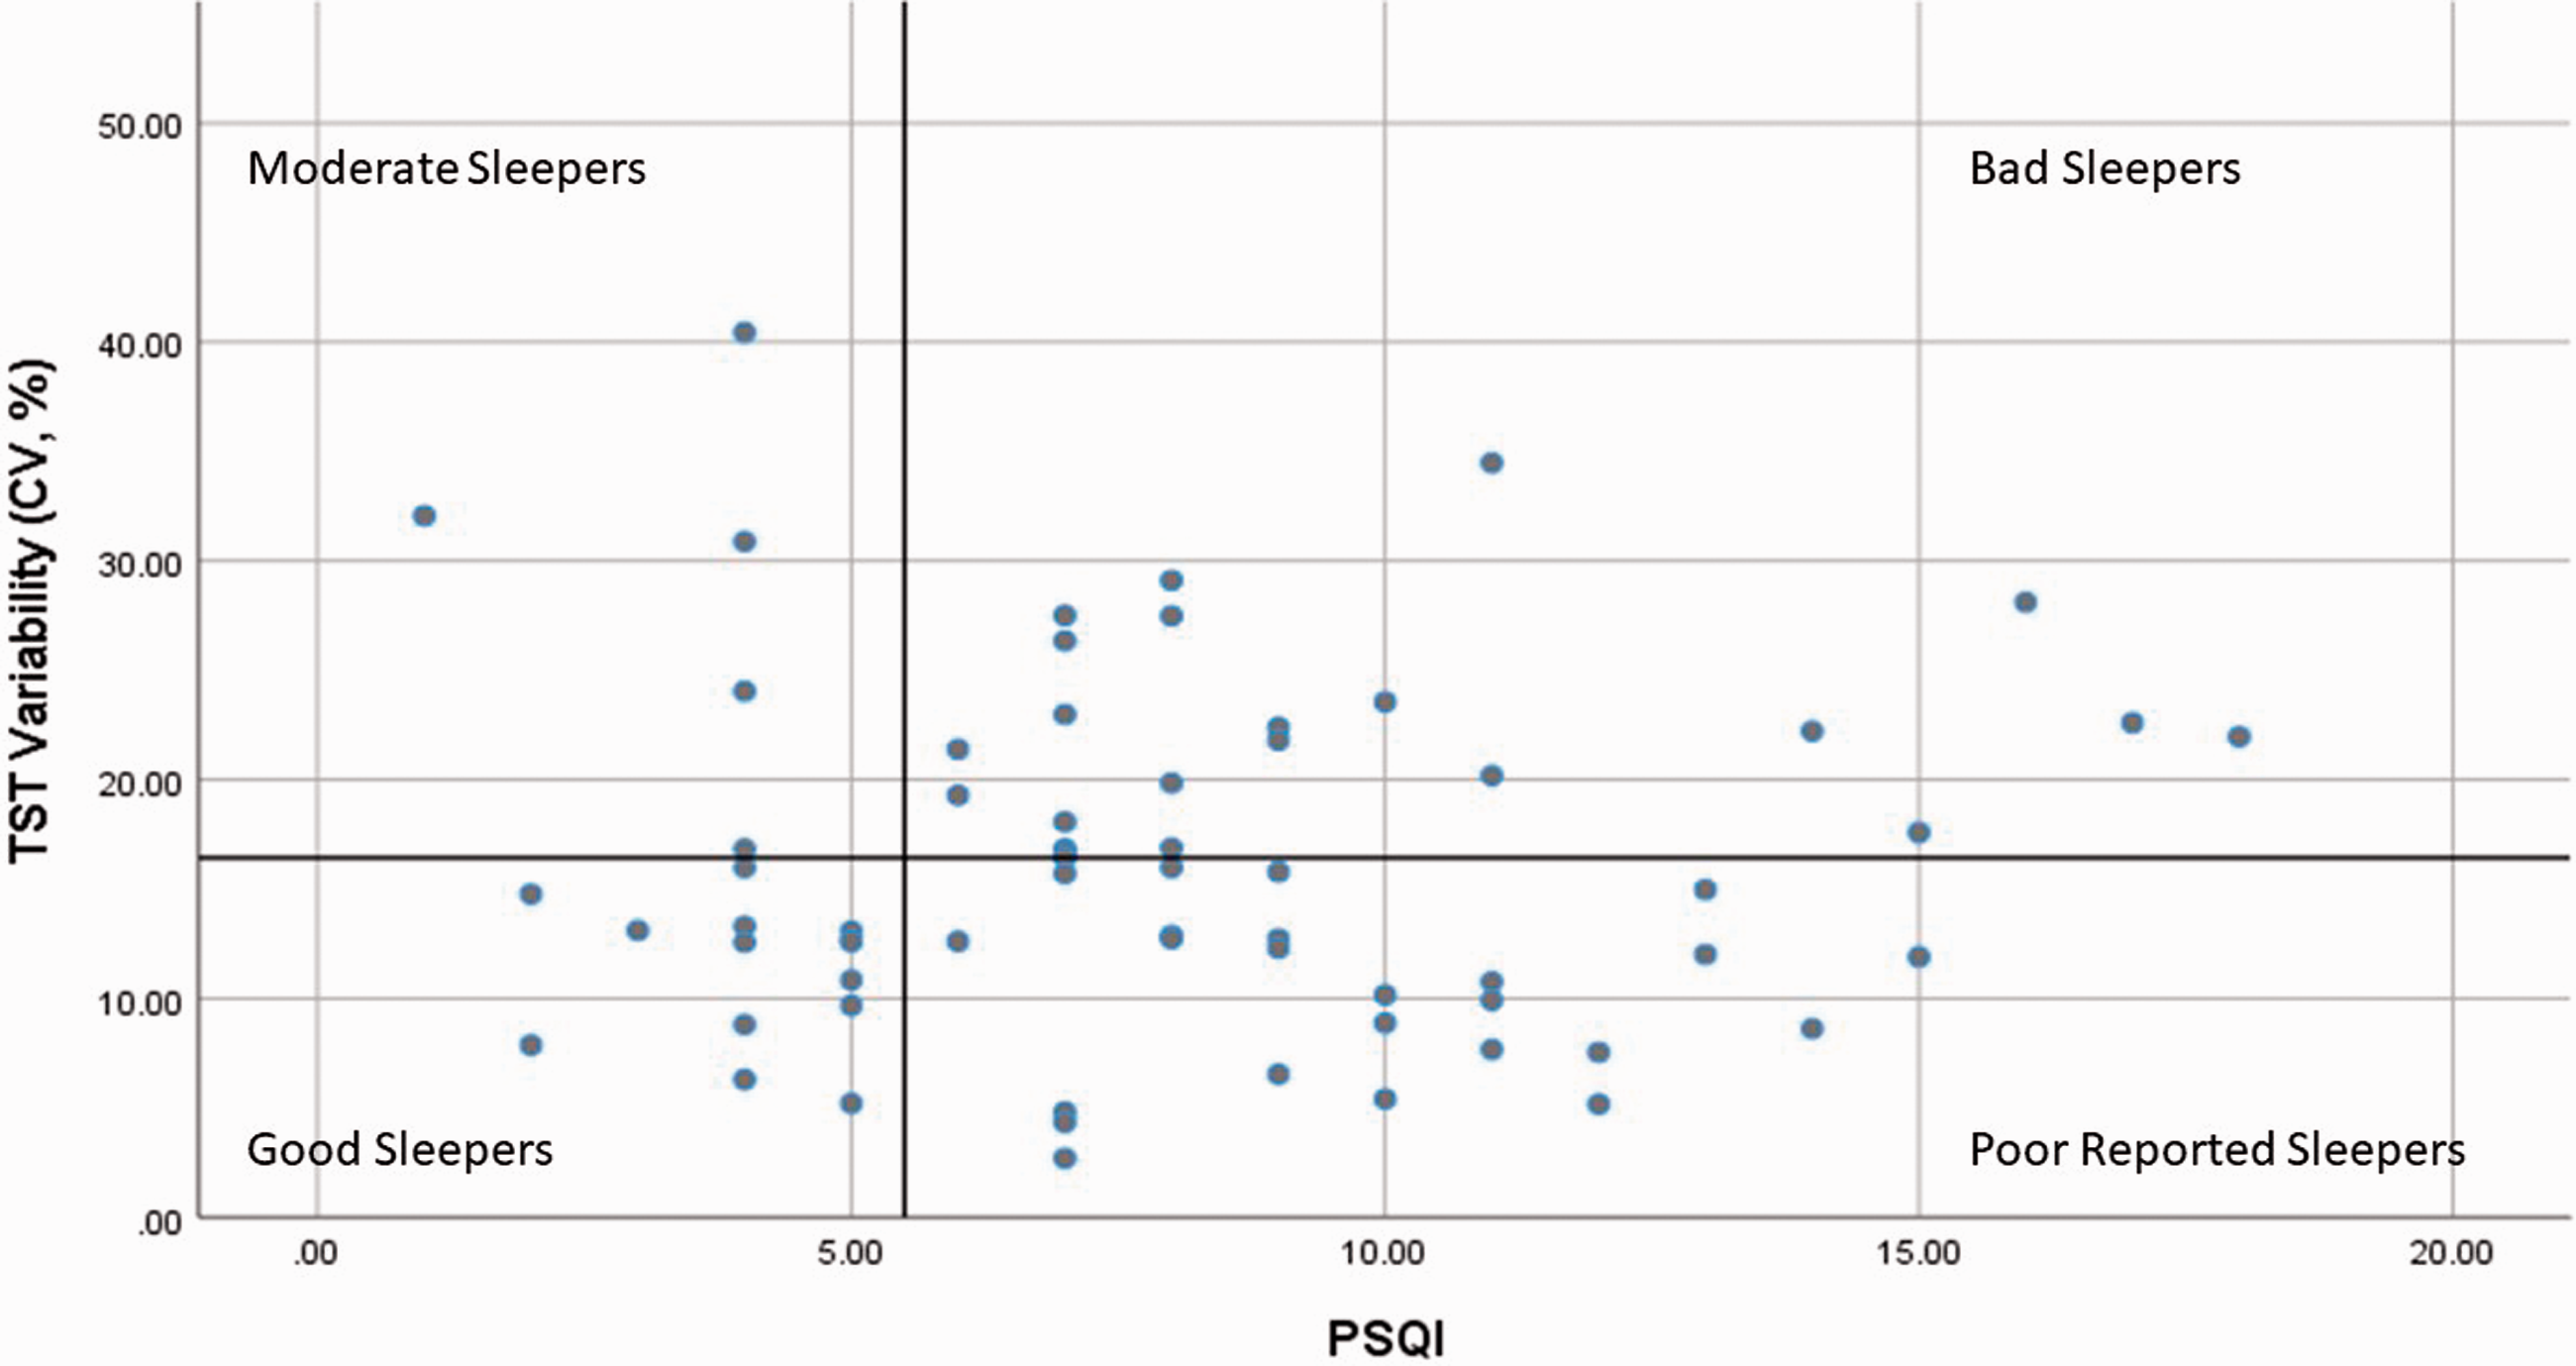
Participants were divided into four groups based on the Pittsburgh Sleep Quality Index (PSQI) (≤5 Good Sleep Quality; >5 Poor Sleep Quality) and on the mean of the coefficient of variance (CV) for total sleep time (TST) (<16.42 Low Sleep Variability; >16.01 High Sleep Variability).

Total sleep time variability across six nights for the four groups.
Demographic characteristics.

F: female; M: male; MMSE: Mini Mental Status Examination; PSQI: Pittsburgh Sleep Quality Index; RR: remitting–relapsing; SD: standard deviation; SP: secondary progressive; TST: total sleep time.
Data is reported as (mean±SD).
Bad Sleepers had significant higher total fatigue compared to Good Sleepers (p=0.003; Figure 3). For the MFIS sub-scales, there was no significant difference in physical fatigue between the groups (Figure 4), but the Bad Sleepers had a significantly higher level of cognitive fatigue and psychosocial fatigue compared to the Good Sleepers (p=0.002, Figure 5; and p=0.01, Figure 6, respectively). For anxiety, the Poor Reported Sleepers had a significantly higher level of state anxiety compared to the Good Sleepers (p=0.004; Figure 7). Poor Reported Sleepers and Bad Sleepers had a significantly higher level of trait anxiety compared to the Good Sleepers (p=0.001, p=0.007: Figure 8). The Poor Reported Sleepers had a significantly higher level of depression compared to Good Sleepers (p=0.002; Figure 9).

Total score of the Modified Fatigue Impact Scale (MFIS). Range of total score for MFIS is 0–84.

Physical component of the Modified Fatigue Impact Scale (MFIS); range 0–36.

Cognitive component of the Modified Fatigue Impact Scale (MFIS); range 0–40.
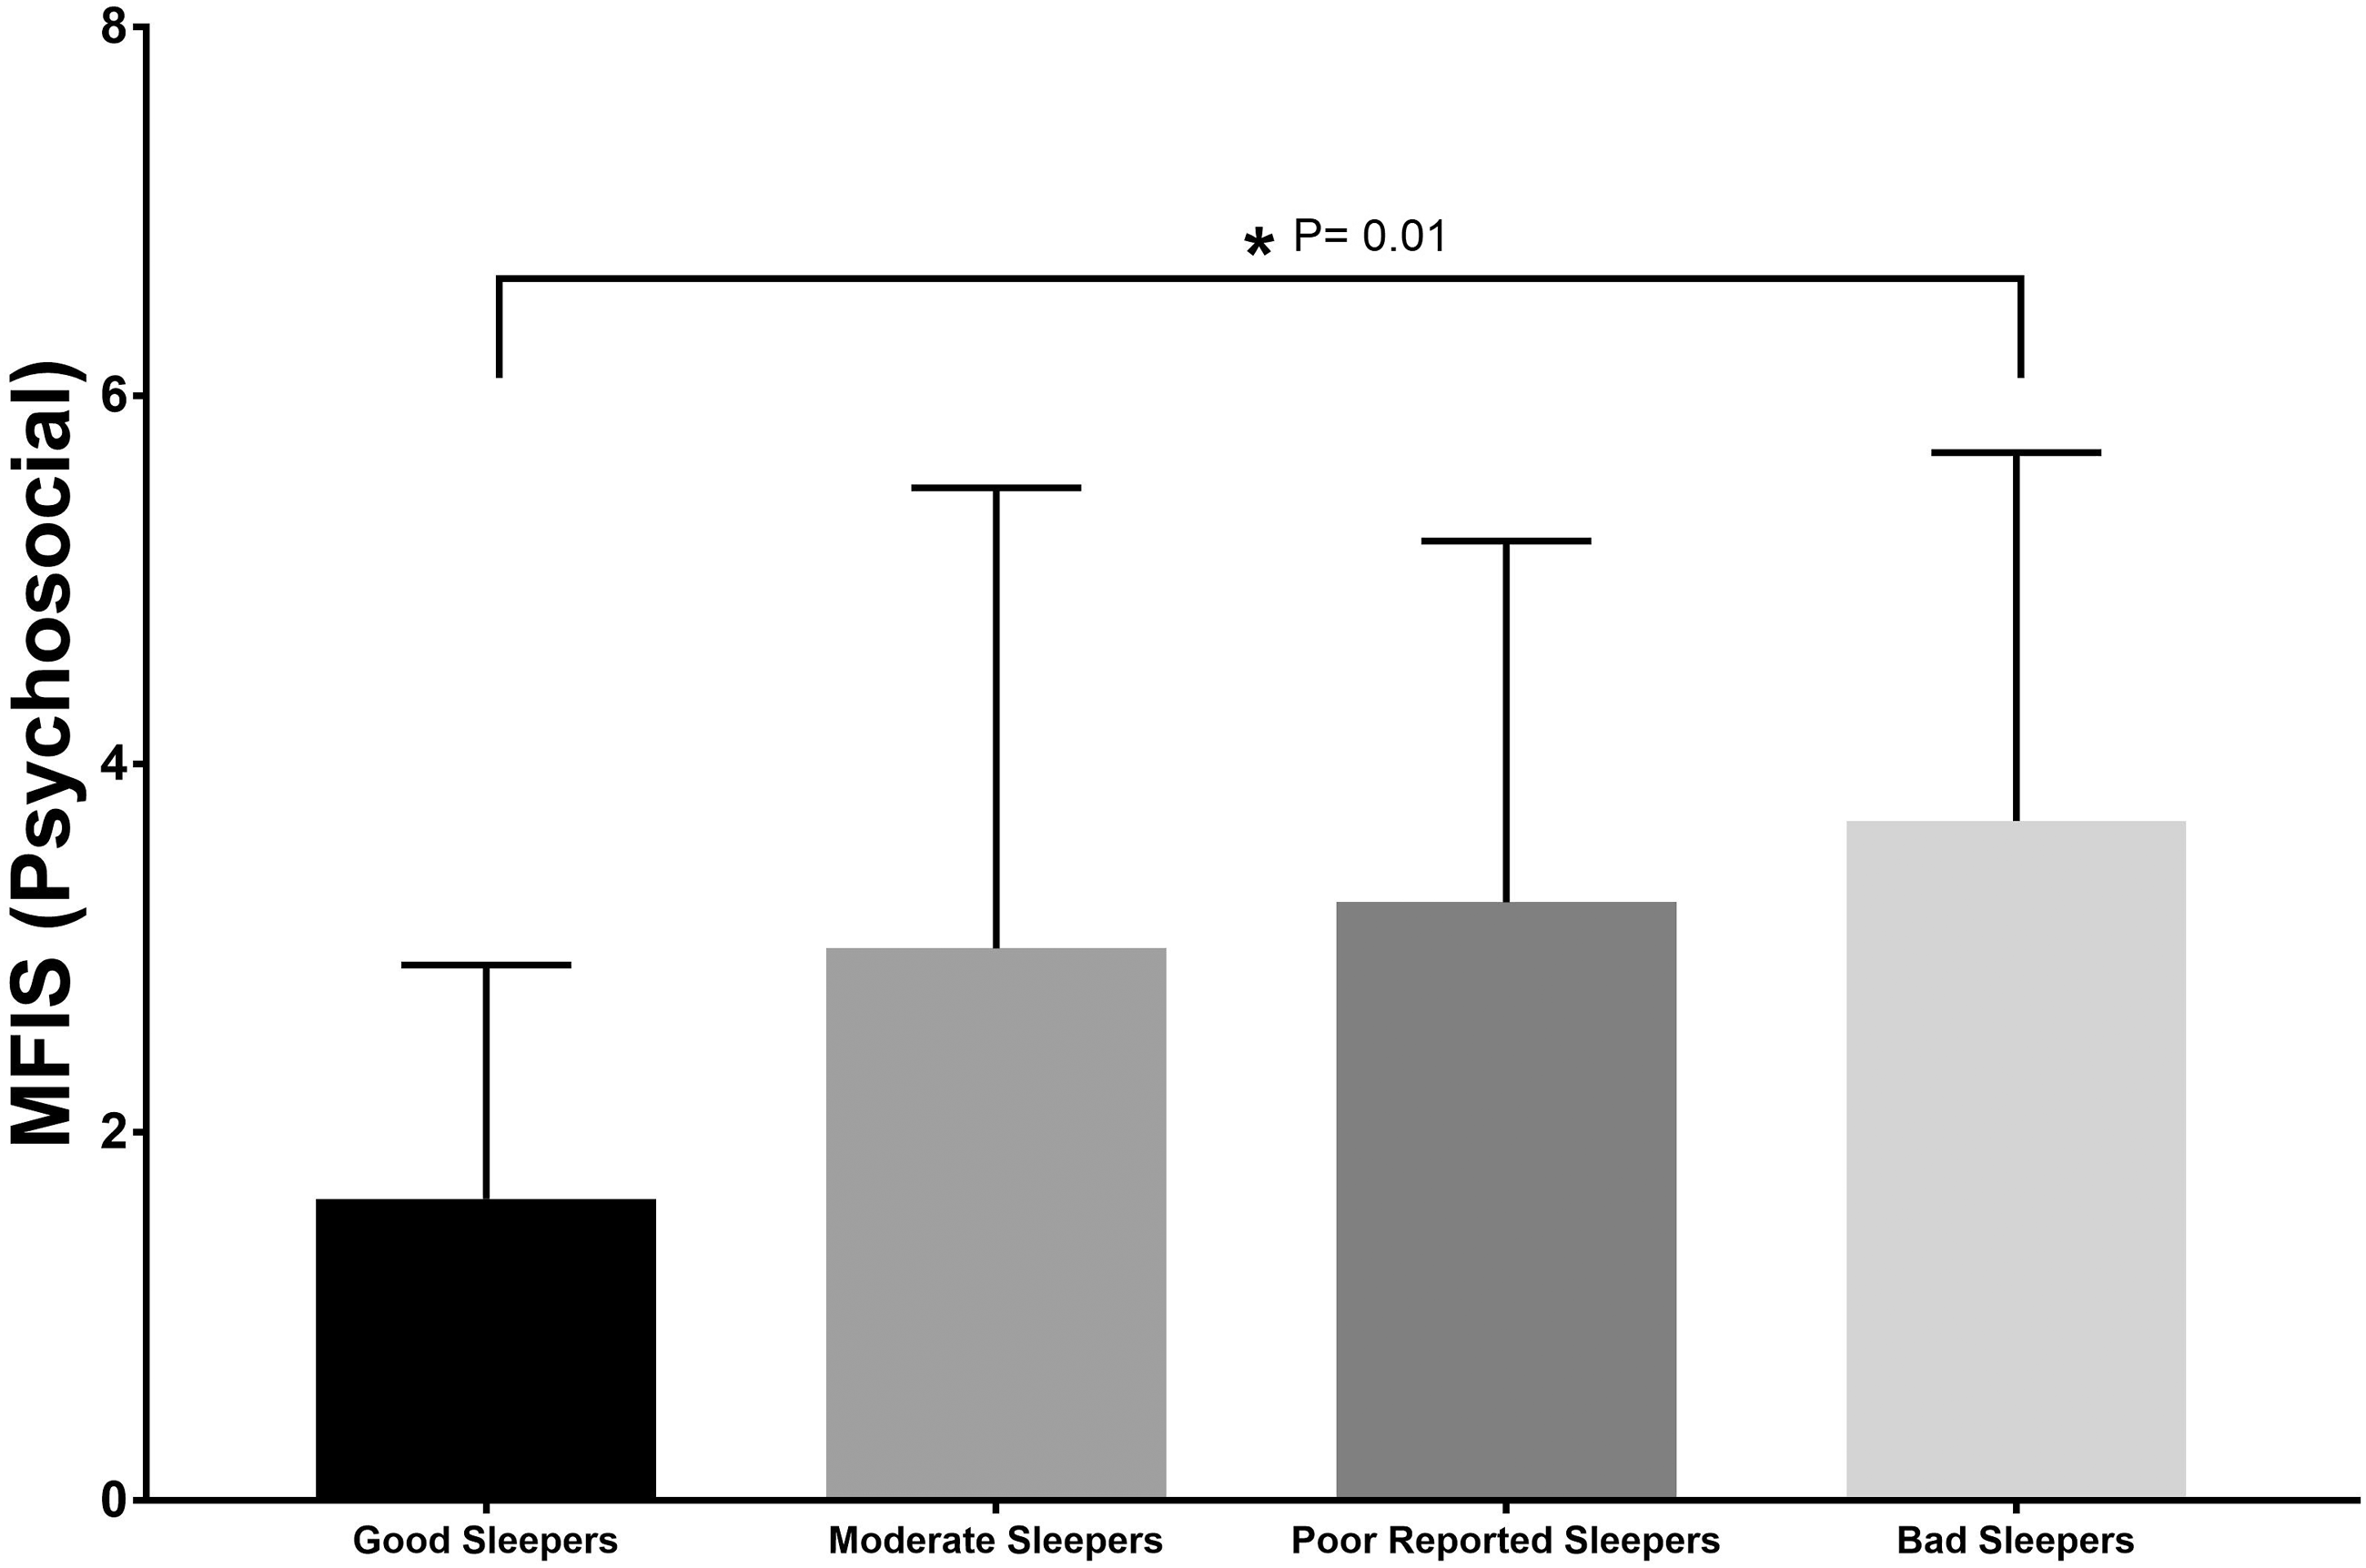
Psychosocial component of the Modified Fatigue Impact Scale (MFIS); range 0–8.

State component of the State Trait Anxiety Inventory (STAI); range 20–80.

Trait component of the State Trait Anxiety Inventory (STAI); range from 20–80.

Beck Depression Inventory-Fast Screen (BDI-FS); range 0–21.
Discussion
This is the first study to combine information about sleep variability gathered using actigraphy with self-report sleep quality to provide a clearer picture of how sleep issues are associated with fatigue, anxiety, and depression in individuals with MS. There were significant differences between the Good Sleepers and Bad Sleepers in overall fatigue, the fatigue subscales of cognitive and psychosocial fatigue, and in trait anxiety, and there were significant differences in state and trait anxiety and depression between the Good Sleepers and Poor Reported Sleepers. These results may indicate a difference in factors contributing to sleep disturbances in individuals with self-reported poor sleep quality with low versus high sleep variability. Adding sleep variability in combination with self-reported sleep quality may be useful to better tailor interventions aimed at improving sleep issues or these comorbid conditions.
In our study, 73% of the participants in this secondary analysis had poor sleep quality; 33% had poor self-reported sleep quality with low sleep variability and 40% had poor self-reported sleep quality with high sleep variability. These findings provide additional evidence that poor sleep quality is common in individuals with MS and supports findings from prior studies that reported 47–70% of individuals with MS experience poor sleep quality.1,2,10,34,35 Poor sleep quality has been associated with increased fatigue, fatigability, depression, and anxiety, and reduced physical and cognitive function and quality of life2,27,36,37 as well as increased risk of developing other chronic health conditions including cardiovascular disease, obesity, and diabetes. 16 Poor sleep quality has also been associated with an increased risk of an acute exacerbation of MS. 20 This high prevalence of sleep issues in people with MS and risk of health consequences warrants a concerted effort from the research and clinical community in collaboration with individuals with MS and other stakeholders to determine how to best address sleep disturbances and factors contributing to sleep disturbances and poorer sleep quality in individuals with MS.
Not surprising was the low number of participants (n=5; 7.57%) that had high self-reported sleep quality combined with high sleep variability (the Moderate Sleepers). It is presumed that individuals with high sleep variability would generally not consider their sleep quality to be good, and the low number of participants in this category seem to support this assumption. While the Moderate Sleepers outcome scores generally fell between the Good Sleepers and the Poor Reported Sleepers or Bad Sleepers, there were no significant differences in fatigue, anxiety, or depression between the Moderate Sleepers and the other sleep groups. This is possibly due to the limited number of participants in the Moderate Sleepers group. It is also possible that sleep variability is less important to the contribution of overall sleep quality than perception of sleep quality. This hypothesis is partially supported by a post-hoc analysis consisting of dividing participants into two groups based on TST variability alone (high variability, n=28 vs low variability, n=38) and examining group differences in anxiety, depression, and fatigue between these two groups. There were no statistically significant group differences in anxiety, depression, and fatigue when dividing the groups into high vs low variability, suggesting that TST variability combined with self-reported sleep quality is instrumental in considering the association of anxiety, depression, and fatigue with sleep quality.
Interestingly, there was variation in the factors that were different between the Good Sleepers and Bad Sleepers and between the Good Sleepers and Poor Reported Sleepers, suggesting that different factors may contribute to having self-reported poor sleep quality with low TST variability (Poor Reported Sleepers) and having self-report poor sleep quality with high TST variability (Bad Sleepers). There was a difference in state and trait anxiety and depression between the Good Sleepers and Poor Reported Sleepers whereas there was a difference in cognitive and psychological fatigue and trait anxiety between the Good Sleepers and the Bad Sleepers. The Poor Reported Sleepers had the highest score of state and trait anxiety and depression of all four groups, although not statistically different from the Bad Sleepers. We cannot determine whether poor sleep quality combined with low sleep variability contributes to anxiety and depression or if anxiety and depression contribute to these sleep characteristics. However, these results could indicate that state and trait anxiety and depression are larger influencing factors for people who have poor self-reported sleep quality and low TST variability. Evidence shows that sleep issues, depression, and anxiety are highly interrelated,38,39 and prior studies in people with MS have also shown poor sleep quality to be associated with anxiety and depression.37,40,41 The association between sleep disturbances, depression, and anxiety are likely due to several mechanisms, including alterations in neurotransmitter activity and hyperarousal of the areas of the brain involved in emotional regulation.39,42 It is interesting that fatigue was statistically higher only in the Bad Sleepers. While we cannot determine the direction of this association, perhaps high sleep variability contributes to fatigues in people with MS. Future studies are needed to determine these assertions.
These results do support that fatigue, anxiety, and depression should be assessed in individuals with MS who have poor self-reported sleep quality, and clinicians should consider that comorbid fatigue, anxiety, and depression may have an impact on self-reported sleep quality. Preliminary studies that have used cognitive behavioral therapy for insomnia offer promising results that treating insomnia symptoms may also improve fatigue, anxiety, and depression.43,44
There are several limitations to this study. As this was a secondary cross-sectional analysis, we are unable to determine if fatigue, depression, and anxiety contribute to the development of poor sleep quality or if poor sleep quality contribute to the development of those comorbid conditions. Longitudinal studies would be needed to determine the direction of these associations. Also, although individuals were excluded from participating in the parent studies if they had a known untreated sleep disorder, it is likely that at least some individuals had an unknown sleep disorder as more than 70% of individuals with MS screened positive for one or more sleep disorders in a large national survey. 7 Therefore, unknown and untreated sleep disorders may have contributed to these results. Also, while prior studies have assessed IIV using seven days/six nights of data, other studies have used 14 days or more worth of data to assess IIV. 21 It remains unclear how many nights of data is optimal for determining IIV. In addition, due to a large variation in methods to assess IIV, 21 there are no established norms for sleep variability so it is difficult to determine if the data reported in this study is high or low. Future studies are needed to ascertain which sleep outcome is optimal to assess sleep variability (i.e. total sleep time, sleep efficiency, sleep latency) and to determine norms for sleep variability.
Footnotes
Authors' Note
Mohammed Alshehri is also affiliated with Physical Therapy department at Jazan University, Saudi Arabia.
Acknowledgements
The authors wish to acknowledge Jared Bruce and Sharon Lynch for their helpful discussion with the authors regarding use of the sleep variability data. They also wish to acknowledge the authors and contributors to the two prior studies from which this data was collected.
Conflict of Interests
The author(s) declared no potential conflicts of interest with respect to the research, authorship, and/or publication of this article.
Funding
The author(s) disclosed receipt of the following financial support for the research, authorship, and/or publication of this article: A portion of this study was supported by a National Multiple Sclerosis Society Pilot Grant (PP2068) and by the National Institutes of Health Clinical and Translational Science Award Grant (UL1TR000001, formerly UL1RR033179), awarded to the University of Kansas Medical Center (KUMC) and internal funds pro-vided by the KUMC School of Health Professions and the Department of Physical Therapy and Rehabilitation Science awarded to CFS.