
Abstract
Objective
Using the topographical model of multiple sclerosis (MS) to evaluate a longitudinal cohort we (1) test the recapitulation hypothesis, positing that patients’ “disease topography” predicts the clinical pattern of disability accumulation; and (2) identify leading indicators of progression.
Methods
10 patients who transitioned from relapsing–remitting MS to secondary progressive MS (SPMS) were evaluated. Neurologic exams were analyzed from relapses, at time of SPMS diagnosis, and most recent visit. Functional systems (FS), location/laterality, and recovery were recorded. The pyramidal/motor system was the target FS assessing symptom laterality and severity at relapse and SPMS time-points. Each patient's clinical course was mapped using the topographical model software.
Results
Cohort was 80% female, age 31.6 ± 8.6 years at diagnosis, followed average 23.8 ± 8.8 years, mean 3.1 relapses before SPMS. 83.3 ± 0.2% of relapse symptoms were present at transition to SPMS, increasing to 91.0 ± 0.2% at most recent visit. This demonstrates concordance between the topographical distribution of relapse symptoms and deficits from subsequent progression. In the topographical model, progression became apparent 7.75 years earlier than SPMS was diagnosed in practice.
Conclusions
We demonstrate the model's utility in depicting patients' disease topography as the loci of clinical progression. This could allow for earlier recognition of progressive disease by identifying leading indicators of progression.
Introduction
Earlier identification of multiple sclerosis (MS) progression has significant implications for patient care. Initially created to describe phenotypically different clinical entities of the disease, the diagnostic categories of relapsing–remitting multiple sclerosis (RRMS) and secondary progressive multiple sclerosis (SPMS) have been widely used for trial design, regulatory approval and, importantly, therapeutic decisions. However, while relapsing and progressive processes contribute to MS disease course1,2 the relationship between them3,4 has not been fully characterized.2,3 These phenotypes focus on clinical manifestations captured by the Expanded Disability Status Scale (EDSS), and by design, they do not directly represent the totality of symptoms, relapse severity, and the pattern and manner of accumulation of disability. Furthermore, as we have previously shown in a long-term patient cohort, there is a delay in diagnostic and prognostic certainty in patients transitioning from RRMS to SPMS, 5 which reflects that there is often no definitive moment of change in diagnostic category. The phenotype categories dichotomize what is increasingly understood to be a continuous disease spectrum, 6 particularly taking into account pathological evidence of degeneration in early MS in some patients, 2 and the observation that accelerated brain atrophy begins early in the disease course. 7 It is hypothesized that the accelerated loss of brain volume is attended by a loss of the compensatory mechanisms that constitute neurological reserve, and that progression may become clinically apparent after reserve is depleted. On this basis, the topographical model of MS was proposed as a clinical manifestation framework, to provide a unified visualization of MS clinical course across the spectrum of relapsing and progressive forms of the disease. 8 In this paper, we conduct the first empirical application of the model to the patient cohort in which we originally demonstrated diagnostic uncertainty in the transition from RRMS to SPMS.
The topographical model provides a dynamic visualization of long-term disease course (Figure 1). Like other conceptual depictions of clinical course, this model remains agnostic to specific pathophysiological and cellular mechanisms of the disease, but rather it seeks to encapsulate the distinct clinical paradigm through which MS clinical course manifests. 9 The central nervous system (CNS) is visualized as a pool with increasing levels of depth, with the spinal cord and optic nerves at the shallow end, the brainstem and cerebellum with intermediate depth, and the cerebral hemispheres comprising the deep end. The depth of the water in this visual model corresponds with the degree of functional reserve intrinsic to these different regions of the CNS.

Visualization of the topographical model.
To depict disease activity, lesions rise as focal peaks emerging from the base of the pool; those that cross the surface of the water—the clinical threshold—cause demonstrable signs and symptoms of an MS relapse. Disease activity in the spinal cord and optic nerves, occurring in the shallow end, is predisposed to cause the hallmark clinical relapses of MS: symptoms referable to partial myelitis and optic neuritis. 9 In the model, relapse severity is indicated by the maximal height of a topographical peak and the degree of recovery is depicted as the extent to which the peak recedes back down toward the base of the pool, below the clinical threshold. Lesion localization yields the particular clinical symptoms and functional systems (FSs) affected. In this way, the model can be individualized to encapsulate a particular patient’s “disease topography”—the individual clinical pattern and severity of disease. 8
The topographical model operates not solely as a visual depiction, but rather posits that there is a distinct intersection between disease topography and the loss of functional reserve that drives MS clinical course. 9 The model depicts that as time passes and functional reserve (the water level) declines, progression clinically recapitulates a patient’s prior relapse symptoms, incrementally manifesting above the clinical threshold a patient’s underlying disease topography. 8 This “recapitulation hypothesis” proposes that a patient’s relapse signs/symptoms and underlying lesion localization could potentially foretell an individualized pattern of disability accumulation as reserve is lost and the disease progresses. This hypothesis is depicted in the model as topographical peaks, emerging above the clinical threshold both acutely upon initial formation (relapse), and later reappearing insidiously as the threshold itself declines and functional and structural resilience is lost (progression). 9 Progression is thus conceptualized as a dynamic clinical threshold, characterized by above- and below-threshold disease which, over time, declines to unmask a patient’s individual “disease topography.”
Further integrating two concepts into the conceptualization of clinical course may offer a more individualized and clinically nuanced depiction of disease course so as to allow for earlier, more precise identification of progression: first, the central concept of localization, which underlies much of the symptomatic and prognostic variability of the disease;10–12 and, second, the loss of functional reserve, as the primary driver for progressive accumulation of disability. 9 Earlier and more individualized identification of progression could have implications for MS care on several levels, from counseling patients about prognosis and evaluating the relative merits of changing disease-modifying therapies, 9 to determining who may be the best candidates for emerging trials and interventions focusing on remyelination and repair.
To pursue this goal, here we evaluate the recapitulation hypothesis, that a patient’s “disease topography” could, in essence, predict the clinical pattern of disability accumulation. We empirically study this theoretical model with clinical data from patients diagnosed with SPMS and with a known relapse/lesion history to demonstrate the extent to which the clinical manifestations of disability observed in the progressive stage of the disease recapitulate the symptoms of a patient’s prior relapses. We then render patient clinical course utilizing the topographical model disease simulation software to look for insidious reemergence of prior relapse symptoms that can serve as heralding the early signs—the leading indicator—of progression.
Methods
Patient inclusion criteria
We examined a subgroup of patients who transitioned from RRMS to SPMS from our longitudinal cohort followed by a single academic MS specialist; information about this cohort has been published previously. 5 We identified 14 patients who had visits with diagnostic uncertainty regarding the transition from RRMS to SPMS characterized by possible, but not definitive, progression, before SPMS was formally diagnosed. 5 Our aim, to assess if the topographical model could help identify SPMS earlier than occurs in clinical practice, was well served by patients for whom there was diagnostic uncertainty before SPMS was clearly manifest. We examined the records of those who had complete follow-up records available either in hard copy files or in the electronic medical record system. Ten of these patients from our long-term cohort had sufficient historical clinical documentation for inclusion in this study. The other four patients lacked sufficient historical detail to allow the early relapses to be characterized by FS and laterality as needed for the current study. The years that have passed since we first published on this longitudinal cohort afforded us a longer duration of follow-up from which to capture clinical data. Clinical records for each patient from initial diagnosis through August 2015 were analyzed.
Data collection
We divided each longitudinal patient case into two epochs: (1) RRMS before transition to SPMS, and (2) after SPMS diagnosis. Neurologic history and examinations were analyzed from all MS relapses during either the RRMS or SPMS epoch, again at the time of SPMS diagnosis, and finally at the most recent clinical visit through August 2015.
Affected FS (visual, brainstem, pyramidal, cerebellar, sensory, bowel/bladder, cerebral), location/laterality, relapse severity, and extent of recovery, were recorded for each neurologic exam evaluated. Relapse recovery was defined as follows: (1) Full recovery: no signs or symptoms noted by patient or physician; (2) Near complete recovery: complete symptom resolution noted by patient, with only subtle findings noted by physician on neurologic examination; (3) Partial recovery: symptom recovery noted by patient but still worse than pre-relapse level; (4): No recovery: same level or worsening severity of symptoms as at relapse time point. Relapse recovery was assessed at next available clinic visit at least 3 months from date of relapse.
The recapitulation hypothesis was tested by comparing the presence and laterality of prior relapse symptoms with those at the time of SPMS diagnosis, and again at most recent visit. Agreement was defined as presence of the same symptom (functional domain and laterality if applicable) at both the relapse and SPMS or final clinic visit. If a patient had bilateral symptoms at time of relapse, each side was considered its own symptom that could be in agreement with symptomology at SPMS or final visit. If a symptom had undefined laterality at the time of relapse, with laterality specified at SPMS or final clinic visit, we counted this as “agreement.”
Given its prognostic significance, 13 the pyramidal/motor system served as our target FS for assessment of laterality and severity of symptoms at relapse and SPMS time-points. Worsening of the pyramidal/motor symptoms, scored using Manual Muscle Testing (0–5 scale), was also compared at time of SPMS diagnosis and the most recent visit. This change exemplified continued progression in the pattern of a patient’s disease topography.
Clinical course visualization
The topographical model of MS is a clinical manifestation framework designed to run as a stand-alone iOS application for iPad (Apple Inc., Cupertino, CA), with custom disease-course simulation software. By varying five factors (relapse occurrence, severity, recovery, topographical distribution, the baseline level of reserve, and the rate of threshold decline), this software can generate millions of hypothetical disease-course depictions as rendered video files. This study is the first utilization of the topographical model to depict specific individual patients.
For 8 of the 10 patients who had sufficient historical data, clinical course was rendered using this custom disease-course simulation software. Figure 2 shows the disease-course simulation interface. Using this interface, lesions were plotted with variable frequency throughout disease course, divided in 1-year intervals. The topographical peaks were rendered in three sizes: large, medium, or small, corresponding to range of relapse severity. To depict a range of relapse/lesion recovery (the degree to which each topographical peak recedes below the threshold) each topographical peak’s recovery capacity was also selected at three levels: high, moderate, or low. Baseline reserve volume (the water level) was selected at three levels, and independently, the rate of depletion was also set at one of three rates: fast, moderate, and slow.

Disease-course simulation interface.
For each case, relapse symptoms, severity, recovery, and progression rate were time-matched to clinical course based on chart documentation. To plot clinical course in the topographical model software, we matched topographical peaks to their referable EDSS FS by lesion location and laterality, utilizing our previously presented Localization and Functional Systems map. 14 This map codifies our assumptions regarding localization as a determinant of clinical symptoms, and illustrates the set of approximations that allowed us to best map the placement of topographical peaks.
To account for the fact that lesions at different levels within the CNS can yield motor symptoms, the Localization and Functional Systems map in the model is designed to include “tracks” as laid out in Figure 2, such that motor symptoms can result from lesions in the motor pathways from the spinal cord, through the brainstem, and into the hemispheres. For the purposes of plotting these cases in the model, if brainstem signs were present, then the topographical peak was placed in the brainstem; if motor symptoms affected arm and leg without additional localizing features, it was placed in the cervical cord; and if such symptoms affected only the legs it was placed in the thoracic cord. These approximations were made on the basis of clinical course, noting that magnetic resonance images (MRIs) were not available for the vast majority of the early relapsing events. In select cases, we were able to consult available MRIs to confirm localization. In particular, in the case shown in Figure 3, the MRI was useful to confirm the presence of a brainstem lesion at the time of the 2005 relapse, and we highlight this lesion/topographical peak concordance.
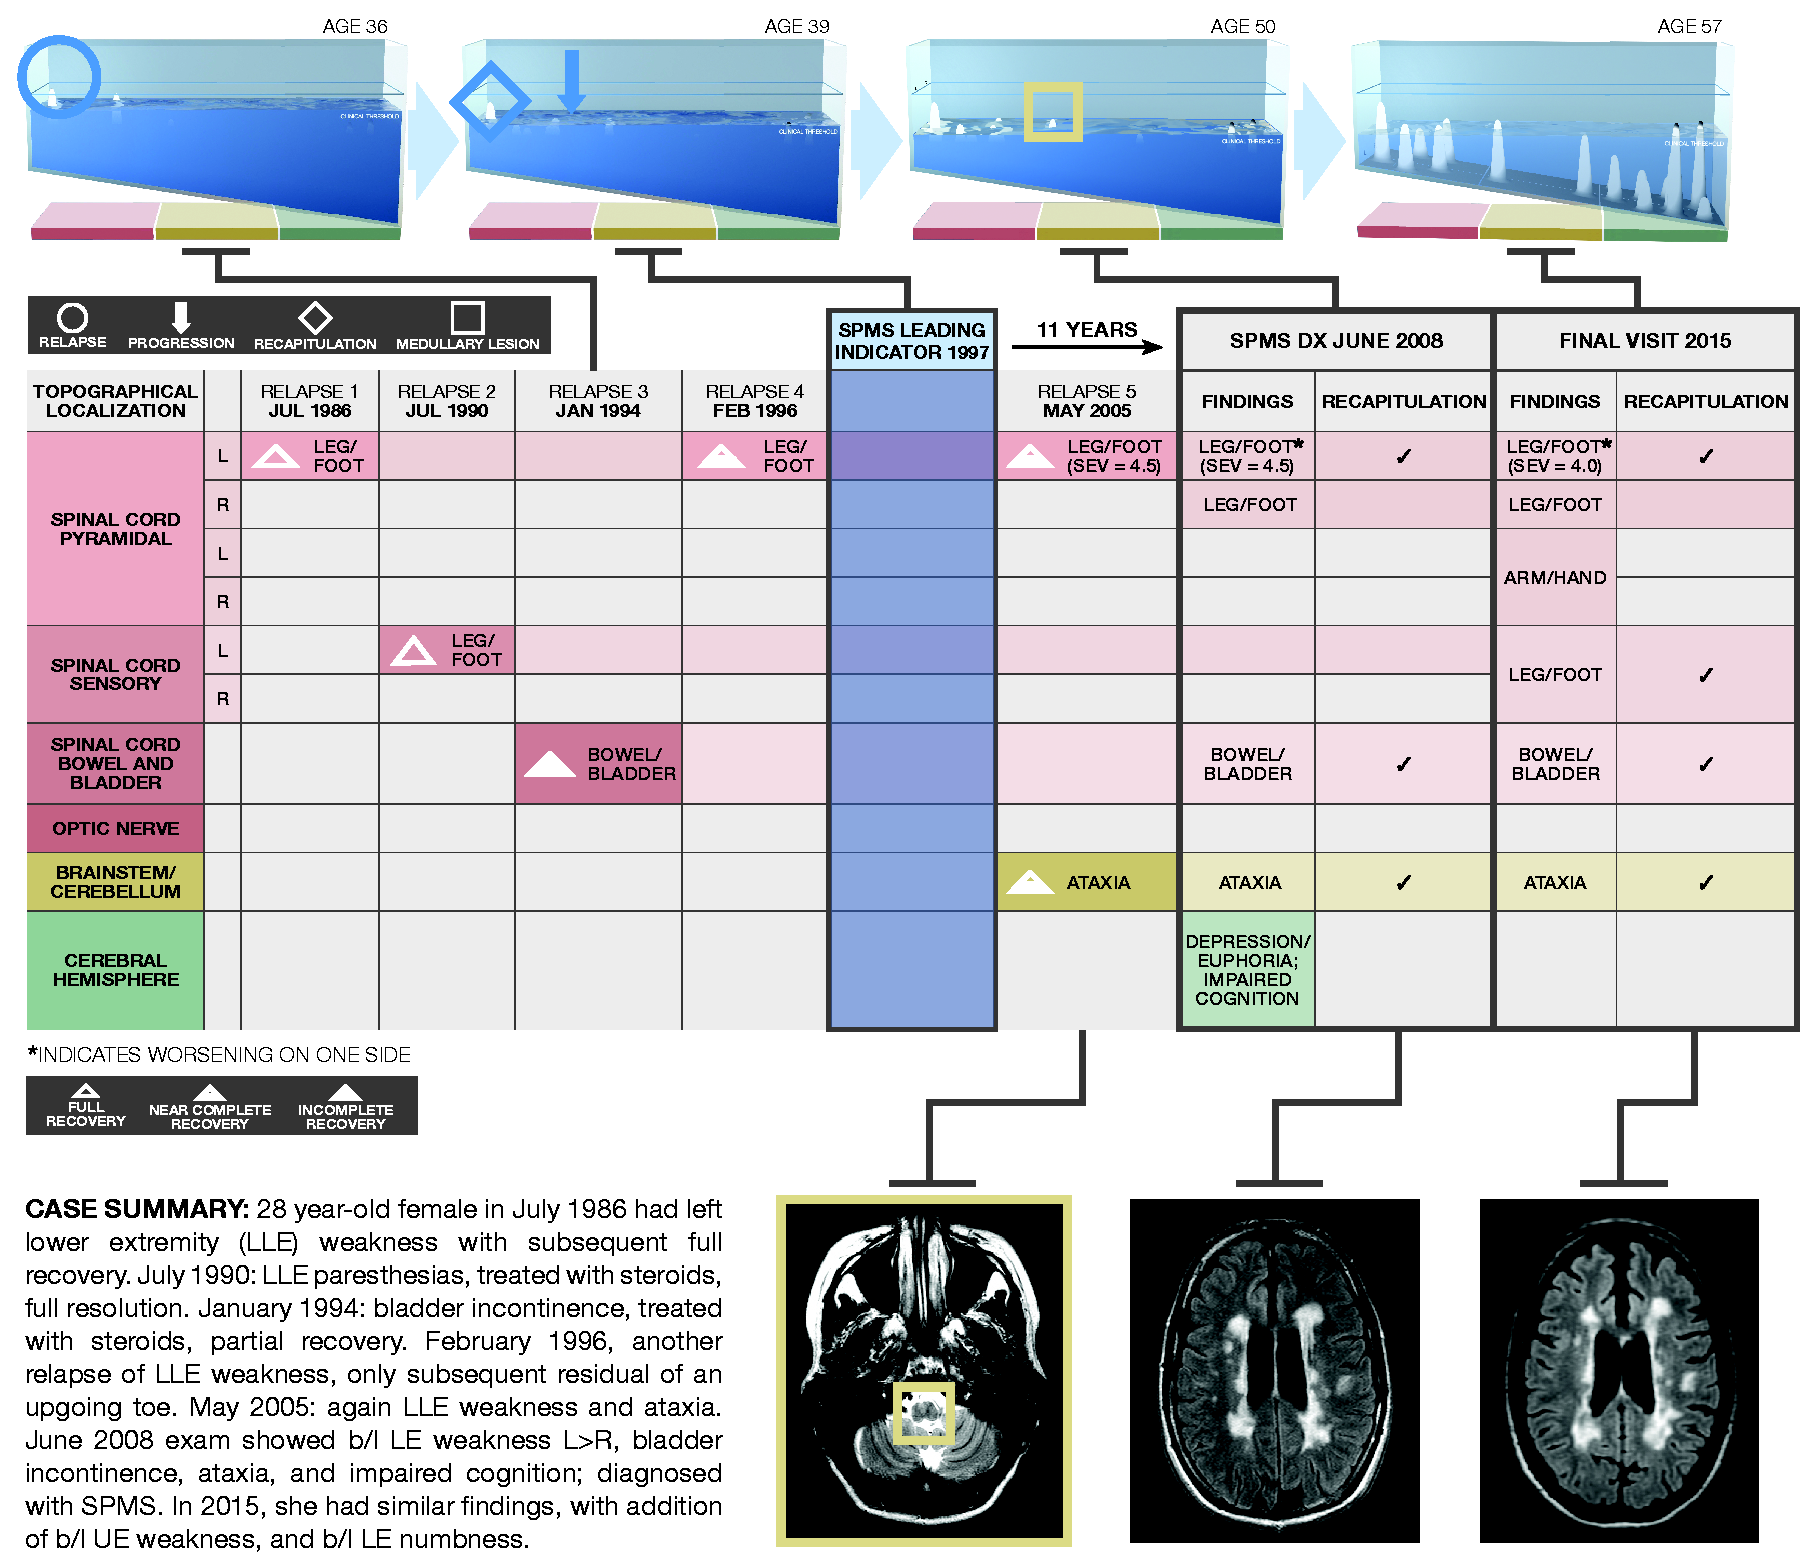
Depiction of an individual patient’s disease topography mapped utilizing the topographical model disease simulation software.
Once the relapse events/topographical peaks were placed in time and space in the model, we then could approximate reserve levels for each case in the disease-course simulation. Individualized reserve levels were necessary to ensure that each relapse occurrence, degree of recovery, and findings on the neurological exam at time of SPMS diagnosis matched the documented clinical history. In the model, the combined volume of above-threshold topographical peaks corresponds with the degree of accumulated disability. 8 For each case, we used the clinical features of above-threshold disability as documented at the most recent visit to benchmark the “end point” of depleted reserve in each simulation. We then worked backward from this end point by iteratively adjusting the level of baseline reserve (high, medium, or low) and the depletion rate (fast, medium, or slow) to establish the best-fit clinical trajectory for each case. To illustrate this process: once we approximated each case simulation, we tested the model by adjusting the reserve parameters. If for a given case we set baseline reserve too high, above-threshold progression did not become manifest over the course of the simulation. If we adjusted the reserve too low, relapses that were documented to have full recovery did not resolve below the threshold. In this way, we identified for each case the baseline level of reserve and the rate of threshold decline necessary to ensure that all clinical milestones in the simulation accurately corresponded with the clinical documentation.
The topographical model iOS application was used to output rendered video files depicting disease course. Congruent with the contemporary Lublin/Reingold definition of SPMS, 15 for each case we identified the gradual above-threshold emergence of topographical peaks as the leading indicator of progression.
Results
Ten patients from our long-term cohort followed by a single academic MS specialist had sufficient clinical documentation for inclusion in this pilot study. Our cohort was 80% female, with an average age of 31.6 ± 8.6 years at initial diagnosis. Patients were followed for an average of 23.8 ± 8.8 years, for a total of 238 patient-years of data reviewed. Patients experienced a mean of 3.1 relapses during the RRMS epoch. Duration of disease was 15.5 ± 8.5 years prior to SPMS classification, with a mean subsequent follow-up of 7.5 ± 2.6 years after SPMS diagnosis to most recent clinic visit recorded.
Relapse symptoms were categorized by FS, laterality, and topographical regions depicted in the model: spinal cord/optic nerve, brainstem/cerebellum, and cerebral hemispheres. Regarding the motor system, there were 11 instances of lower extremity weakness recorded during relapses, with 100% of these symptoms present at most recent visit matched by laterality; there were five instances of upper extremity weakness with 80% of these present at most recent visit matched by laterality. There were 12 such instances of sensory dysfunction in the lower extremities with 91.7% matched by laterality at most recent visit, and seven instances of sensory dysfunction in the upper extremities with 71.4% matched at most recent visit. There were seven instances of brainstem/cerebellar symptoms recorded during relapses, with 100% present at most recent visit. There were a small number of visual, cerebral, and bowel/bladder symptoms captured at relapsed time-points. In total, 83.3 ± 0.2% of prior acute relapse symptoms were noted at the time of SPMS diagnosis, and 91.0 ± 0.2% of symptoms were present at most recent subsequent clinical visit. These data demonstrate concordance between the topographical distribution of relapse symptoms and accumulated deficits from subsequent progression.
Based on the disease-course renderings mapped in the topographical model, above-threshold progressive disease became apparent an average of 7.75 years (range 4–16) earlier than the diagnosis of SPMS was applied in practice (Table 1). A representative case (Case A in Table 1) is depicted with associated neuroimaging utilizing the topographical model in Figure 3.
Duration of disease and time to onset of progression for each case.

Discussion
The topographical model of MS was designed to serve as a conceptual framework for depicting the clinical manifestation of MS disease course, and furthermore to set the stage for empirical research. 8 It has previously been used only to depict hypothetical disease-course archetypes. Here we employed patient-level data to evaluate this more clinically nuanced and individualized representation of disease course that might allow for earlier identification of progression in MS. These pilot data are the first empirical test of the recapitulation hypothesis, which posits that the accumulation of disability is the consequence of a progressive unmasking of underlying disease burden.
We first demonstrated the model's utility in depicting patients' disease topography as the loci of clinical progression. Indeed, the vast majority of relapse symptoms with associated laterality were present at the time of SPMS diagnosis and most recent visit. Our findings are congruent with studies that have shown that localization and severity of relapses, along with the extent of recovery, are important drivers of MS progression and future disability.9,16–20 These data support our hypothesis that progression clinically recapitulates prior relapse symptoms and unmasks previously clinically silent lesions.
We then utilized the recapitulation hypothesis to identify leading indicators of progression in individual patients to allow for targeted, earlier recognition of progressive disease. Using this model, we found leading evidence of progression emerging above the clinical threshold an average of 7.75 years earlier than when SPMS was clinically diagnosed. Thus, identifying a patient’s individual disease topography via this model allows for mapping of the particular pattern of disability accumulation and may offer an earlier window of understanding into a patient’s risk and pattern of progression. We found an increasing concordance of prior relapse symptoms with those of progression as time continued to pass after SPMS diagnosis. This is further congruent with the declining clinical threshold proposed by the model, and helps to visualize that the loss of reserve may be the principal driver of disability accumulation as MS progresses. 21 This pilot retrospective evaluation of the recapitulation hypothesis does not yet allow for prognostication claims at the individual patient level, which indeed will require prospective testing of the model using larger cohorts to refine it.
Recent work by Keegan and colleagues 22 has shown that motor progression may result from a single critically located lesion, most commonly located in the cervical spinal cord or at the cervico-medullary junction. As with the Keegan et al. work, our study also utilized corticospinal tract signs as a marker of continued progression, making use of the quantifiable nature and high salience of the motor FS in real-world clinical documentation. While the motor system is an apt one to test the recapitulation hypothesis, the topographical model suggests that a patient’s pattern of progression may not be limited to motor system dysfunction alone. Our results are congruent with natural history studies that have found that disease activity in the early years of disease impacted the later onset of progression and degree of future disability, 13 though our cohort is too small, and the early relapse data not sufficient, to formally replicate those studies here. That the specific clinical features of a patient’s disability progression could be mapped to lesion location may be an important missing piece in our ability to model and predict disease course. 23 While prospective validation of this model will be needed before it can be used to predict onset of progressive symptomatology in practice, the findings of our pilot study suggest that particular attention should be paid to patients’ disease topography as put forth by this model, and that clinicians should be particularly alert for motor worsening that reflects prior relapses as potentially heralding SPMS.
Limitations and future directions
Though limited by its small sample size, retrospective design, and single-provider patient group, this pilot study suggests that there may be opportunities to identify early evidence of MS progression. While our analyses were performed on a small population, the use of a cohort of patients followed for over 20 years with sufficient clinical documentation was essential to test the hypothesis in question. Although this particular group of patients may not be representative of the broader MS population, these patients can be particularly instructive regarding the recapitulation hypothesis. This study is also limited by data obtained through chart review, which may not capture all symptoms and does not use quantified assessment scales. In addition, some patient histories dated back to the pre-MRI era; in future studies, pairing this model with detailed MRI datasets could allow localization of disease topography to be visualized and imaging metrics of reserve to be evaluated. 24
This initial evaluation of the recapitulation hypothesis, which was based on clinical events, was not designed to demonstrate the extent to which progression unmasks clinically silent lesions, which would require MRI data to elucidate. Based on the results of this pilot study, larger-scale testing of this model would entail examination of both relapse history (with formal EDSS and FS scores) and lesion location (via quantified MRI acquired longitudinally) during early RRMS and later-stage progressive disease in a large, well-characterized patient cohort.
Operationalizing this model will require identification of precise clinical and imaging metrics for each parameter and appropriate weighting of these variables to correspond to clinical course. For example, “reserve” as employed in the simulation model remains a theoretical construct, and outstanding questions remain regarding how best to estimate reserve in practice, be it through global measures (e.g. total gray matter volume) or metrics specific to a given function (cortical thickness in primary sensorimotor areas, fractional anisotropy within the corticospinal tract). 9 The ultimate goal is the development of an empirically validated model of disease course that can be used for individual prognostication and as a therapeutic guide. We plan future empirical refinement of this model using large clinical cohorts to further evaluate this hypothesis.
Footnotes
Acknowledgements
The authors wish to acknowledge Dr. Aaron E. Miller for oversight of the original dataset and clinical input; Dr. Fred D. Lublin for mentorship and collaboration; Colleen Farrell for data collection; John Panagis and Bayron Mejia for figure design; Erik Gorka for application coding and software development; Scott DeNino for work on model visualization and design; and the Harrison and Star MS Working Group for pro bono collaboration on the model.
Conflicts of Interests
The author(s) declared no potential conflicts of interest with respect to the research, authorship, and/or publication of this article.
Funding
The author(s) received no financial support for the research, authorship, and/or publication of this article.
Disclosures
S.C. Krieger has received compensation for consulting and advisory board work with Acorda Therapeutics, Bayer HealthCare, Biogen, Celgene, EMD Serono, Genentech, Genzyme, Mallinckrodt, Novartis, and Teva, and has given non-promotional lectures for Biogen. K. Cook and M. Fletcher were employees of Harrison and Star, LLC, a healthcare communications company which provided services for this project on a pro bono basis. B.M. Laitman has nothing to disclose.