
Abstract
Background
Although predicting future brain volume loss (BVL) in patients with multiple sclerosis (MS) is important, studies have shown only a few biomarkers that can predict BVL.
Objectives
The aim of this study is to elucidate the association between longitudinal BVL and serum biomarker candidates.
Methods
This single-center, retrospective, observational study intended to cover MS patients during January 2008 to March 2016. Patients who underwent brain MRI two times at intervals of >24 months and had a blood test to measure biomarker candidates at the time or within three months of the MRI scan were included. Evaluation of brain volume was performed by using SIENAX and SIENA in the FMRIB software library.
Results
Twenty-three patients with MS were included in this study. We found that serum retinol binding protein (RBP) levels were significantly correlated with percentage brain volume change (PBVC) (p = 0.0079). Furthermore, best subset selection of multiple linear regression models identified baseline normalized brain volume and serum RBP as the best predictors of PBVC.
Conclusions
Our study shows that lower serum retinol levels are associated with greater longitudinal BVL and that serum RBP and can be a predictor of BVL.
Introduction
Recently, brain magnetic resonance imaging (MRI) has emerged as an effective tool for evaluating disease activity in patients with multiple sclerosis (MS), as a meta-analysis showed that MRI lesions could be a surrogate for relapses. 1 However, conventional MRI findings, including T2-lesion volume or gadolinium (Gd)-enhanced lesion count, do not correlate well with long-term development of disability in patients with MS, 2 which led to research focused on brain atrophy recognized as an end point of irreversible tissue loss. 3 Brain atrophy was demonstrated to be closely correlated with disability.4–6 Furthermore, studies have focused on brain atrophy since a meta-analysis revealed that the treatment effect on brain atrophy correlates with the treatment effect on disability in MS. 7 In addition, the annual rate of brain volume loss was similar among clinically isolated syndrome, relapsing–remitting MS, secondary progressive MS, and primary progressive MS, suggesting that brain volume loss starts and is evident even in the earliest stage of MS. 8 Therefore, evaluating longitudinal brain volume loss is greatly helpful for predicting disease outcome in patients with MS. Considering that brain volume loss itself is the result of a disease process, predicting future brain volume loss is important.
What can be the predictive factors of brain volume loss in patients with MS? The study from the phase III trial of fingolimod showed that the best predictors of brain volume loss were MRI characteristics, including T2-lesion volume, Gd-enhanced lesion count, and T1-hypointense lesion volume. 9 However, these MRI parameters explained <50% of the total variability in brain volume loss between individual patients, 9 suggesting that other predictors, including serum biomarkers, are needed for a more accurate prediction. Studies showed that several body fluid biomarkers could be associated with disease activity and severity in patients with MS.10,11 Serum uric acid (UA) levels decreased in patients with clinical activity in comparison with those with inactivity; 12 higher 25-hydroxyvitamin D (25(OH)D) levels were associated with less T2-lesion volume accumulation over time but not with rate of brain volume loss; 13 and serum retinol levels are shown to be associated with MRI activity, including Gd-enhanced and T2 lesions. 14 On the other hand, only a few body fluid biomarkers can predict brain volume loss, including immunoglobulin M (IgM) oligoclonal bands, 15 cerebrospinal fluid (CSF) neurofilament heavy chain level, 16 and albumin quotient. 17
Here, we investigated whether several body fluid markers, including UA, 25(OH)D, and retinol levels, were associated with longitudinal brain volume loss in patients with MS.
Patients and methods
Patients
This single-center, retrospective, observational study intended to include patients with MS who attended Musashino Red Cross Hospital in Tokyo, Japan, during the period from January 2008 to March 2016. MS was diagnosed in accordance with the McDonald 2010 criteria. The inclusion criteria were as follows: (1) patients who underwent a brain MRI scan two times at an interval of >24 months and (2) patients who had a blood test at the time or within three months after the MRI scan. Patients with neuromyelitis optica spectrum disorders were excluded.
MRI scan
All MRI scans were acquired at the Musashino Red Cross Hospital by using a 1.5-T Signa HDxt (GE Healthcare, Milwaukee, WI, USA) and a similar MRI protocol. Conventional T1-weighted gradient-echo images (repetition time (TR)/echo time (TE) of 11.9/3.5 ms, 256 × 192 matrix, one signal average, 220-mm field of view, 19–42 slices of 3- to 6-mm thickness, and axial orientation) used for the brain volume analysis were acquired from each participant. Fluid-attenuated inversion recovery images (TR/TE of 9200/120 ms, 320 × 192 matrix, 220-mm field of view, 19–42 slices of 3- to 6-mm thickness, and axial orientation) were also obtained for the T2-lesion volume analysis. All MRI scans were performed a minimum of three months following steroid administration.
Analysis of brain volume
Cross-sectional evaluation of baseline normalized brain volume (NBV) and gray matter volume (GMV) was performed by using SIENAX in the FMRIB software library (FSL; http://www.fmrib.ox.ac.uk/fsl), with Lin4Neuro, a customized Linux distribution. 18 Percentage brain volume change (PBVC), i.e. the longitudinal change in NBV, was analyzed by using SIENA, which is also part of FSL, with Lin4Neuro. T2-lesion volume was evaluated by using free software SepINRIA (http://www-sop.inria.fr/asclepios/software/SepINRIA/).
Measuring serum biomarkers
Blood samples were obtained from patients at the time of MRI scan or within three months. Routine blood examination was performed, including UA level. In addition, retinol binding protein (RBP) levels and 25(OH)D levels were evaluated by using a latex immunity measuring method and double antibody radioimmunoassay, respectively (SRL, Japan).
Statistical analysis
We performed statistical analysis by using R version 3.0.2. We used Welch’s t test to compare serial data between different patient groups. Categorical data were compared by using Mann-Whitney U test or Fisher’s exact test. Pearson’s product-moment correlation coefficient was used to assess the relationship between two approximately normally distributed continuous variables, including age, disease duration, annualized relapse ratio, and MRI variables. Point biserial correlation coefficient was used between continuous and categorical variables with two levels, including sex and disease-modifying therapy. Spearman’s rank-order correlation coefficient was used between two continuous variables, one of which is not normally distributed, such as Expanded Disability Status Scale (EDSS) score. A multiple linear regression model to predict BVL was developed by using best subset selection in accordance with Akaike’s information criterion.
Results
Clinical and demographic characteristics of study patients.

EDSS: Expanded Disability Status Scale; ARR: annualized relapse ratio; DMT: disease-modifying therapy; MS: multiple sclerosis; NBV: normalized brain volume; NCGMVC: normalized cortical gray matter volume; T2LV: T2-lesion volume; PBVC: percentage brain volume change; 25(OH)D: 25-hydroxyvitamin D; RBP: retinol binding protein.
Correlation between baseline MRI variables and clinical parameters.
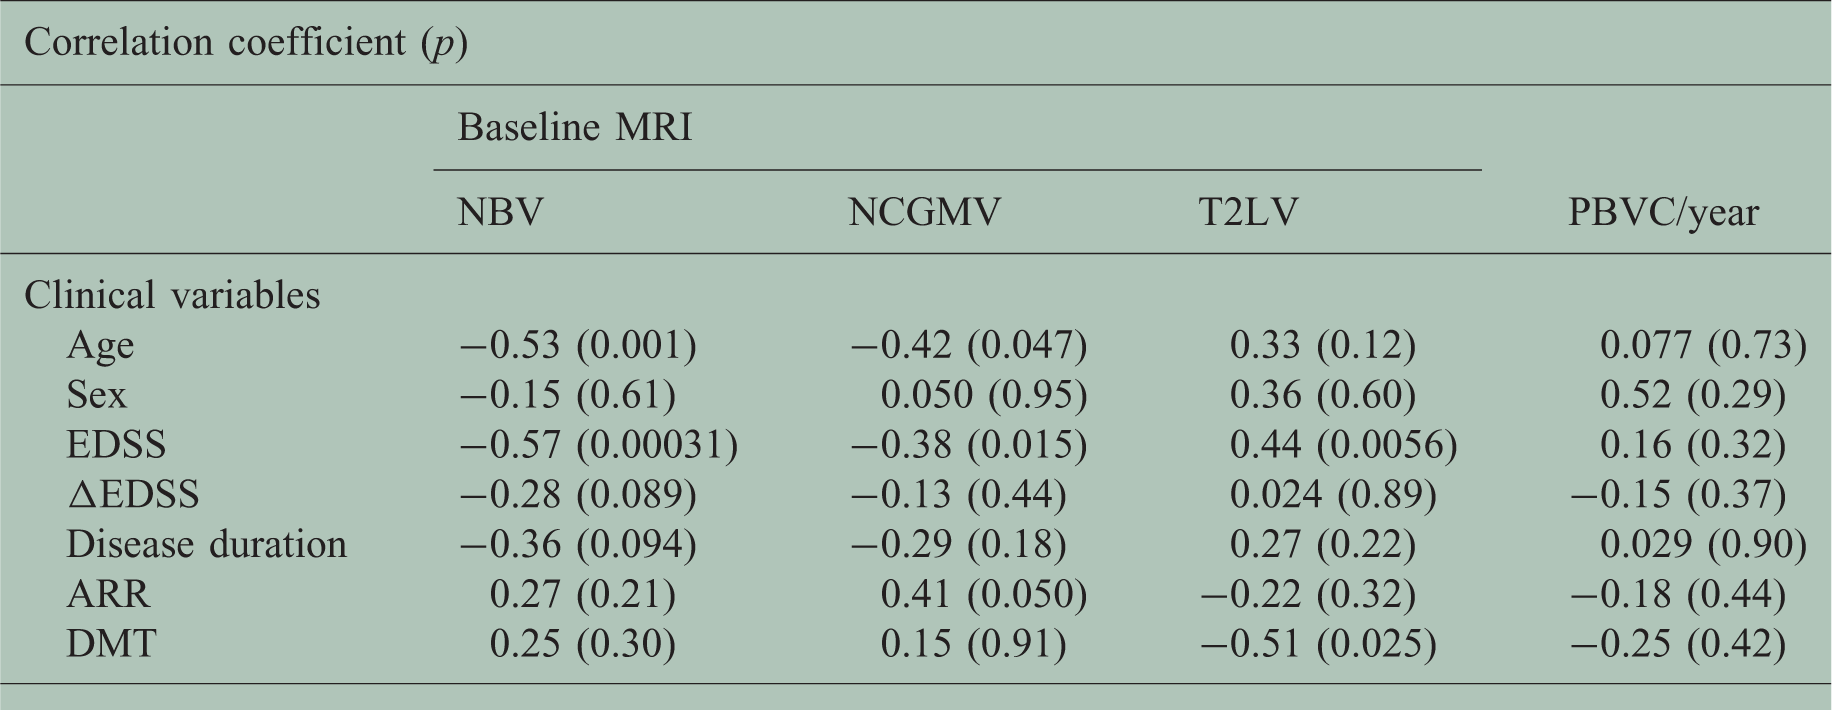
Pearson’s product-moment correlation coefficient was used to assess the relationship between age, disease duration r ARR and MRI variables; point biserial correlation coefficient was used between sex or DMT and MRI variables; Spearman’s rank-order correlation coefficient was used between EDSS or delta EDSS and MRI variables.
MRI: magnetic resonance imaging; NBV: normalized brain volume; NCGMV: normalized cortical gray matter volume; T2LV: T2-lesion volume; PBVC: percentage brain volume change; ARR: annualized relapse ratio; DMT: disease-modifying therapy.

Correlation between brain volume loss and serum retinol levels. Annualized percentage brain volume change (PBVC) significantly correlates with serum retinol binding protein (RBP) levels (Pearson’s r = –0.54, p = 0.0079).
Correlation between MRI variables associated with brain atrophy and clinical variables.

Pearson’s product-moment correlation coefficient was used to assess the relationship between serum biomarkers nd MRI variables.
MRI: magnetic resonance imaging; NBV: normalized brain volume; NCGMV: normalized cortical gray matter volume; T2LV: T2-lesion volume; PBVC: percentage brain volume change; UA: uric acid, 25(OH)D: 25-hydroxyvitamin D; RBP: retinol binding protein.
Multiple linear regression analysis of clinical variables associated with brain volume loss.

NBV: normalized brain volume; RBP: retinol binding protein.
Discussion
In this study, we confirmed that NBV and NCGMV correlated with EDSS score as previously described,4–6 suggesting that evaluating brain volume is critically important in clinical practice for MS. In addition, we showed for the first time a significant correlation between serum RBP level and PBVC; lower serum RBP levels were associated with lower PBVC, suggesting that lower serum retinol levels might result in higher brain volume loss. Thus, based on the close correlation between EDSS score and brain volume, serum RBP levels might be associated with the disability of patients with MS.
Evaluating brain volume in addition to scoring EDSS and conventional MRI is essential for the clinical practice of MS because EDSS is inadequate to evaluate disease status and to predict disease outcome 19 and we need to predict disability outcome before EDSS score has worsened. Conventional MRI is an effective tool for evaluating disease but is incomplete because Gd-enhanced lesion count was not a strong predictor of long-term disability 20 and correlation between T2-lesion volume and disability is only weak to modest and showed a plateauing effect on T2-lesion burden with higher EDSS score.21,22 In addition, demyelinating cortical gray matter lesions, which were thought to account for 26% of whole demyelinating brain lesions, are difficult to detect on conventional MRI. 23 Even the more sensitive MRI acquisition technique double inversion recovery missed approximately 80% of the gray matter lesions observed on microscopy. 24 Against this background, the idea of evaluating brain volume loss has developed to be an important end point of irreversible tissue loss. 3 Brain volume loss in the first two years predicted an EDSS score of ≥6 at the eight-year follow-up, but EDSS score did not change, 25 suggesting that brain volume loss is more sensitive than change in EDSS score, which tends to be too low in the short term to recognize significant worsening. However, patient disability might still worsen during evaluation of brain volume loss because it takes >1 year to avoid the influence of pseudoatrophy. 26 Therefore, additional biomarkers that predict brain volume loss are needed.
Importantly, MS is mainly recognized as an immune-mediated disease. 27 Retinol is known to play a crucial role in the maintenance of the immune system, including the balance of the T-helper 17 (Th17)/regulatory T cell (Treg) axis,28,29 T-cell trafficking especially to the gut,30,31 and the properties of the blood-brain barrier (BBB). 32 All-trans retinoic acid inhibits the differentiation of Th17 cells by binding to the RARa sequence to downregulate RORgt and enhance the expression of Foxp3+ T cells. 33 Retinol was demonstrated to ameliorate experimental autoimmune encephalomyelitis (EAE) through reduction of Th17 cells. 34 In humans, serum retinol levels in patients with MS were lower than those in healthy controls35,36 and vitamin A supplementation significantly decreased interleukin (IL)-17 and RORgt expression levels in peripheral blood mononuclear cells but increased Foxp3 expression level.37,38 Retinol was also shown to improve the disease course of EAE shifting to Th2. 39 A recent study showed that IL-4-dependent production of retinol metabolite, retinoic acid produced by dendritic cells, induced gut-homing receptors on Th17 cells and ameliorated EAE by diverting migration of the Th17 cells away from the central nervous system to the gut. 31 It is interesting that retinoic acid enhanced BBB properties in an in vitro model using human pluripotent stem cell-derived brain microvascular endothelial cells, 32 which suggests that retinoic acid could block cell trafficking through the BBB. These observations suggest that retinol can have beneficial immunological effects on the activity of MS and support our idea that lower serum retinol levels are associated with greater brain volume loss that results in a more severe disability in the future.
The limitations of this study include its retrospective nature, small sample size, and lack of a control group. In addition, the non-standardized slice thickness of the MRIs (3–6 mm) may have reduced the accuracy of the image analysis. However, we confirmed that the PBVCs calculated from the T1-weighted images with 3 mm thickness (Figure 2) were similar to those from the three-dimensional-T1-weighted images with 1 mm thickness (n = 3, p = 0.796). Additionally, it has previously been shown that slice thickness does not systematically affect SIENA measurement.
40
Although we found good correlation between serum RBP levels and the rate of brain volume loss, the primary determinant of brain volume loss is not clear. Prospective studies that use larger samples with a standardized MRI protocol are warranted to confirm our results.
Baseline (left), and two years following baseline (middle) T1-weighted magnetic resonance imaging of a 35-year-old woman. Although atrophy progression was unremarkable, SIENA analysis (right) showed a −3.15% reduction in brain volume. Blue dots represent “atrophy” changes whereas orange/yellow dots represent “growth” changes.
In conclusion, serum RBP levels were associated with brain volume loss in patients with MS in this study, and lower RBP levels could suggest higher volume loss that correlated with greater disability.
Footnotes
Conflicts of interest
The author(s) declared no potential conflicts of interest with respect to the research, authorship, and/or publication of this article.
Funding
The author(s) received no financial support for the research, authorship, and/or publication of this article.