
Abstract
Purpose
South Korea is expected to become a super-aged society at the fastest rate among all Organization for Economic Co-operation and Development nations. Such a society can become a burden on primary healthcare, resulting in an increasing prevalence of chronic diseases, including hypertension (HYP). However, studies on the prevalence of HYP in older adults are lacking. This study aimed to construct an optimized performance machine learning (ML) model to assess HYP risk and identify associated risk factors among older adults in Korea.
Materials and methods
This cross-sectional study included 3214 participants aged ≥65 years who were enrolled in the “Maeum Juchieui” program in Seoul, Korea. Depression, stress, anxiety, basal metabolic rate, oxygen saturation, heartrate, and average daily step count were measured using a digital device via a smartphone app. HYP, diabetes, hyperlipidemia, chronic obstructive pulmonary disease, body fat percentage, and body muscle percentage were also measured.
Results
Of the five ML models, the Random Forest model exhibited the best performance. Hyperlipidemia, diabetes, basal metabolic rate, body muscle percentage, body fat percentage, average daily step count, stress, heartrate, and depression influenced HYP among older adults.
Conclusion
The findings indicate that health programs implemented by the Korean government for older adults that are directly or indirectly associated with HYP risk factors can have a positive effect on reducing HYP. Furthermore, the South Korean government must monitor policy-based programs for chronic diseases among older adults to ensure that such programs can be applied to those residing in vulnerable areas.
Introduction
Global life expectancy has been increasing owing to advances in medical technology, which has led to the acceleration of population ageing worldwide to the point where older adults are predicted to account for 16% of the total global population by 2050. 1 In particular, South Korea is expected to enter a super-aged society at the fastest rate among all Organization for Economic Co-operation and Development nations. 2 This demographic shift is expected to increase the burden on primary healthcare systems, including rising medical expenditures and shortages in healthcare personnel.
Hypertension (HYP) is one of the most significant chronic diseases affecting older adults in Korea. According to the Korean Society of HYP, over 60% of adults aged ≥70 years have HYP. 3 The prevalence of HYP among older adults is the highest among all age groups in Korea—8.5 times higher than that among those aged 30–39 years and 3.5 times higher than that of those aged 40–49 years. In particular, the HYP-associated mortality rate among older adults is a serious problem, as it is approximately 117 times higher than the general mortality rate. 4 HYP is a major risk factor for cardiovascular disease, which is associated with various factors, including genetic, environmental, and complicating factors with other diseases that have combined negative effects on health. 5 Moreover, HYP is closely linked to various physical (e.g. obesity, muscle mass, basal metabolic rate) and mental health factors (e.g. stress, depression, anxiety).6–9
The Ministry of Health and Welfare of South Korea is currently pursuing a project to prolong a healthy life and reduce the burden of medical costs by establishing a continuous and comprehensive HYP management system through a community-based chronic disease management program in primary healthcare. In particular, the project aimed to increase HYP awareness and screening rates by providing regular health screening and health education to older adults and increasing the treatment rate. Nonetheless, most older adults continue to face limitations in utilizing applicable national policies, owing to problems with accessibility to healthcare and information. 10 Therefore, improving accessibility to services provided to older adults to prevent various diseases, including chronic diseases, is also a social issue.
The South Korean government conducts national health screening for its citizens twice a year in addition to physical function tests, mental examinations, and lifestyle tests for older adults. This health screening also investigates the factors associated with HYP. Accordingly, studies on the prediction of HYP risks have been actively conducted, and those published in the past three years have continued to expand the research models to increase their accuracy.11–15 However, studies on the prevalence of HYP among older adults are lacking.
Although the Korean government initiated various policies and projects for older adults, the programs in the projects are not concentrated and are comprised sporadically. Therefore, it is necessary to identify policies focused on sectors that are effective in preventing HYP among older adults. Currently, data prediction technologies include machine learning (ML) and deep learning. In particular, technologies for predicting optimized models based on the analysis of various ML models have been published, leading to active studies on the prediction of various diseases and their use as strategies for prevention education.
This study aimed to construct an optimized performance model for predicting HYP risk and risk factors among older adults in Korea aged ≥65 years. Furthermore, the findings of this study may serve as evidence for HYP prevention projects for older adults in Korea.
Materials and methods
Research design
This cross-sectional study was conducted between January and December 2023. This study was approved by the Institutional Review Board (IRB) of Yonsei University (No. 1041849-202401-SB-021-01), ensuring that all research activities were conducted in accordance with the relevant ethical standards and guidelines. Informed consent was obtained from all participants.
Data collection
The participants in the present study consisted of older adults aged ≥65 years who lived in Seoul and were enrolled in the “Maeum Juchieui” program. The participants had installed “Gosufit” (https://play.google.com/store/apps/details?id=com.healthbridge.hfact20&pcampaignid=web_share), an application developed by Health Bridge Company (Korea), on their smartphones. Depression, stress, anxiety, BMR, oxygen saturation, heart rate (HR), and average daily step count were measured using a digital device through the application, and the measured data were saved on a server. Moreover, HYP, diabetes, hyperlipidemia, COPD, body fat percentage, and body muscle percentage were measured by a nurse at a senior center who acted as a health coordinator. A total of 3214 older adults participated in the study between January and October 2023. However, 712 participants with missing responses, 421 who dropped out, and 168 with data loss were excluded. Accordingly, 1913 participants were included in the final analysis. All participants provided written informed consent prior to their enrollment in the study, in accordance with the approval granted by the IRB.
Instruments
Two questionnaires were used to collect data from the participants. In the first step, the participants installed the “Maeum Juchieui” application on their smartphones. In the second step, the health coordinator interviewed the participants and measured their HYP, diabetes, hyperlipidemia, COPD, BMR, body fat percentage, and body muscle percentage. Table 1 presents the factors used in this study. The target variable, HYP, was coded as 1 for individuals who had been diagnosed with HYP by a physician at a medical institution, and 0 for those without such a diagnosis. Health information was measured using a mobile medical device, while PTSD, stress, anxiety, and depression were assessed using a psychological counseling survey tool (see Supplemental Files 1 and 2). These indicators were selected based on a review of previous studies on risk factors for HYP and consultations with a professor of family medicine. 16
Research instrument.

BMR: basal metabolic rate; COPD: chronic obstructive pulmonary disease; HYP: hypertension; OS: oxygen saturation; PTSD: posttraumatic stress disorder.
Statistical analysis
Data preprocessing
In the preprocessing, observations with missing values were first removed to ensure data quality and analytical validity, resulting in 1913 eligible participants from the original 3214 respondents. After this initial exclusion, any remaining minor missing values were handled using median imputation, which is a robust method that reduces the influence of outliers and preserves the central tendency of the data. In addition, the dataset was examined for potential class imbalance. Although no substantial imbalance was identified, feature scaling was implemented to ensure that all variables contributed proportionally to the ML models. Because the dataset did not contain extreme outliers and exhibited a relatively uniform distribution across features, standardization (standard scaling) was selected as the primary normalization technique to achieve consistent model convergence and improve computational stability.
Feature selection
Feature selection (FS) is also known as variable or subset selection in ML. The present study used the Boruta-based FS method (FSM), which is a wrapper-based FSM that uses the Random Forest (RF) classification algorithm. This method improves model performance by recognizing features (variables) that do not affect model generation more than those created by the replacement extraction of existing features (shadow features) as features with low values. We selected the Boruta method because it is a robust and conservative FS approach that identifies all relevant variables while minimizing the risk of excluding potentially important predictors. In comparison with other embedded or filter-based methods, Boruta provides greater stability and is particularly suitable for datasets where complex, nonlinear interactions may exist. 17
Ml algorithms
Random Forest
RF is an ensemble learning method mostly used for classification and regression. It operates by constructing multiple decision trees during training and outputs a class (classification) or an average prediction mode (regression). A random decision forest corrects the overfitting habit of decision trees in the training sets.
Gradient boosting model
The gradient boosting model (GBM) is an ML technique used in regression and classification problems that generates a prediction model as an ensemble of weak prediction models (generally decision trees). Similar to other boosting methods, it constructs models in a stage-wise manner and generalizes them by optimizing an arbitrary differentiable loss function.
Light GBM
Light GBM (LGBM) is a gradient boosting framework that uses tree-based learning algorithm. It is designed to be distributed and efficient based on its strengths such as faster training speed, higher efficiency, lower memory usage, and better accuracy. The LGBM is capable of handling large-scale data and demonstrates comparable performance while using many functions and data points.
X GBM
X GBM (XGBM) is a tree-based ensemble learning algorithm and a model that overcomes the overfitting regularization problem and slow execution speed of GBM. This model is capable of cross-validation and can process missing values independently.
K-nearest neighbors
K-nearest neighbors (KNNs) is a simple, versatile, and easy-to-implement supervised ML algorithm that can be used for both classification and regression. It classifies data points based on the classification of their neighbors. KNN stores all available cases and uses a majority vote of k-neighbors to classify a new case. Cases assigned to a class are the most common among the kNNs, as measured by a distance function.
Data partition for training and testing
The data were differentiated into a 70% training set and 30% testing set, for which a stratified sampling procedure was used. 18
To further ensure model robustness and minimize potential overfitting, an additional k-fold cross-validation procedure (k = 5) was applied during model training. This approach allowed the models to be repeatedly trained and validated across multiple data partitions, providing a more reliable estimation of generalization performance.
Performance evaluation criteria
The performance of the ML models was tested based on accuracy, precision, recall, F-score, and area under the receiver operating characteristic curve (AUC). The evaluation criteria were based on four scales and calculated using a confusion matrix with four measures. The confusion matrix uses the actual class and predicts the class to divide it into positive or negative for evaluating the classification models and can be defined as shown in Additional File 3.
Accuracy
Accuracy indicated the percentage of data that was correctly predicted among all predictions for the HYP risk group. In other words, it measured how accurately the HYP risk group was predicted. The mathematical formula for the accuracy is defined as follows:
Precision
Precision indicated the percentage of actual positive samples among cases that were predicted to be positive by the ML model. In other words, it refers to the percentage of the actual HYP risk group relative to that of the predicted HYP risk group. The mathematical formula for precision is as follows: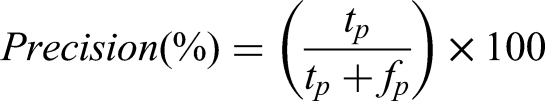
Recall
The recall shows the percentage of the HYP risk group predicted by the ML models relative to the actual HYP risk group. In other words, it was the percentage predicted to show the risk group among the actual HYP risk group. The mathematical formula is as follows:
F1 score
The F1 score represents the harmonic mean of precision and recall. The mathematical formula is as follows: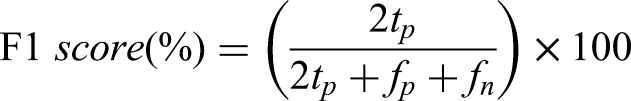
Area under the receiver operating characteristic curve
An AUC refers to the area under the receiver operating characteristic curve, which is used to evaluate the performance of binary classification models, and an AUC value closer to 1 indicates better model performance.
Model interpretability
Shapley additive explanations (SHAP) is a method used to interpret the predictions of ML models and was designed based on a game theory called the Shapley value. SHAP was first introduced by Lundberg and Lee and enables the interpretation of predictions and identification of the relative importance of features.
19
Moreover, it helps to understand which features have a greater influence on model prediction, as well as the process of improving or deciding models.
Results
Respondent information
The participants included older adults aged ≥65 years. Data from 1913 participants were used in this study, including 1002 (52.3%) in the HYP group and 911 (47.7%) in the non-HYP group (Table 2). The number of older adults with diabetes and HYP was 346 (34.5%) and the number of those without diabetes and HYP was 802 (88%), showing a statistically significant difference (t = 134.0, p < .001). The number of older adults with hyperlipidemia and HYP was 767 (67.3%), and that of those without hyperlipidemia and HYP was 539 (59.2%), showing a statistically significant difference (t = 252.6, p < .001). Moreover, older adults with HYP showed significantly higher depression scores (M = 20.63) than those without HYP (M = 18.32;
Participants’ characteristics.

BMR: basal metabolic rate; COPD: chronic obstructive pulmonary disease; HR: heartrate; HYP: hypertension; OS: oxygen saturation; PTSD: posttraumatic stress disorder; SD: standard deviation.
* p < .05, ** p < .01, ***p < .001.
Risk factor selection using Boruta
The importance of the features was selected using Boruta-based FSM (Figure 1). Using this method, the features were selected in the order of hyperlipidemia, BMR, body fat percentage, body muscle percentage, average daily step count, HR, stress, depression, PTSD, and oxygen saturation. These features were used as ML features to predict HYP.

Risk factor selection using the Boruta-based feature selection method. BMR: basal metabolic rate; HR: heartrate; OS: oxygen saturation; PTSD: posttraumatic stress disorder.
Performance comparison of ML models
The performances of the five ML models used in this study were compared and analyzed based on accuracy, precision, recall, F1 score, and AUC. To further evaluate the robustness of the models and reduce the risk of overfitting, a five-fold cross-validation procedure was additionally conducted during model training. The RF model showed stable predictive performance across folds, achieving a mean AUC of approximately 0.91 with minimal variation, indicating strong generalization ability. The results showed that the model with the best performance was RF, followed in order by LGBM, XGBM, GBM, and KNN (Table 3, Figure 2). Of these, RF had a high prediction performance with an accuracy of 91.11, precision of 90.58, recall of 92.69, F1 score of 91.62, and AUC of 91.03.

Receiver operating characteristic curves and precision versus recall curves of four predictive models. AUC: area under the receiver operating characteristic curve.
Performance of the ML models.

AUC: area under the receiver operating characteristic curve; GBM: gradient boosting model; KNN: k-nearest neighbors; LGBM: light gradient boosting model; ML: machine learning; RF: Random Forest; XGBM: X gradient boosting model.
Interpretable HYP risk factors
The SHAP analysis was performed using the RF model, which was confirmed to have the best prediction performance for HYP. SHAP analysis was used to determine the importance of each feature and whether the features had a positive or negative influence on HYP (Figure 3). SHAP values appearing in red indicated a high influence on HYP prediction, whereas those in blue indicated a greater influence on non-HYP prediction. The results showed that with hyperlipidemia (red), SHAP values were positive, indicating a higher influence on HYP prediction. In contrast, when hyperlipidemia was low (blue), the influence on non-HYP prediction was high. With diabetes (red), the influence on HYP was greater, but the distribution of SHAP values was wider than those without diabetes (blue). In addition, SHAP values indicating an influence on HYP were clearly higher with higher BMR, lower body muscle percentage, lower body fat percentage, lower average daily step count, higher HR, and depression.

Importance of risk factors based on SHAP values. BMR: basal metabolic rate; COPD: chronic obstructive pulmonary disease; HR: heartrate; OS: oxygen saturation; PTSD: posttraumatic stress disorder; SHAP: Shapley additive explanations.
Discussion
In the present study, five ML-based algorithms were used to analyze the prediction of HYP risk among Korean older adults aged ≥65 years.
Among the ML-based algorithms used in this study, RF was found to exhibit the best performance. Compared with existing studies that used ML for HYP risk, a study from Canada on 18,322 individuals used five models—Cox proportional hazards model, least absolute shrinkage and selection operator, elastic net, random survival forest, and GBM—and measured the performance based on concordance index. 20 Because this was a survival analysis study, the concordance index was used to derive the accuracy of predicting the survival period with consideration of mortality. In contrast, the present study analyzed predictions for binomial distribution based on the presence or absence of HYP, and accuracy, precision, recall, F1 score, and AUC were used accordingly.
Other studies have determined the performance of ML for the prediction of HYP using the same method. Pratiwi used four algorithms (decision tree, RF, GBM, and Linear Regression (LR)) to predict HYP in participants living in Indonesia. 21 In that study, LR was the prediction model with the best performance, based on the highest AUC value (0.829). In contrast, ML was found to have the best performance in the present study because it did not use RF, and personal characteristics were not added to the features. However, the AUC value was higher in this study (0.9103). Moreover, a study on ML-based prediction models for HYP patients in three countries used GT, RF, GBM, XGBM, LR, and Linear Discriminant Analysis, and found that XGBM was the ML-based algorithm with the best performance. 22 Another study from Malaysia on ML-based prediction models for diagnosing HYP used RF, support vector machine, GBM, XGBM, LGBM, CatBoost, AdaBoost, and LogitBosst and found that LGBM had the highest accuracy (74.39). 23
Many studies on the use of ML for HYP have been published worldwide, and various ML algorithms have been used in the analyses. A recent study published in Korea on ML for HYP prediction also used the least absolute shrinkage and selection operator, support vector machine, RF, and deep neural networks. 11 However, studies similar to the present study that selected the best performing ML based on a comparison of five models for older adults in Korea and ranked the HYP influencing factors using SHAP are still lacking. Moreover, existing studies have manipulated data for ML using class-balancing methods. Because the data used in the present study did not have an unbalanced structure, class-balancing methods were not used.
In this study, the influence of features on the prediction of HYP was analyzed using SHAP. As shown in Figure 3, hyperlipidemia, diabetes, BMR, body muscle percentage, body fat percentage, average daily step count, stress, HR, and depression were interpretable features that influenced HYP. According to existing studies, hyperlipidemia was identified to be a factor that clearly influences HYP, as confirmed in other studies. 24 According to a Korean study that analyzed the association between HYP and hyperlipidemia, HYP was found to be closely associated with hyperlipidemia. In addition, diabetes has been identified as a factor that influenced HYP.
HYP, hyperlipidemia, and diabetes are common chronic diseases, and because of the ageing population in South Korea, chronic diseases among older adults are an important social issue. According to the National Survey of Older Koreans conducted by the Ministry of Health and Welfare, three out of 10 older adults aged ≥65 years have at least three chronic diseases, with HYP being the most common, followed by diabetes and hyperlipidemia. 4 Moreover, the findings in the present study showed that higher BMR had increased HYP risk among older adults. Previous studies have reported that high BMR reduces the risk of obesity, which also lowers the risk of HYP. 25 However, in the present study, the BMR was higher in the HYP group than in the non-HYP group by an average of 27, and BMR was also identified as an influencing factor in the SHAP analysis. Although the association between higher BMR and HYP in older adults appears counterintuitive, this finding may be partly explained by age-related changes in body composition, visceral adiposity, insulin resistance, and sympathetic overactivity—factors known to elevate both metabolic rate and blood pressure in the elderly.26–28 Some studies reported that with respect to BMR and ageing in older adults, those with higher BMR may have a higher likelihood of HYP, which is consistent with the findings of the present study. 29 In addition, older adults with a lower average daily step count had a higher risk of HYP, which aligned with previous studies that investigated the causal relationship between step count and HYP. The prevalence of HYP increases with higher body fat percentage, which is associated with the fact that obesity is a major risk factor for HYP.30,31
To prepare for population ageing, the central and local governments in South Korea are implementing various exercise programs for older adults at senior welfare, health, and healthy living support centers. It is easy to participate in such programs in urban areas owing to good accessibility owing to the availability of various transportation modes; however, participation in rural (mountainous) areas is difficult because of low accessibility due to the limited availability of transportation modes. Therefore, it is necessary to review the effectiveness of government policies to promote older adults’ living practices from various perspectives, which can have direct and indirect effects on HYP prevention.
Older adults with higher depression levels had a higher prediction probability for HYP. According to previous studies, older adults with higher levels of depression are more likely to develop HYP. 32 Other studies have also identified HYP as a causative factor of depression, 33 and a higher level of depression is associated with less physical activity, lack of proper dietary habits, and increased smoking and drinking, which are known to be direct and indirect factors of HYP. 34
Since the COVID-19 pandemic, there has been an increase in non-face-to-face programs in South Korea, which has resulted in reduced social participation among older adults. Consequently, mental health, including social loneliness, has emerged as a new social issue. Depression is an influencing factor for predicting HYP among older adults and a negative factor for mental and physical health, including HYP.
The present study had some limitations. First, the study sample consisted of older adults aged ≥65 years who lived in Seoul, South Korea. Because the study sample consisted only of older adults residing in Seoul, the findings may not be generalizable to older populations living in rural areas or in other countries. Therefore, the sample did not represent all older adults in Korea aged ≥65 years. Second, information related to personal identity could not be obtained owing to laws and regulations regarding personally identifiable information. Such information includes sex, age, personal income, and education level, which may influence HYP.
Conclusion
In conclusion, five ML-based models (RF, LGBM, XGBM, GBM, and KNN) were compared to identify the optimal algorithm for predicting HYP among older adults aged ≥65 years, with RF demonstrating the best performance. This study contributes by systematically comparing these models using real-world data and applying SHAP-based explainable AI to identify key modifiable and nonmodifiable HYP risk factors. SHAP analysis highlighted hyperlipidemia, diabetes, BMR, body muscle percentage, body fat percentage, average daily step count, stress, HR, and depression as significant predictive factors. Given the challenges of an ageing society, it is crucial for South Korean government and local authorities to regularly evaluate and refine health promotion initiatives aimed at older adults, particularly by targeting modifiable risk factors identified in this study. Special attention should be given to rural areas with limited accessibility to ensure equitable healthcare and preventive support, thus effectively reducing the incidence of HYP among older adults.
Supplemental Material
sj-pdf-1-dhj-10.1177_20552076261435733 - Supplemental material for Machine-learning–based risk assessment of hypertension among older adults in Korea
Supplemental material, sj-pdf-1-dhj-10.1177_20552076261435733 for Machine-learning–based risk assessment of hypertension among older adults in Korea by Hocheol Lee and Yejun Kim in DIGITAL HEALTH
Supplemental Material
sj-docx-2-dhj-10.1177_20552076261435733 - Supplemental material for Machine-learning–based risk assessment of hypertension among older adults in Korea
Supplemental material, sj-docx-2-dhj-10.1177_20552076261435733 for Machine-learning–based risk assessment of hypertension among older adults in Korea by Hocheol Lee and Yejun Kim in DIGITAL HEALTH
Supplemental Material
sj-docx-3-dhj-10.1177_20552076261435733 - Supplemental material for Machine-learning–based risk assessment of hypertension among older adults in Korea
Supplemental material, sj-docx-3-dhj-10.1177_20552076261435733 for Machine-learning–based risk assessment of hypertension among older adults in Korea by Hocheol Lee and Yejun Kim in DIGITAL HEALTH
Footnotes
Ethical considerations
This cross-sectional study was conducted between January and December 2023. This study was approved by the IRB of Yonsei University (No. 1041849-202401-SB-021-01), ensuring that all research activities were conducted in accordance with the relevant ethical standards and guidelines.
Consent to participate
Informed consent was obtained from all participants.
Consent for publication
Not applicable.
Author contributions
HCL, YJK (all authors) were solely responsible for all aspects of this work, including: conceptualization; data curation; formal analysis; funding acquisition; investigation; methodology; project administration; resources; software; supervision; validation; visualization; writing – original draft; and writing – review and editing.
Funding
The authors disclosed receipt of the following financial support for the research, authorship, and/or publication of this article: This work was supported by the Basic Science Research Program through the National Research Foundation of Korea, funded by the Ministry of Education (Grant No. RS-2024-00461755).
Declaration of conflicting interests
The authors declared no potential conflicts of interest with respect to the research, authorship, and/or publication of this article.
Data availability
The datasets used and/or analyzed during the current study are available from the corresponding author upon reasonable request.
Supplemental material
Supplemental material for this article is available online.