
Abstract
Background
Fibromyalgia is a chronic pain syndrome affecting 2–4% of the global population. Social media platforms host patient narratives and public discussions that can complement traditional evidence.
Objective
To characterize English-language YouTube discourse on fibromyalgia over 2015–2025, describing longitudinal and seasonal engagement patterns and sentiment dynamics, while outlining platform- and translation-related methodological considerations.
Methods
A retrospective cross-sectional analysis was conducted on YouTube videos referencing fibromyalgia (2015–2025) identified via English keywords. When non-English videos appeared, relevant comments were processed using a documented translation pipeline prior to analysis. Counts of videos, comments, and words were summarized; seasonal groups were compared. Sentiment classification (negative/neutral/positive) was performed using an automated model; searches were repeated in anonymized sessions to gauge recommendation-system effects, and a small in-study manual validation was conducted.
Results
A total of 941 videos and 30,896 comments (1,505,579 words) were analyzed. Engagement peaked in spring (12,125 comments) and summer (8899). Neutral sentiment predominated across seasons (62.1–66.3%), with relatively higher positive proportions in summer (25.3%). Seasonal differences in engagement were statistically significant in nonparametric comparisons. Manual validation indicated good overall performance of the sentiment model, with reduced accuracy on translated comments.
Conclusions
English-language YouTube discussions on fibromyalgia increased over the decade and exhibited seasonal patterns. Findings should be interpreted as platform-specific and noncausal, given recommendation-system influences, language constraints, and automated sentiment limitations. Nevertheless, social media analytics can inform patient-centered communication and hypotheses for future research.
Introduction
Fibromyalgia is a persistent and multifaceted syndrome, primarily marked by widespread musculoskeletal pain, chronic fatigue, sleep disturbances, cognitive difficulties, and a range of somatic symptoms. 1 Affecting an estimated 2–4% of the global population, fibromyalgia is notably more common in women, though it can present across all ages and demographics. 2 The underlying causes of fibromyalgia remain only partially understood, with current research pointing to a complex interplay of genetic predisposition, neurobiological mechanisms, psychological factors, and environmental influences. Central sensitization, disruptions in pain processing, and dysregulation of the hypothalamic–pituitary–adrenal axis are considered central to its pathophysiology.3,4
The clinical manifestation of fibromyalgia is highly variable and often overlaps with other chronic pain syndromes and psychiatric conditions such as depression and anxiety. This heterogeneity complicates diagnosis, frequently leading to delays and increased patient distress, as well as a diminished quality of life. 5 Despite advances in research, there is still no definitive laboratory or imaging test for fibromyalgia; diagnosis relies primarily on clinical criteria established by the American College of Rheumatology, which have evolved from the 2010 preliminary criteria toward symptom- and severity-based revisions in 2011 and 2016.6–8
Fibromyalgia imposes a significant burden not only on patients but also on their families and healthcare systems. Individuals with fibromyalgia often experience limitations in daily activities, reduced work capacity, and social withdrawal. The economic impact is substantial, encompassing both direct healthcare costs and indirect costs related to disability and lost productivity. Additionally, the stigma surrounding fibromyalgia and insufficient public awareness can further exacerbate the psychosocial challenges faced by patients.9,10
In recent years, social media platforms have become vital spaces for patients to share experiences, seek peer support, and access health-related information. YouTube, as one of the most widely used video-sharing platforms, hosts a diverse array of user-generated content on fibromyalgia, including patient stories, educational resources, and discussions about treatment options.11,12 Analyzing user comments on such platforms offers a practical window into patient-facing discourse. Accordingly, this study examines English-language YouTube comments on fibromyalgia across 2015–2025 to characterize longitudinal and seasonal engagement patterns and sentiment dynamics. By mapping trends in comment volumes, lexical themes, and sentiment distributions, the analysis aims to inform patient education, advocacy, and support strategies. Given platform-specific demographics, content formats, and recommendation mechanisms, the findings are intended to be interpreted as YouTube-specific discourse rather than a comprehensive public perspective spanning other social media platforms or languages.
Methods
The study was conducted in June 2025. A systematic search was performed on YouTube using the English keyword “fibromyalgia” on YouTube's internal search engine. No additional disease-related keywords (e.g., “FM,” “fibro”) were used to avoid introducing selection bias from colloquial variants. Videos were included if they explicitly referenced fibromyalgia in the title or description. To gauge potential recommendation-system effects, we replicated the “fibromyalgia” search in anonymized sessions (cleared cookies, logged-out state) on multiple days and devices. Nonmedical advertisements and short promotional content were excluded. Although the primary corpus was English-language content, non-English videos that surfaced in results were screened; when relevant, associated comments were translated prior to analysis as described below. The 2015–2025 window was chosen to capture a decade of YouTube activity spanning the pre- and post-COVID-19 period, enabling characterization of long-term trends rather than short-term fluctuations.
The initial “fibromyalgia” search returned several thousand videos. We screened titles and descriptions to confirm explicit reference to fibromyalgia; nonmedical advertisements, duplicate uploads, and content focusing primarily on unrelated topics were excluded. After screening, 941 unique videos remained for analysis.
Comment analysis and seasonal distribution
All user comments from the included videos were automatically extracted and subjected to quantitative analysis. Key metrics, including the total number of comments, total word count, average words per comment, and average comments per video, were calculated to provide an overview of user engagement. To assess seasonal variation, each video and all of its associated comments were categorized according to the season in which the video was uploaded; individual comment timestamps were not used to reassign seasons. Seasons were defined according to the northern hemisphere meteorological calendar: spring (March–May), summer (June–August), autumn (September–November), and winter (December–February). Given that the vast majority of English-language fibromyalgia videos originated from countries in the northern hemisphere (e.g., the United States, the United Kingdom, and Canada), no separate southern hemisphere adjustment was applied. The number of videos, comments, and total word counts were compared across these seasonal groups to identify potential fluctuations in public interest and engagement throughout the year.
Comment processing and translation
Language identification was performed using fastText lid.176 (Facebook AI Research, 2018), with manual spot checks for ambiguous cases. Non-English comments deemed relevant were translated to English using Google Cloud Translation API (v3; accessed June 2025) with automatic language detection. Sentence boundaries were preserved where possible to minimize segmentation errors. Known limitations of machine translation for irony, idioms, and culturally anchored expressions were considered in interpretation, particularly for sentiment analyses.
Comments were lowercased; URLs, emojis, user mentions, and excessive punctuation/whitespace were normalized; and common contractions were expanded. Stop-word removal or stemming/lemmatization was not applied prior to sentiment classification to preserve contextual cues (e.g., negation). For frequency analyses, punctuation-stripped tokens were used.
Because the primary focus was English-language discourse, translation was restricted to non-English comments attached to videos that otherwise met the English-language inclusion criteria, rather than exhaustively translating all non-English content on the platform.
For word-frequency analyses, common spelling variants and abbreviations (e.g., “fm,” “fibro”) were lowercased and treated as distinct tokens; no manual stemming or custom dictionary was applied, so abbreviations and misspellings appear as recorded.
Sentiment analysis and validation
Sentiment classification (negative, neutral, positive) was performed using the cardiffnlp/twitter-roberta-base-sentiment-latest model (HuggingFace; accessed June 2025), implemented with transformers v4.41.0 and PyTorch 2.3.0. The base model was pretrained on large-scale Twitter corpora; no domain-specific fine-tuning was undertaken. For internal validation, a stratified random sample of 400 comments (English n = 300; machine-translated n = 100) was independently annotated by two raters following a predefined codebook. Inter-rater agreement was substantial, with Cohen's κ ranging from 0.70 to 0.78 across strata. Against human annotations, the overall macro-F1 was 0.79 (English 0.81; translated 0.72). Common error sources included sarcasm, mixed-affect statements, and domain-specific terminology.
Sentiment analyses were conducted at the comment level; we did not collapse multiple comments from the same user ID, so frequent commenters contributed more than one observation.
Statistical analysis
All statistical analyses were performed using IBM SPSS Statistics for Windows, Version 22.0 (IBM Corp., Armonk, NY, USA). Descriptive statistics were calculated for all variables, including means, standard deviations, minimums, and maximums for continuous data, and frequencies and percentages for categorical data. The normality of data distribution was assessed using the Kolmogorov–Smirnov test.
For the comparison of seasonal differences in the number of videos, comments, and word counts, the Kruskal–Wallis test was applied due to the non-normal distribution of the data. When significant differences were detected, Bonferroni-corrected post hoc pairwise comparisons were conducted. Categorical variables, such as sentiment categories, were compared using the chi-square test. No multivariable regression models were fitted; analyses were limited to descriptive statistics, nonparametric group comparisons (Kruskal–Wallis with Bonferroni-adjusted post hoc tests), and chi-square tests for categorical distributions. A P-value of less than P < .05 was considered statistically significant.
Ethical considerations
Only publicly available data were used, and no personally identifiable information was included. The research was conducted in accordance with the principles of the Declaration of Helsinki.
Results
General characteristics
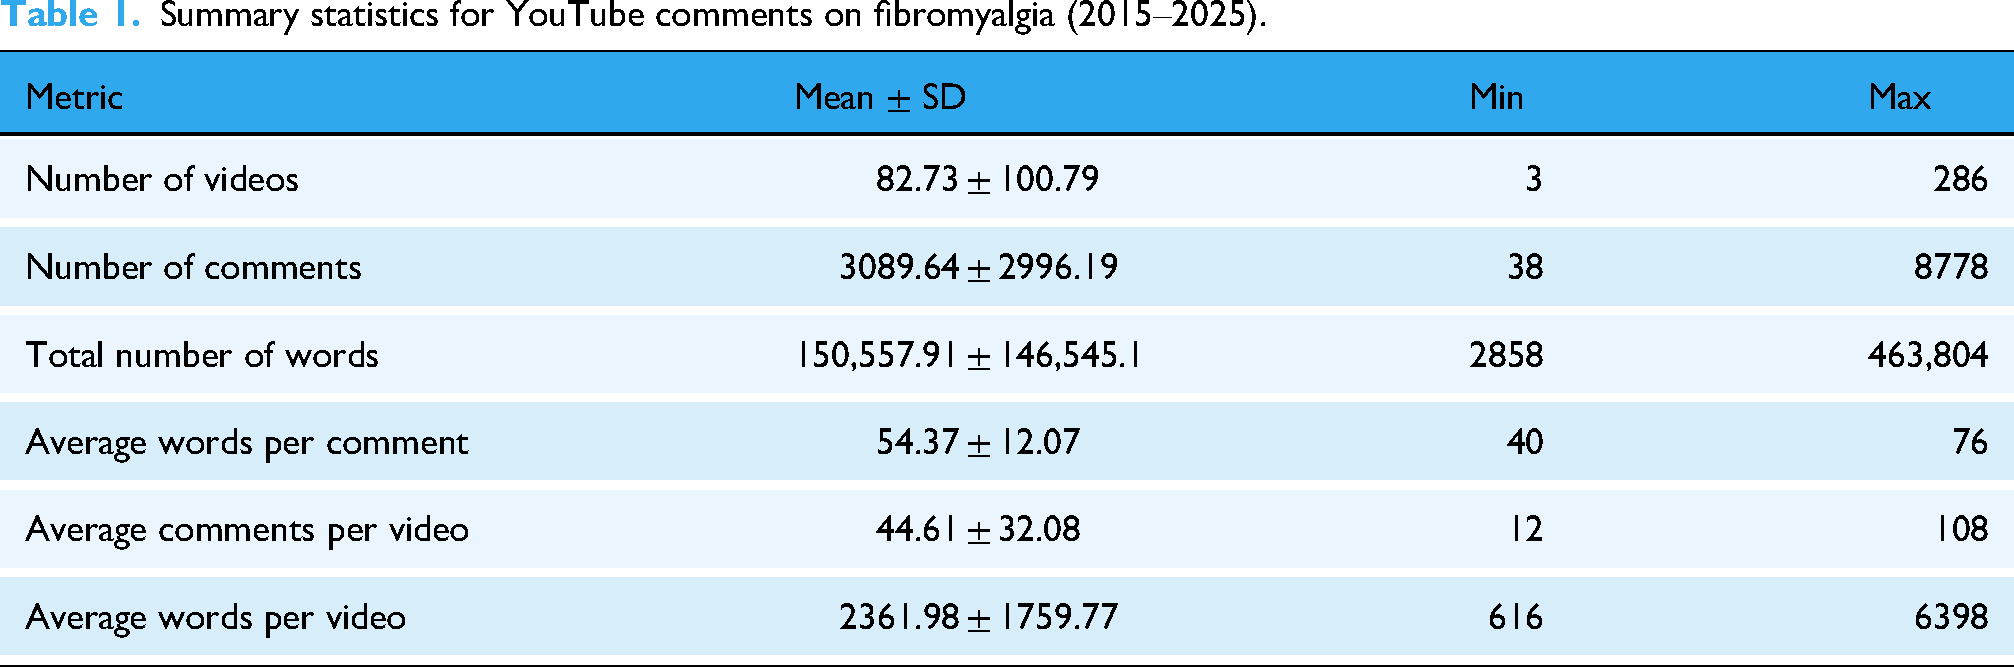
A total of 941 fibromyalgia-related videos were identified on YouTube between 2015 and 2025. The mean number of videos per year was 82.73 ± 100.79 (range: 3–286). In total, 30,896 comments were analyzed, with an average of 3089.64 ± 2996.19 comments per year (range: 38–8778). The cumulative word count of all comments was 1,505,579, with an annual mean of 150,557.91 ± 146,545.1 words (range: 2858–463,804). The average number of words per comment was 54.37 ± 12.07 (range: 40–76), while the mean number of comments per video was 44.61 ± 32.08 (range: 12–108). The average word count per video was 2361.98 ± 1759.77 (range: 616–6398). These general characteristics are detailed in Table 1.
Summary statistics for YouTube comments on fibromyalgia (2015–2025).
Seasonal distribution
The highest number of videos and comments occurred in spring (293 videos, 12,125 comments, 593,780 words), followed by summer (215 videos, 8899 comments, 454,582 words), autumn (203 videos, 6633 comments, 315,650 words), and winter (230 videos, 6329 comments, 292,127 words). Engagement, as measured by average comments and word count per video, was highest in spring and summer. The Kruskal–Wallis test indicated significant differences in the number of comments between spring and summer (P < .01), winter and summer (P < .01), and winter and autumn (P = .03). No significant difference was found between spring and autumn (P = .43), while a significant difference was observed between spring and winter (P < .01). The seasonal distribution of the data is presented in Table 2.
Seasonal distribution of videos, comments, and word counts (2015–2025).

Note: Seasons were defined according to the northern hemisphere meteorological calendar based on video upload date (spring: Mar–May; summer: Jun–Aug; autumn: Sep–Nov; winter: Dec–Feb). All comments attached to a given video were assigned to the season of that video. “Avg comments per video” and “Avg words per video” refer to the number and total word count of comments per video, respectively.
Sentiment analysis
Sentiment analyses were conducted at the comment level; we did not collapse multiple comments from the same user ID, so frequent commenters contributed more than one observation.
Annual distributions of negative, neutral, and positive sentiment are presented in Figure 1. Negative sentiment peaked around 2019 and gradually declined thereafter, while neutral sentiment increased slightly in the later years. As shown in Figure 2, videos, unique commenters, total comments, and total words increased over 2015–2025, with linear and quadratic fits. By season, summer had the highest proportion of positive sentiment (25.29%), followed by winter (24.34%), spring (23.68%), and autumn (23.0%). Neutral sentiment predominated across all seasons, ranging from 62.05% in summer to 66.29% in autumn. Negative sentiment peaked in summer (12.65%) and was lowest in winter (10.6%). Seasonal sentiment distributions are summarized in Table 3.

Annual sentiment distribution of YouTube comments on fibromyalgia.

Annual trends in the number of fibromyalgia-related YouTube videos, unique commenters, total comments, and total words from 2015 to 2025. Linear and quadratic regression fits are shown for each metric, illustrating the overall increase in engagement and content volume over the study period.
Seasonal sentiment distribution of YouTube comments on fibromyalgia (2015–2025).

Percentages are by season. Chi-square test for overall seasonal differences in sentiment: χ2(df = 6) = 32.6, P < .001. Selected pairwise risk differences (pp) with 95% CIs: positive (summer − autumn) = +2.29 (1.24 to 3.33), P < .001; negative (summer − winter) = +2.05 (1.26 to 2.84), P < .001; positive (summer − winter) = +0.95 (−0.01 to 1.91), P ≈ .052.
Comparisons of seasonal sentiment proportions indicated slightly higher positive (vs neutral) shares in summer; effect sizes were small. Seasonal sentiment distributions differed significantly overall (χ2[df = 6] = 32.6, P < .001). Pairwise contrasts showed a higher proportion of positive comments in summer versus autumn (Δ = 2.29 percentage points, 95% CI 1.24 to 3.33; P < .001) and a higher proportion of negative comments in summer versus winter (Δ = 2.05 pp, 95% CI 1.26 to 2.84; P < .001). The difference in positive sentiment between summer and winter was small and borderline (Δ = 0.95 pp, 95% CI −0.01 to 1.91; P ≈ .052).
Word frequency analysis
The most frequent word was “pain” (10,558 occurrences), followed by “fibromyalgia” (7487) and “years” (4878). Other common terms included “like,” “thank,” “fibro,” “symptoms,” “diagnosed,” and “doctor,” highlighting the centrality of pain and the diagnostic journey in discussions. The complete list of the top 20 most frequent words is presented in Table 4.
Most frequent words in YouTube comments on fibromyalgia (2015–2025).

Discussion
This study provides a decade-long, platform-specific characterization of English-language YouTube discourse on fibromyalgia. Across 941 videos and 30,896 comments totaling approximately 1.5 million words, engagement increased over time, seasonal activity differed, and neutral sentiment predominated. These observations align with prior reports that individuals with chronic pain turn to social media for information, peer support, and experience sharing, and with evaluations indicating that YouTube is a prominent—but variably reliable—source of health-related content.11,13–15
Engagement was higher in spring and summer in nonparametric comparisons, even after accounting for year-to-year variation descriptively, suggesting that seasonal patterns are not solely a byproduct of overall platform growth. Nonetheless, residual confounding related to recommendation algorithms, channel subscriber growth, or contemporaneous events (e.g., awareness activities) cannot be excluded. Sentiment patterns showed consistently high neutrality across seasons, with modestly higher positive proportions in summer. These small effect sizes should be interpreted as hypothesis-generating rather than causal. Clinical research on seasonal variability in fibromyalgia symptoms has yielded mixed results, so the online discourse signals observed here warrant triangulation with clinical, survey, or registry data. 16 Importantly, we did not include an external control topic (e.g., non-disease-related videos) or global measures of YouTube usage over time, so we cannot determine whether the observed longitudinal trends are specific to fibromyalgia or reflect more generic increases in platform engagement.
The relatively modest proportion of negative comments may seem counterintuitive given the high burden and psychosocial impact of fibromyalgia. However, prior work on online health communities has similarly highlighted mixed affect, with substantial representation of informational and supportive exchanges alongside distress and frustration.11,13 YouTube's public, non-anonymous format and the tendency for patients to use dedicated forums or private groups for venting may further contribute to an overrepresentation of neutral or gratitude-oriented content in comment sections. Recent registry-based data also suggest nuanced patterns of symptom fluctuation across seasons rather than uniformly worse outcomes, which may partly align with the small but detectable seasonal differences in positive and negative sentiment observed in our study. 17
The lexical profile—frequent mentions of “pain,” “symptoms,” “diagnosed,” and “doctor,” alongside community-oriented terms such as “thank” and “help”—echoes earlier findings that diagnostic journeys, clinical interactions, and peer support are salient themes in fibromyalgia-related online discussions.15,18–20 Prior assessments have also documented high viewership for clinician-created videos coupled with variable adherence to evidence-based guidance, underscoring ongoing needs in digital health communication.11–14
Methodologically, automated sentiment classification was accompanied by an in-study validation against a manually annotated sample. Overall performance was acceptable, but accuracy declined for machine-translated comments, and failures were more likely for sarcasm, mixed emotions, and domain-specific terminology—patterns consistent with known challenges in health-related social media NLP.15,18 Together with platform-specific demographics and recommendation mechanisms, these factors limit generalizability beyond English-language YouTube commenters. 21
Accordingly, the present work should be interpreted as YouTube-specific discourse mapping rather than a comprehensive “public perspective.” Future research can strengthen external validity by adopting multi-platform, multi-lingual designs; incorporating richer platform and channel covariates; and linking social media signals to clinical or survey outcomes.
Study limitations
This study is limited to English-language YouTube content and may not generalize to other platforms (e.g., TikTok, Reddit, Facebook) or languages with different audiences and engagement norms. YouTube's recommendation algorithms can affect video discovery and comment visibility, introducing selection and exposure biases. Automated sentiment classification—although validated in-sample—performs less accurately on machine-translated comments and can misclassify sarcasm, mixed emotions, and domain-specific terminology. The absence of verified user demographics and channel-level covariates (e.g., subscriber growth, content categories) constrains representativeness and confounding control. Despite multivariable adjustments with year fixed effects and channel clustering, residual confounding remains possible. Finally, comment data reflect a self-selected, digitally engaged subset; results should not be extrapolated to all individuals with fibromyalgia. We did not weight or collapse multiple comments from the same user, so highly active commenters could disproportionately influence sentiment distributions.
Conclusion
English-language YouTube discourse on fibromyalgia expanded between 2015 and 2025 and showed consistent seasonal engagement with small shifts in sentiment. These platform-specific, non-causal signals can inform digital health communication; confirmatory multi-platform, multi-lingual, and clinically triangulated studies are warranted.
Footnotes
Acknowledgments
The authors have no acknowledgments to declare.
Ethical approval and data privacy statement
This study did not involve human participants or animals, and therefore formal ethical approval and informed consent were not required. All data were obtained from publicly accessible YouTube comments, in accordance with the platform's Terms of Service. No personally identifiable information was collected, stored, or reported. All user-generated content was anonymized prior to analysis, and data handling complied with ethical guidelines for internet-based research and digital health data governance.
Contributorship
All authors conceived and designed the research and conducted the experiments. Concept: M.T.Y., F.B.; design: B.A., B.T.D.; data collection or processing: M.T.Y., M.H.T.; analysis or interpretation: M.T.Y., F.B.; literature review: M.H.T., F.B., M.T.Y., E.C.; writing original draft preparation: B.A., B.T.D.; writing-review and editing: M.H.T., F.B., B.T.D. All authors read and approved the final version of the manuscript accepted for publication.
Funding
The authors disclosed receipt of the following financial support for the research, authorship, and/or publication of this article: This work was supported by the Necmettin Erbakan Üniversitesi.
Declaration of conflicting interests
The authors declared no potential conflicts of interest with respect to the research, authorship, and/or publication of this article.
Data availability statement
Data will be available upon request from the corresponding author.
Guarantor
MTY.