
Abstract
Early screening for diabetic retinopathy (DR) prevents vision loss in diabetic patients.
Objective
To classify DR cases, this study suggests computer-assisted screening and diagnosis. The proposed methodology consists of retinal blood vessel, macular region, and exudate segmentation. In this study, exudates were screened, and DR was classified as mild, moderate, or severe by analyzing the presence of exudates in the macular region.
Methods
The bit-plane morphological slicing technique was employed to segment the macular region. The U-Net deep learning approach was used to segment the exudates from the retinal images, and the proposed methodologies were applied and evaluated on retinal images in the publicly available Methods to Evaluate Segmentation and Indexing Techniques in the field of Retinal Ophthalmology (MESSIDOR) and High-Resolution Fundus (HRF) datasets. Finally, DR can be diagnosed by analyzing the presence of exudates in the macular region, and DR can be diagnosed as mild, moderate, or severe based on the severity levels. The conventional segmentation algorithms segment and locate the internal boundary of pixels in both exudates and macula. In contrast with the conventional segmentation methods, the proposed algorithm segments and locates both internal and external boundary of pixels in both exudates and macula region which increases the segmentation accuracy.
Results
The proposed macular region segmentation method obtained 98.9% SeI, 99.2% SpI, and 99.1% AccI for the MESSIDOR dataset. The proposed macular region segmentation method obtained 99.2% SeI, 99.7% SpI, and 99.8% AccI for the HRF dataset. The proposed exudate segmentation method obtained 99.3% SeI, 99.2% SpI, and 99.2% AccI for the MESSIDOR dataset. The proposed exudate segmentation method obtained 99.7% SeI, 99.3% SpI, and 99.1% AccI for the HRF dataset.
Conclusion
The segmentation time period of both exudates and macula region in retinal image is low when comparing with other segmentation methods. Moreover, this proposed segmentation and diagnosis method was tested with other DIARETDB1, Retinal Fundus Multi-disease Image, and Fundus Image Registration Dataset datasets to validate the effectiveness of the proposed method.
Introduction
Diabetic retinopathy (DR) is characterized by irreversible vision loss in diabetic patients. Patients were unaware of any DR symptoms until they reached a severe condition. Early detection and diagnosis of DR are required to prevent vision loss. If DR is detected at the appropriate time, laser surgery can be performed to reduce the possibility of vision loss. The World Health Organization (WHO) predicts that the number of people with diabetes worldwide will increase to 366 million by 2030 (WHO Report, 2021). Currently, DR is being detected both directly and indirectly. Manual examination by an ophthalmologist is used in the direct methodology, in which stereoscopy or an optical computed tomography image is analyzed for DR diagnosis. The detection and diagnosis of abnormal lesions in retinal images are performed using an indirect methodology, which requires an ophthalmologist to diagnose DR.1 The main indicators or symptoms of the DR are blurred vision, fully or partially night vision loss, formation of dark spots in the retina, abnormal thin lines formation in retina, and fluctuating vision. The ophthalmologist is the person to detect these DR indicators through the relevant and proper equipment and suggests the methods to prevent earlier vision loss due to DR.
Patients with diabetes should undergo an annual retinal imaging examination to detect DR symptoms at an earlier stage Govindharaj et al.2 This is not possible in developing countries because of the lack of ophthalmologists or medical experts to screen and detect DR severity, which is a time-consuming process. These limitations were eliminated by proposing a computer-aided approach for screening the severity of DR. This approach detects lesions, such as exudates and hemorrhages, to screen and diagnose the severity of DR. In this study, exudates were used to detect and screen the severity of DR based on their presence in the macular region. Figure 1 shows a retinal image of abnormal lesions in and around the macular region.

Retinal image showing lesions.
Thin blood vessels in the retina are damaged in patients with diabetes owing to high pressure. This damaged blood vessel delivers blood to the retina, where it is transformed into lipids and plasma that form exudates Govindharaj et al.3 These were observed in the retina as yellowish-white spots. A greater number of abnormal exudate lesions in the macular region leads to immediate vision loss. The diagnosis of DR severity can be used to detect abnormal lesions in the macular region on retinal images.
The research gap is stated as follows:
Many conventional DR detection and grading system used existing deep learning models such as Inception, Visual Geometry Group (VGG), and Efficient Net. These models require higher number of hyper parameters which consumed more time period for the DR detection and grading. Hence, the research gap has been identified by proposing an enhanced bit-plane slicing method and U-Net architecture to get the higher precision and robustness for both the detection and segmentation of macula region and exudates lesions segmentation. Though the detailed experimental analysis, the proposed method stated in this paper seeks to bridge the research gap for DR detection and grading system.
The novelties of this paper are highlighted below:
In existing method, the DR grading is performed using the segmented exudates only, which reduces the DR grading accuracy rate. The limitation of this existing work can be overcome by analyzing the exudates presence in the segmented macula region, which is identified as the novelty of this research work. The efficient (the macula region and exudates lesions segmentation accuracy) and low complex (the DR computational time period and the number of tunable parameters of classifier) algorithm has been developed and proposed in this paper for macula segmentation process. The Momentum incorporated Stochastic Gradient Descent (SGD) optimizer has been used in U-Net Convolutional Neural Network (CNN) architecture for the detection of the exudates lesions in the retinal images. The DR can be diagnosed into five classes.
The major contributions of this paper are highlighted below:
This article makes the following distinct contributions to the field of retinal image analysis for the detection of DR.
A novel method for detecting the macula region in retinal images is proposed. This method integrates a bit-plane slicing technique with a morphological algorithm. This combination aims to enhance the accuracy and robustness of macula localization, which is a crucial step in the DR detection system. The research contributes to the automated detection of exudates lesions in retinal images through the application of U-Net CNN architecture. This approach leverages the strengths of deep learning for image segmentation, enabling precise identification and quantification of exudates, which are key indicators of DR progression. The contribution of this research lies in its focus on developing an automated system for analyzing retinal images to diagnose the severity of DR based on the presence of exudate lesions within the macula region. The contribution extends for grading the severity levels of DR through analyzing the relationship between the exudates count in segmented macula region in the abnormal retinal image. The standard retinal imaging datasets are used to verify the performance of the proposed DR detection and grading system, and the experimental results are validated using k-fold approach.
“Related works” section states and discusses the conventional methods to identify the exudates lesions in retinal images, “Proposed methodologies” section proposes a novel methodology for screening and diagnosing the severity of DR through exudates location, The fourth section elaborates the result of exudates and DR diagnosis system in detail, and the fifth section is discussion. Finally, the conclusions are presented in sixth section.
Related works
This section states and discusses the traditional DR detection methods using machine and deep learning approaches. It elaborates the methodology to identify various abnormal lesions in the retinal images and its segmentation algorithms. The main findings of the traditional methods have been stated with its merits and limitations. Moreover, the significance of the traditional algorithms for macula and exudates detection on various retinal imaging datasets has been stated in this section.
Dinial et al.4 segmented exudate lesions in retinal images using the proposed Modified Fully Connected Networks (FCN-8) algorithm; this method was evaluated using a large dataset of retinal images. The results of this FCN-based algorithm were tested on the high-resolution retinal images only, as identified as the main limitation of their study. The main merit of their study was that its exudates detection and segmentation accuracy rate was around 98%. Tian et al.5 applied various glaucoma detection methodologies to retinal images of various timescale categories. Their study used feature conditioning approaches for computing various retinal features, and these retinal evaluation and systematic feature set were used to identify the abnormal retinal images from the large retinal imaging dataset. The scalability and durability of the developed algorithm were estimated and validated. Xue et al.6 proposed a multitask abnormal segmentation approach to detect and segment lesion patterns in retinal images. The segmented lesions were also evaluated by the various statistical approaches, and their results were significantly compared against various similar lesions detection models in their study. Chudzik et al.7 used a deep CNN methodology for exudate lesion segmentation, which was evaluated on a large retinal image dataset to validate the exudate segmentation results.
Wisaeng et al.8 detected various lesion patterns using a fuzzy inference-based algorithm. Lesion exudates were identified using a set of nonlinear filter procedures. Morphological functions are used to detect and remove unnecessary pattern spikes. This nonlinear filtering approach segregated the pixels in the retinal image which were belonging to the abnormal pattern. Though this was used for segregation purpose, this method degraded the pixels in the region of edges in the image, which is identified as the main limitation of their study. Using retinal pictures from the Methods to Evaluate Segmentation and Indexing Techniques in the field of Retinal Ophthalmology (MESSIDOR) dataset, scientists were able to achieve 98.18% accuracy for the average lesion pattern. Abderrahmane et al.9 applied mean-shift filtering to smooth the surfaces of the retinal images. The authors used an adaptive threshold algorithm on surface-smoothed retinal images to detect and segment exudate. Using the retinal images in the MESSIDOR dataset, scientists achieved an average segmentation accuracy of 95.2% and a sensitivity of 96.1%. Biswal et al.10 applied line detectors on retinal images which used various detectors with different scales and orientations which were integrated with scale window were applied over the retinal images. The maximum response pixels were selected for each scale, with different orientations. This method was used to detect and locate the larger exudates pixels only in the retinal images, as identified as the main limitation of their study. The authors tested their proposed retinal vessel detection methodology on retinal images available in the open-access DRIVE, STARE, and CHASE datasets. The average retinal image classification index over the various datasets is around 96%.
Elbalaoui et al.11 used the Gabor filtering technique in the preprocessing step to transform spatial-domain pixels into multiorientation pixels. The transformed retinal images were classified using Principal Component Analysis (PCA). Subsequently, the authors used the k-means clustering technique to classify the retinal images to improve the average level of accuracy. This PCA-based DR method was validated through large and small retinal datasets in order to estimate its scaling level percentage, as identified as the main merit of their study.
Roychowdhury et al.12 detected and diagnosed DR using different robust algorithms and applied a support vector machine (SVM) classification approach to classify retinal images into either exudate-free or exudate images. An AdaBoost-based feature-ranking technique was implemented to reduce the number of feature sets for SVM classification. The authors used the DIARETDB1 and MESSIDOR datasets and achieved 96% sensitivity and 51% specificity. The specificity rate of this SVM-based DR detection approach was significantly low, and hence, the diagnosis grading results were degraded for the large retinal imaging dataset, as identified as the main limitation of their study. Soares et al.13 developed a scale space and curvature algorithm to detect exudates in fundus images. The location of exudates was identified using dynamic thresholding. The authors achieved an average exudate detection accuracy of 99.89%.
Prakash et al.14 developed a hybrid CNNs approach using the RIDGELET transform to detect and classify meningioma brain tumors. They achieved 99.7% categorization accuracy for the BRATS 2019 data collection and 99.36% categorization accuracy for the Nanfang data collection. According to calculations by Thiyaneswaran et al.,15 AlexNet using an Adaptive Moment Estimation solver was able to attain a system accuracy of 98.21%.
Conventional methods used abnormal lesions in retinal images to screen and diagnose DR. On a wider collection of retinal images, they were unable to deliver the best DR diagnosis, and their diagnosis did not consider the macular region; that is, state-of-the-art methods did not consider the relationship between such lesions and the macular region for DR screening and diagnosis. Therefore, this study considered the presence of exudates in the macular region in retinal images for the screening and diagnosis of DR.
Proposed methodologies
A computer-aided automatic approach was proposed for detecting and classifying DR stages through detection and segmentation of exudates and macular regions in retinal images. Exudates are the primary abnormal lesions in retinal images that have formed due to diabetes. If the diabetic level is abnormal, the number of exudate lesions in the retina is high, which degrades the vision in the human eye. Hence, detection of such abnormal exudates is important for DR screening in patients with diabetes. Moreover, the detection and segmentation of the macular region in retinal images is more significant and correlated with abnormal exudate lesions. The macular region of the retinal image was segmented, and the quantity of exudate in this area was determined. Based on this information, the DR severity levels were assessed. If less than 40% of the total observed exudates in the retinal picture were present in the macular region, the severity of DR was classified as Grade-1. The severity of DR was identified as Grade-2 if there was more than 40% exudate presence (over total detected exudates in the retinal image) within the macular region.
The proposed DR screening methodology using the detection of exudates and macula is shown in Figure 2.

Proposed diabetic retinopathy (DR) grading framework.
The proposed classification architecture can be functioned with respect to training and testing. The training phase of the classifier requires more number of retinal images for each DR grading class in order to obtain the higher classification results. But, the retinal images which are available in the datasets are not enough which leads to overfitting issue during training phase of the classifier. Hence, the data augmentation methods are used in this research work during the training phase of the proposed classifier to eliminate such over fitting issue. The data augmentation increases the retinal image counts in each DR grading case. In this work, shift left and shift right data augmentation methods are applied on the training dataset retinal image which increases the image count. After applying data augmentation methods, each retinal image is converted into three retinal images, including source retinal image.
Macula region detection
The macula is the area of the retinal image with low intensity. It is responsible for vision, and the fovea, the darkest area of the macula, is located in the heart of the structure. Macular region detection is essential for DR diagnosis because the presence of abnormal lesions in the macular region determines the severity of DR. Macular region detection is a tedious process because of its intensity variations in retinal images. Two important properties were used to precisely detect macular regions.
No retinal blood vessels are present inside the macula region. The distance metric from centroid of the macula region to its Optic Disc (OD) is the twice of the diameter of the OD.
The retinal image is a Red Green Blue image in which each pixel in an image contains three primary components, Red, Green, and Blue, which are initially converted into grayscale images such that each pixel in an image contains eight bits, as illustrated in equations (1) and (2):


Many conventional macula region segmentation methods used deep learning models such as Inception, VGG, EfficientNet, attention-based U-Nets, and transformer models. These models require higher number of hyper parameters which consumed more time period for macula region segmentation. Hence, there is a need for proposing a methodology for macula region segmentation with low computational time period. Therefore, a time period efficient bit-plane slicing technique has been proposed in this research work for locating the macula region in the retinal images.
The bit-plane slicing technique was applied to this grayscale image to detect and segment the macular region from the retinal fundus image, as follows:
Let the first 3 × 3 region be an 8-bit binary value in the grayscale image.
Each Least Significant Bit (LSB) (8th bit) in the grayscale image forms the 1st bit plane slice image, and each first-bit Most Significant Bit in the grayscale image forms the 8th bit plane slice image. The
The
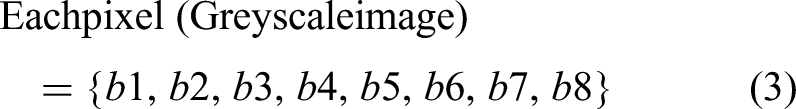
Decomposition of the bit plane slice for the 8-bit image leads to the formation of eight binary images (bit plane slice images). Lower-order bit plane slice images (bit plane slices 1–4) were found to carry low-contrast information, and higher-order bit plane slice images (bit plane slices 6–8) were found to carry noisy pixels and high-contrast information. Both lower- and higher-order bit-plane slice images are shown in equations (4) and (5), respectively:


Among these 8-bit plane slice images (

The dark-plane image, which clearly shows the macular region, is shown in Figure 3, which shows the location and shape of the macular region in the retinal image. Hence, this dark-plane image was selected for further morphological processing in order to determine the exact region of interest (ROI) of the macula.
Dark plane image (5th plane slice image) which clearly highlights the macula region in the retinal image in its center and it can be located using morphological processing algorithm.
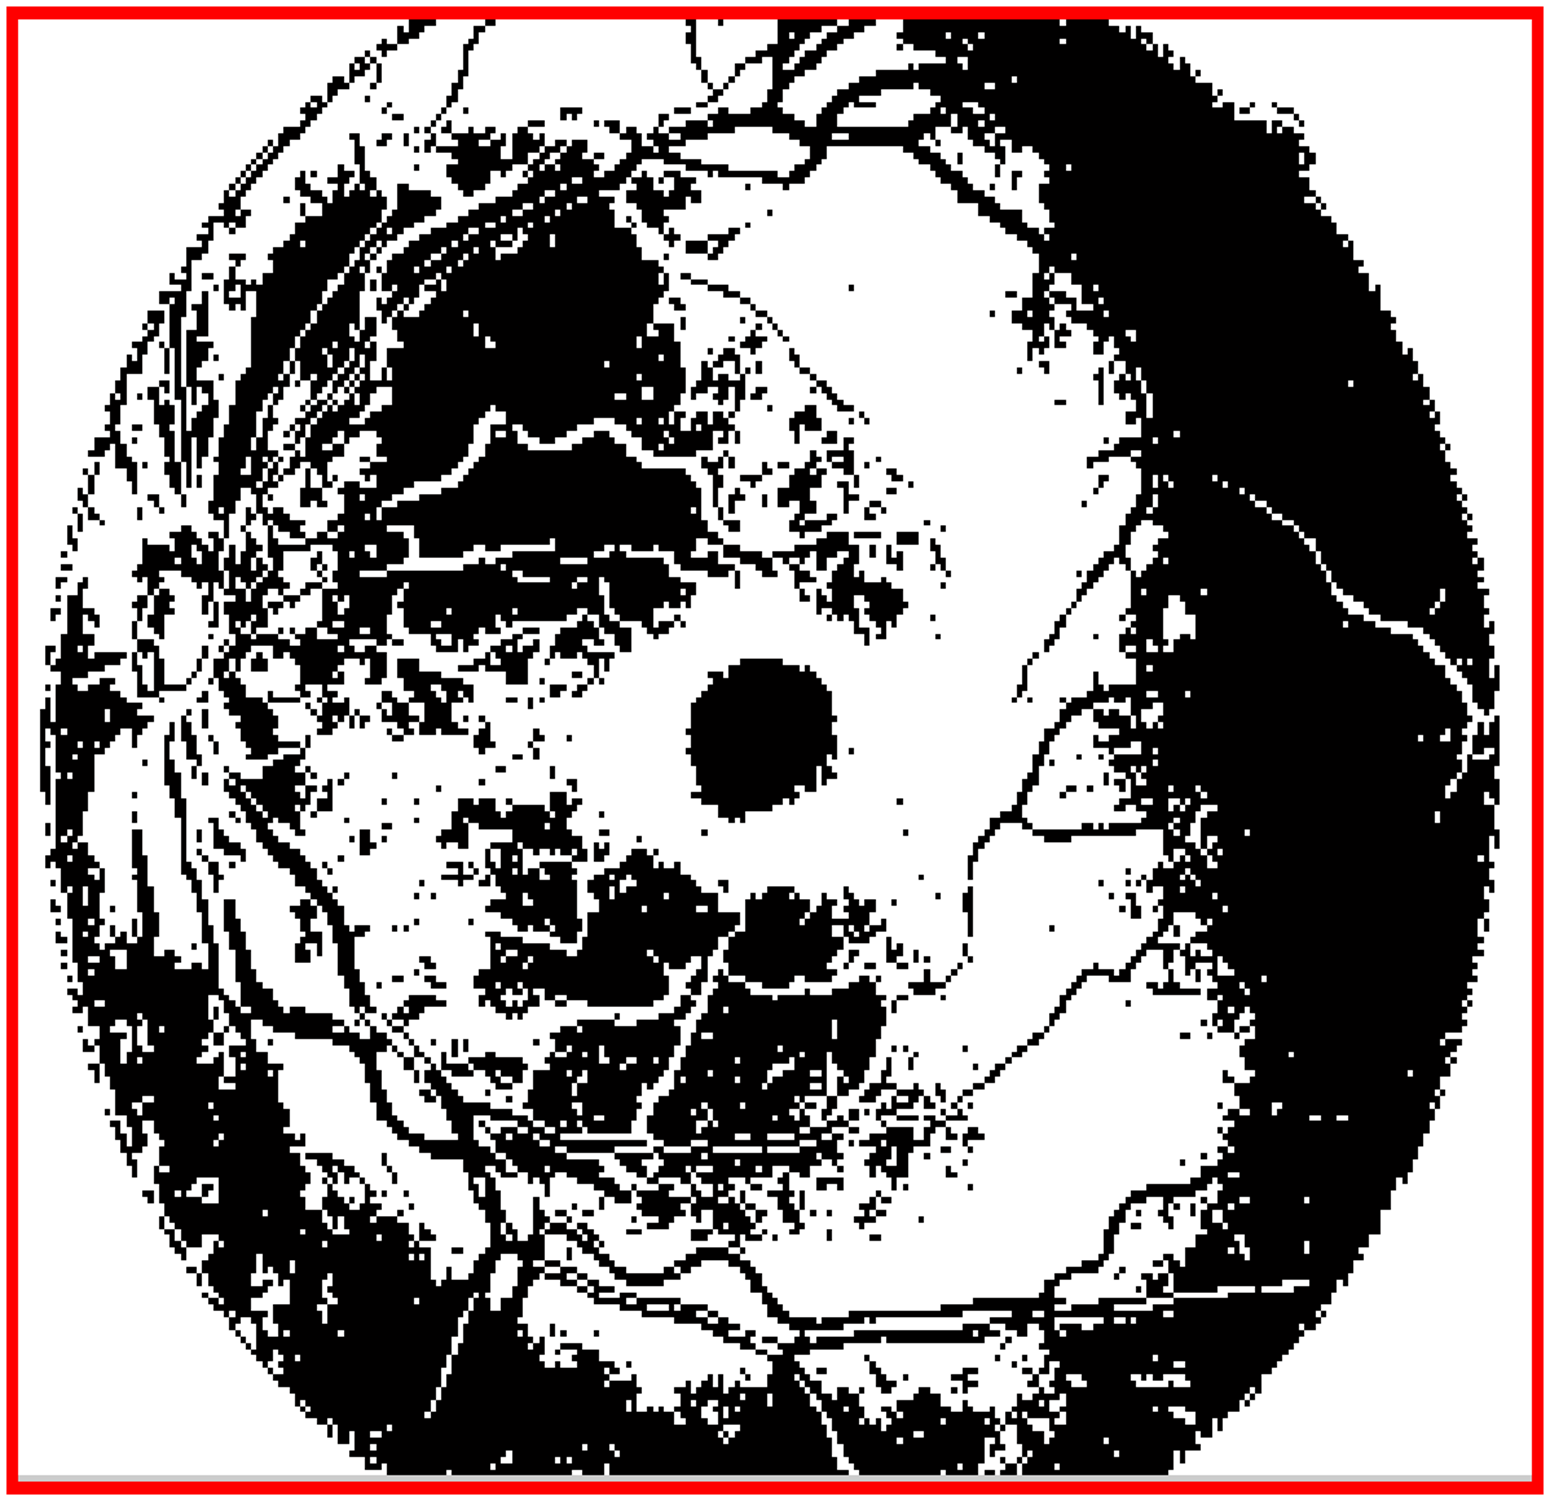
Of the 8-bit planes slice images, the dark plane image clearly illustrates the macular region over which the inversion operation is applied to complement each pixel value, as shown in equation (7). Here, each pixel value of the dark plane image is inverted to construct the inverted image to locate the macula region in the retinal images, as illustrated in equation (7):

The inverted dark plane image is shown in Figure 4.

Inverted dark plane image which can be obtained by complementing the each pixel value in the dark plane image.
In the inverted dark plane image, the macula-like pixels are represented in white and the nonmacular pixels are represented in black. Then, all macula-like pixels are connected using a morphological closing operation to form a connected region, as shown in Equation (8). The erosion has 0.3 mm structuring element with the shape of disk, have been chosen as the hyper parameter value in this proposed approach for the detection of macula region in the proposed method:

The erosion function in the morphological opening function expands the outer boundary of each pixel in an inverted image, as shown in Figure 5.
Closed image which is obtained through the erosion process on each pixel in the inverted image.
Next, morphological area opening is applied over the morphologically closed image to eliminate the small objects with value <500 pixels. This final morphologically area opened image consists of two objects, that is, one object representing the macula region and another one representing the nonmacula region. The most important property of macula region is that there will be no blood vessels present within the macula region. Therefore, this condition is verified by morphologically multiplying the two objects separately with retinal blood vessel segmented image. The white pixel objects in the resultant image are assumed to be nonmacula region objects, and the black pixel objects are concluded as macula region objects. These regions of pixels are then marked as ROI of the macula region in the corresponding retinal image.
The centroid (Cx,Cy) or midpoint of the segmented macular region was estimated using equations (9) and (10):


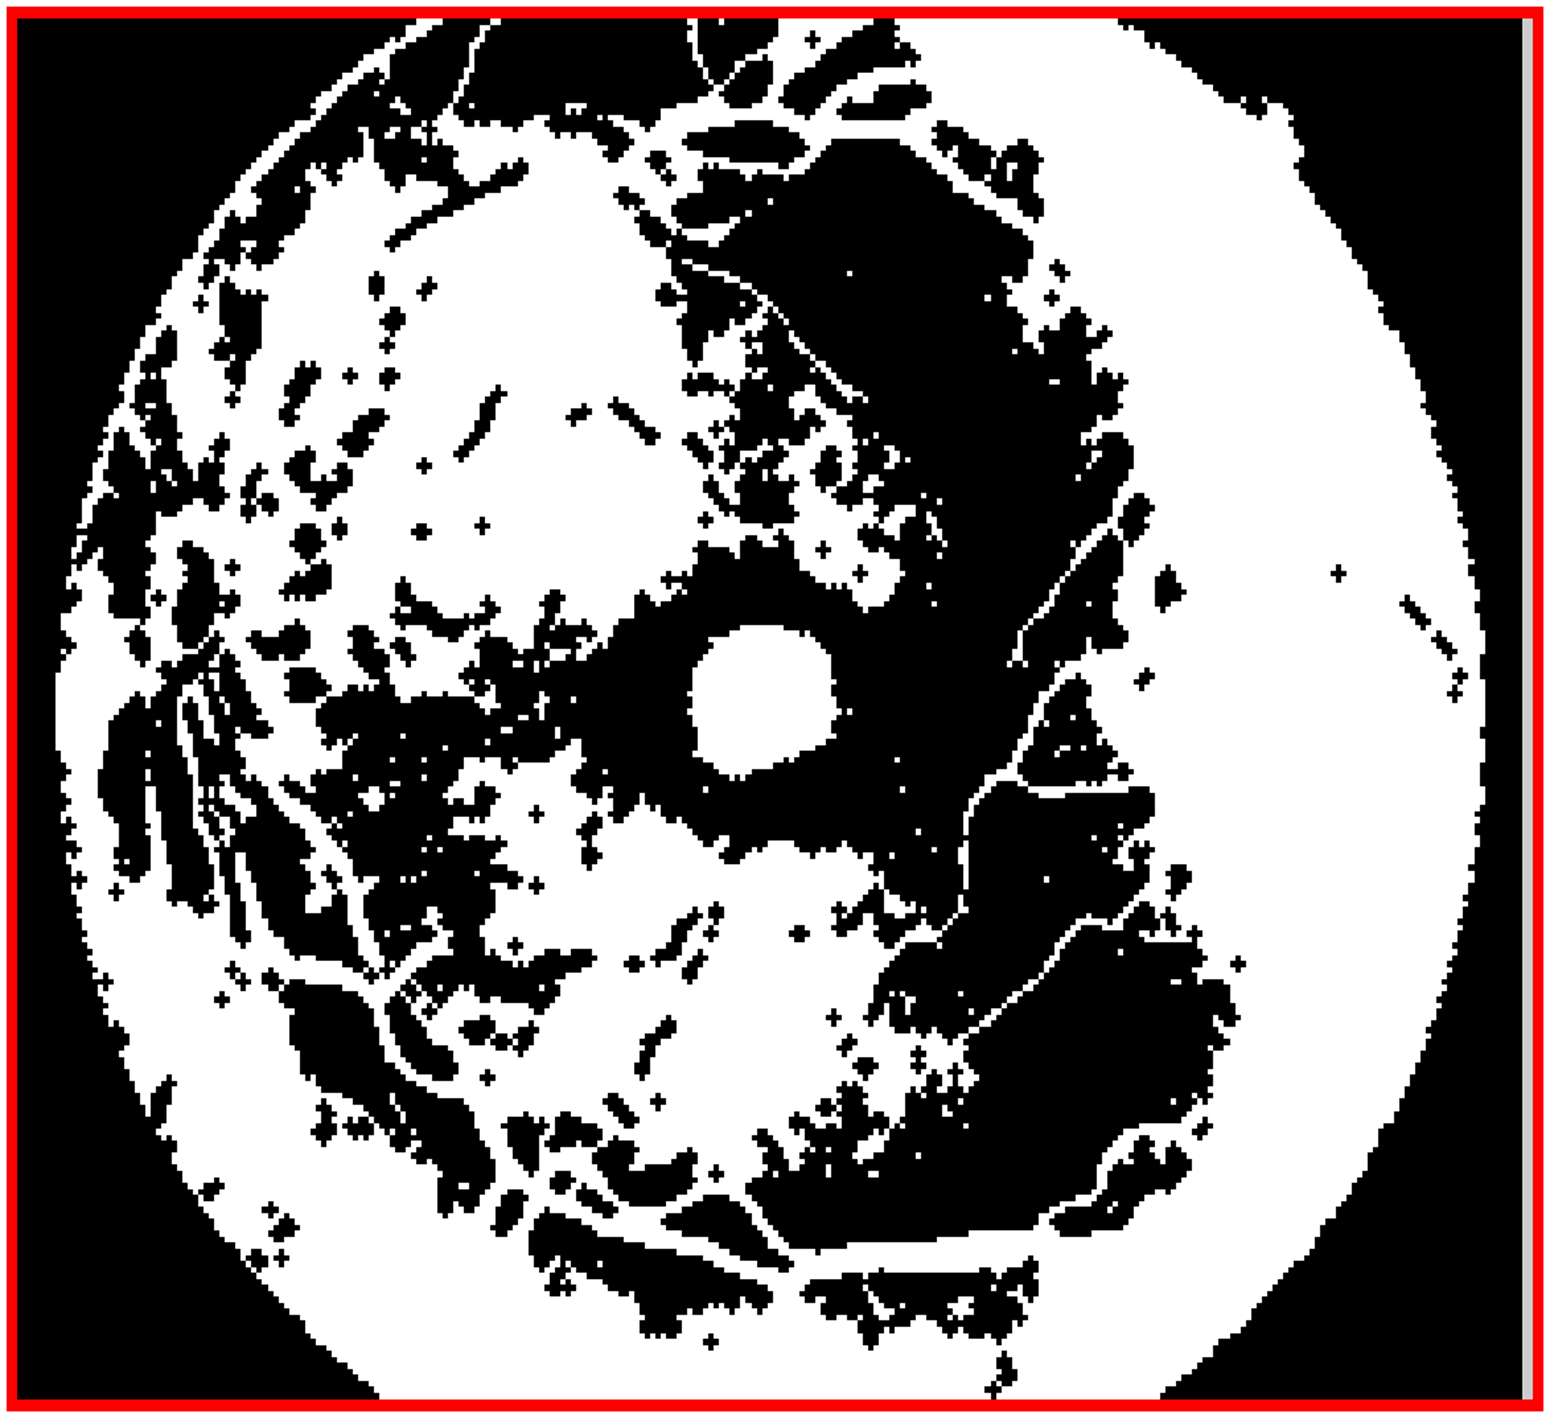
Figure 6(a) shows the human retinal image, and Figure 6(b) shows the segmented macular region.

(a) Sample human retina where the macula region has to be detected and segmented (Macula is the darker region in the retinal image) (b) detected and segmented macula region (marked as white pixels) in the retinal image using bit-plane slicing technique.
Exudates detection
Exudates are abnormal lesions that determine the severity of DR. Several studies have used transformation techniques and feature-extraction-based classifiers to detect exudates Govindharaj et al.16 These methods involve complex exudate-detection processes. In this study, exudates in retinal pictures were located using deep learning architectures. Although these techniques are useful for locating exudates in retinal images, they do so in two stages: first, by using a classifier to detect exudates, and then by utilizing a segmentation module to find exudates. These two modules require a longer time period, which is a limitation of this study. Hence, this study combines these two processes to find exudates using a unique method called the U-Net CNN architecture to locate exudates Govindharaj et al.17 In the proposed architecture, the number of filters is increased to improve the location accuracy of exudates. Figure 7 shows the proposed U-Net architecture for locating exudates in retinal images, which was designed using internal Encoder and Decoder modules. The Convolutional and pooling layer counts in both the encoder and decoder modules of the proposed U-Net architecture are shown in Figure 7. A linear rectifier unit (ReLU) is inserted at the output of each internal block to remove the negative responses of each internal layer. The main function of the ReLU module in the proposed architecture is to eliminate negative responses in each module output. The ReLU is the Activation function, and among the various activation functions, Linear ReLU was used in this study to eliminate nonlinearities in the output patterns and it is depicted in the following equation (11):


Proposed U-Net for exudates detection and segmentation.
Figure 8(a) shows the retinal image from the dataset, and Figure 8(b) shows the segmented retinal image of the exudates.
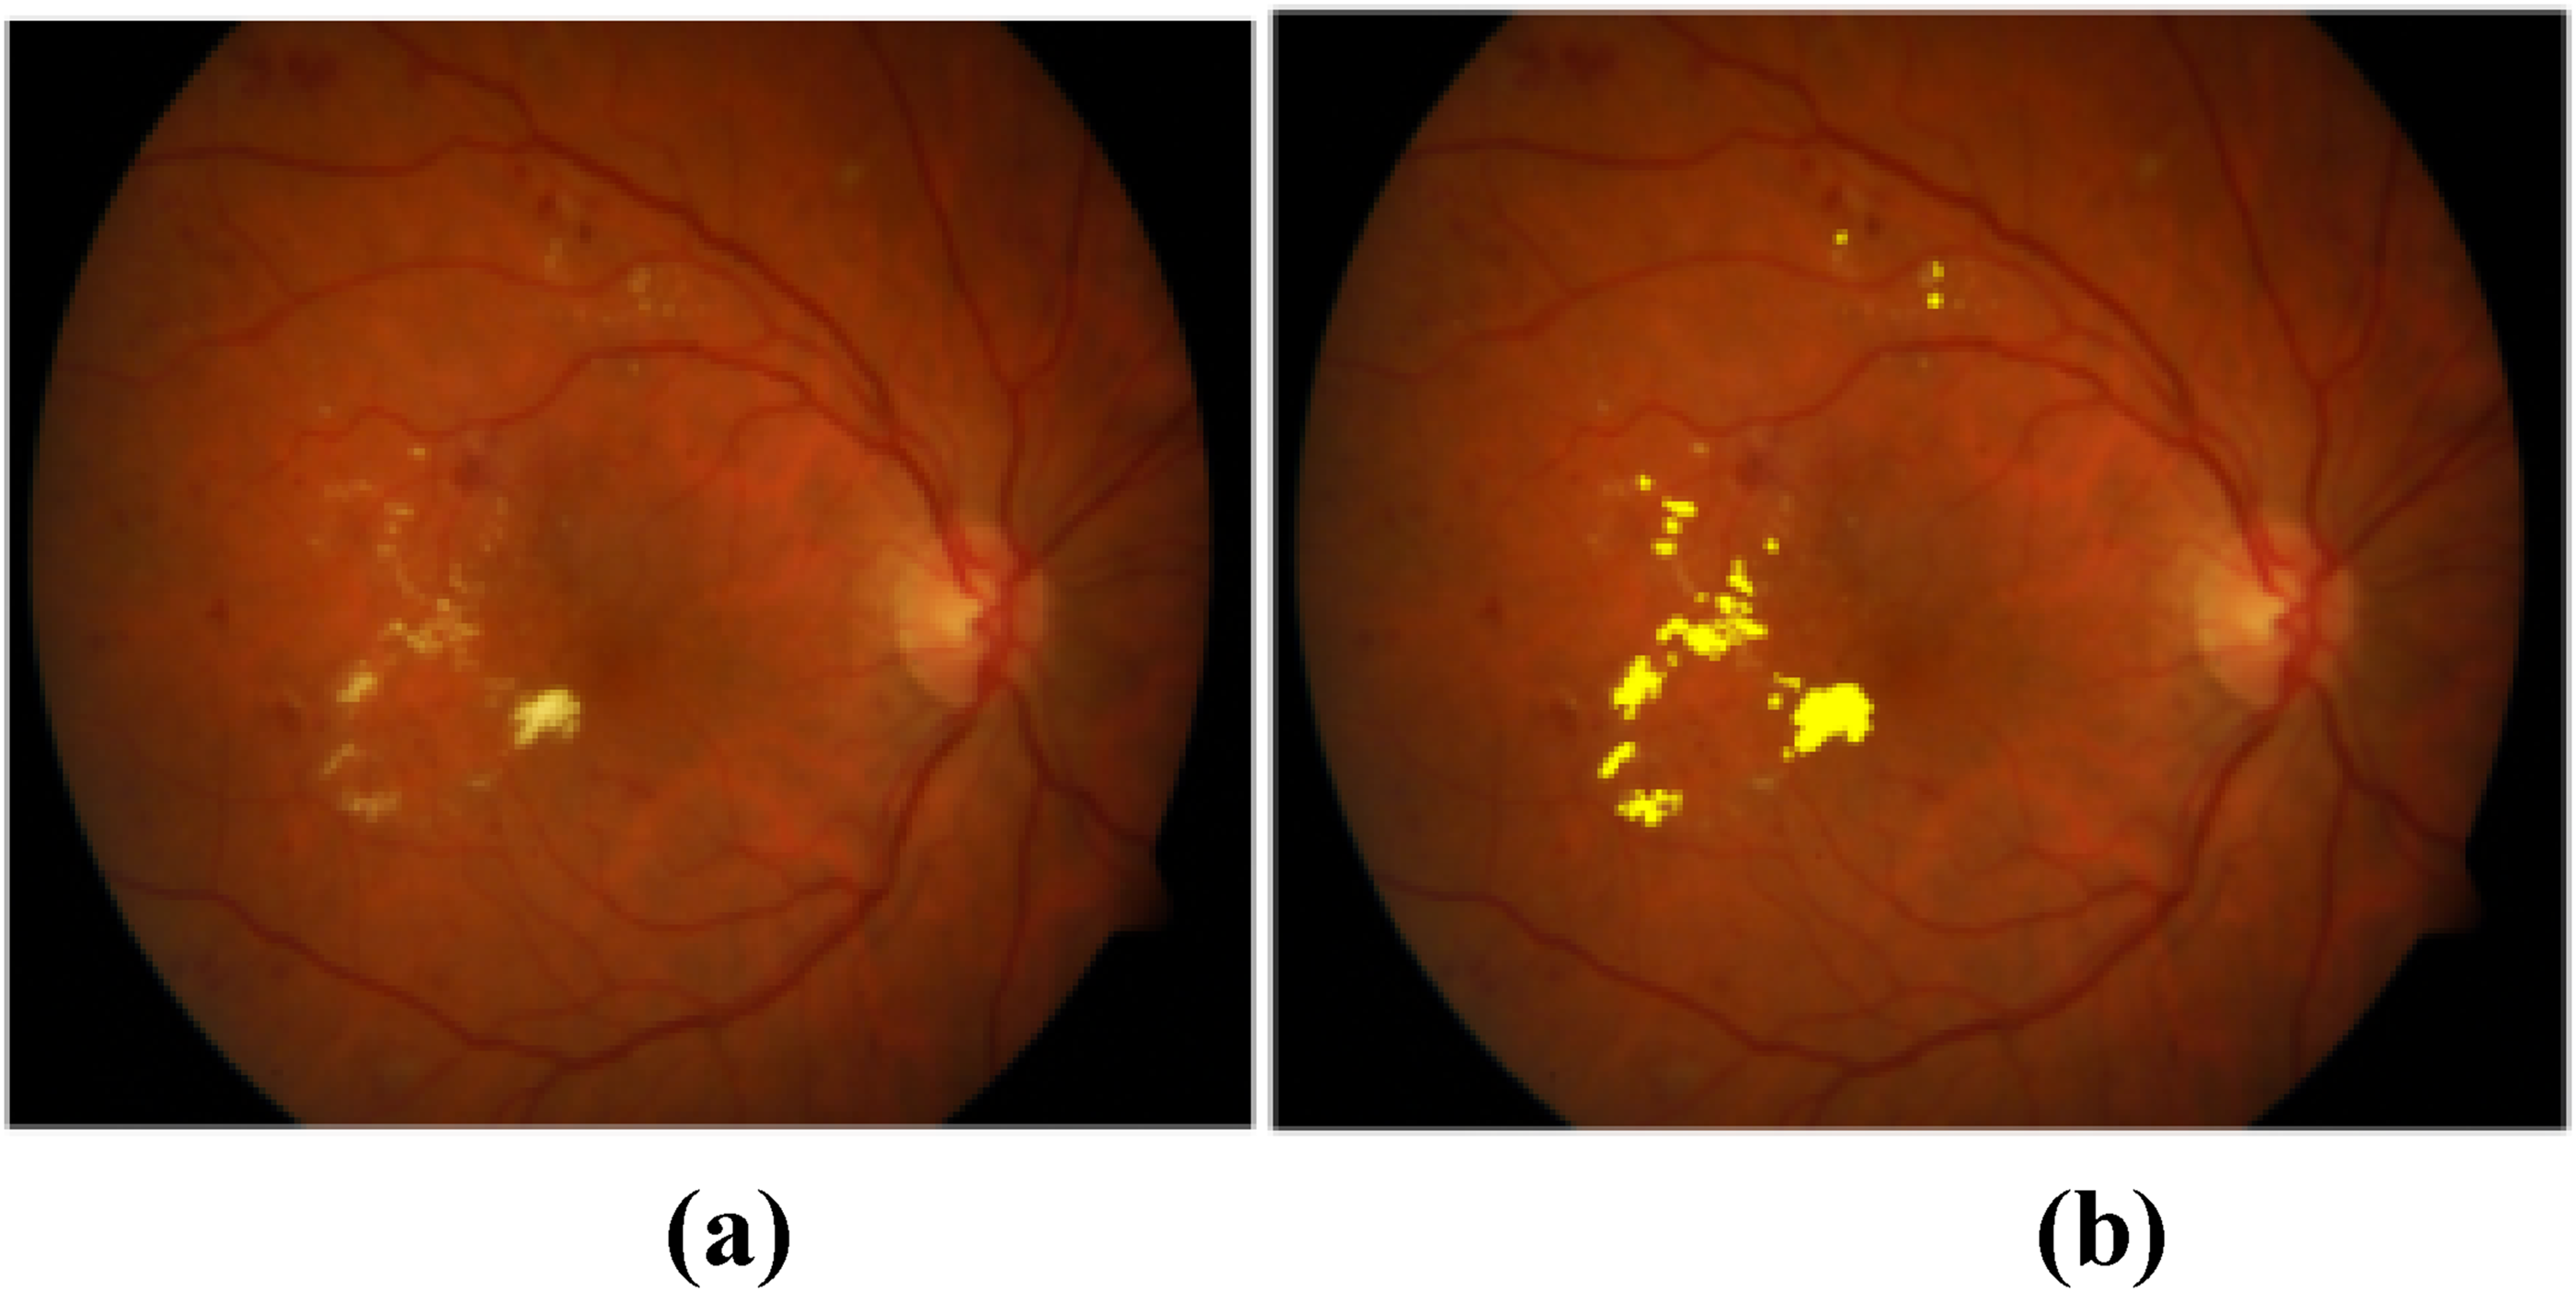
(a) Methods to Evaluate Segmentation and Indexing Techniques in the field of Retinal Ophthalmology (MESSIDOR) dataset image (b) Exudates segmented retinal image.
The parameter “depth” is defined as the number of levels in the proposed “U” shape classification architecture, where each level represents a stage of downsampling in the encoder and upsampling in the decoder. In this proposed U-Net architecture, the number of depth in Encoder side is 3, and the number of depth in decoder side is 3, as illustrated in Figure 7. Moreover, this modified and enhanced U-Net architecture has 2,24,000 parameters.
The proposed U-Net architecture for the detection and segmentation of the exudates lesions has been designed and tuned by the hyper parameters such as filter counts in each internal layer along with the size of the filter kernel, stride and the size of pooling, number of epochs, learning rate and drop out rate. These hyper-parameters for the proposed U-Net architecture are given in Table 1.
Hyper-parametric values of the U-Net architecture.

In order to improve and increase the performance efficiency of the exudates segmentation results, the filters in each Convolutional layers and filter kernel size have been increased in trial and error method to obtain the higher experimental values. The hyper parametric values of the proposed U-Net architecture are having higher Convolutional filters, kernel sizes and filter counts than the conventional U-Net architecture in this research work.
There are several optimizers available stated as Adam, RMSprop, SGD, etc., The memory consumption is high in Adam optimizer due to its storing momentum buffers. The learning and decay rate of RMSprop optimizer is low which slow down the convergence rate of the classifier, as identified as the main limitation of this optimizer. These limitations are overcome by using the SGD optimizer in this proposed system. The momentum value is varied between 0 and 1. In this SGD optimizer, the value of momentum is set to be 0.9 after several iterations to obtain the higher optimization results.
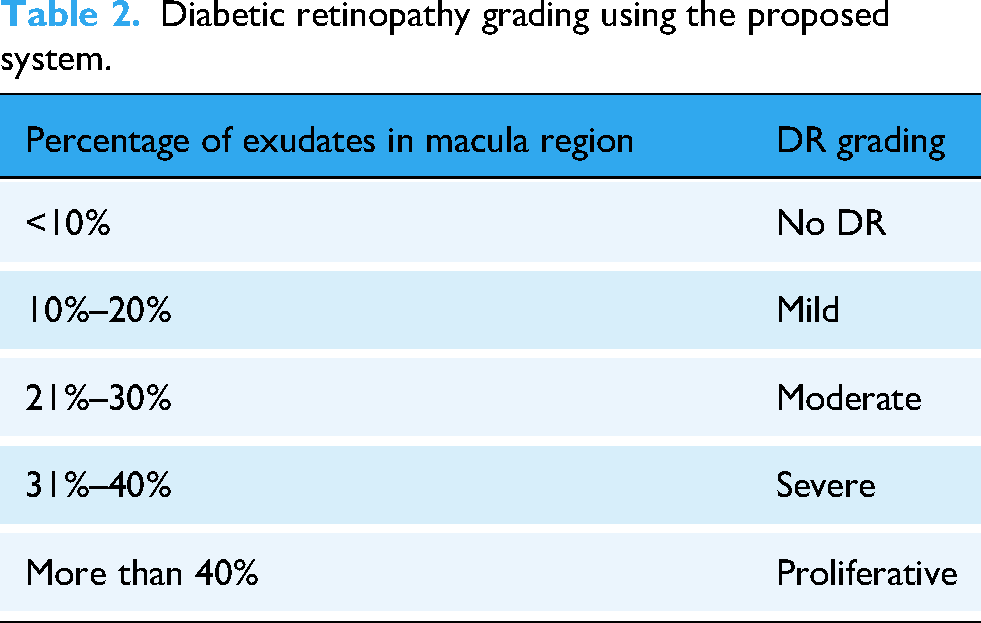
The total number of exudate lesions was counted in the exudates detected retinal image, and the total number of exudate lesions in the macular region of the retinal image. Using the conditions listed in Table 2, exudate lesions found in the macular region of retinal images were classified as any one of the five classes as No DR, Mild, Moderate, Severe, and Proliferative. If there are more than 40% exudates in the total exudates count of the macular region in the retinal image, then the DR is graded as Proliferative, that is, very severe DR leading to immediate vision loss in diabetic patients. If there are less than 10% exudates in the total exudates count of the macular region in the retinal image, then it is graded as No DR case. If there are 10%–20% exudates in the total exudates count of the region of the macula in the retinal image, then it is graded as Mild case. If there are less than 21%–30% exudates in the total exudates count of the region of the macula in the retinal image, then it is graded as Moderate case. If there are less than 31%–40% exudates in the total exudates count of the region of the macula in the retinal image, then it is graded as Severe DR case. Diabetic retinopathy can be cured by surgery or via proper medication to save the diabetic patients. The DR severity grades using the abnormal exudate count in the macular region are given by equation (15):
Diabetic retinopathy grading using the proposed system.
Results
Five free open-access datasets were used in this study: MESSIDOR, High-Resolution Fundus (HRF), Diabetic Retinopathy Database (DIARETDB1), Fundus Image Registration Dataset (FIRE), and Retinal Fundus Multi-disease Image (RFMiD). All the retinal images in these datasets are split into training and testing. This research work uses 60:40 ratio for dataset split up, whereas 60% of retinal images are used for training the classifier and the remaining 405 of the retinal images are used for testing the classifier.
The MESSIDOR and HRF datasets were used to screen and diagnose DR. They were used for the detection of DR in patients with diabetes. Both regular and aberrant images can be found in the MESSIDOR collection. Exudates, hemorrhages, and micro aneurysm lesions in the retina were used to classify aberrant pictures. All retinal images in this dataset were captured using a Charge Coupled Device Topcon TRC NW6 camera with a 45° field of view. The ground-truth images in this dataset were developed by three ophthalmologists and used for the performance analysis of abnormal lesion detection and segmentation in the retinal images. The demographic diversity details of this dataset are that the retinal images were acquired from both male and female patients aging between 20 and 60.
In the HRF dataset, 45 retinal images from various categories are available. Among the 45 retinal images, 15 were in the DR category, 15 were in the healthy category, and 15 were in the glaucoma category. In this study, 15 retinal images belonging to the DR category were accessed and used for the performance evaluation of the proposed macular region and exudate lesion segmentation. The demographic diversity details of this dataset are that the retinal images were acquired from both male and female patients aging between 15 and 55.
In the proposed work, 132 images (64 images showing no symptoms of DR and 68 images showing symptoms of DR) from the MESSIDOR dataset were used for performance analysis.
Table 3 shows the dataset specifications used in this research work for DR detection and grading with respect to image count, resolution of each retinal image, pixel quantization size and fundus camera which is used to capture the retinal images from the patients.
Dataset demographic specifications used in this research work for DR detection and grading.

In order to verify the effectiveness of the proposed DR detection algorithm, it has been implemented on different datasets where different image resolutions are used. Hence, these five open-access retinal imaging datasets are chosen in this research work.
Experimental results of macula region identification
The performance of macular region segmentation was analyzed using bit-plane slicing and morphological techniques. Two ophthalmologists provided the ground-truth retinal images for macular area segmentation. These ground-truth retinal images are currently available on open-access websites. Equations (13)–(15) are used to analyze macular region segmentation performance: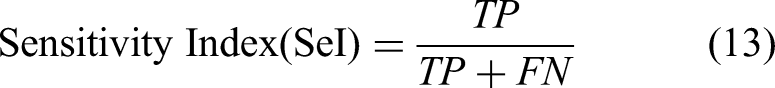


whereas TP and TN denote pixels with macular and nonmacular regions in retinal images, respectively, and FP and FN denote pixels with unrelated macular and nonmacular regions in retinal images, respectively.
This study applied the suggested macular region segmentation technique to a set of images from the MESSIDOR and HRF datasets and compared the outcomes with those of other methods.
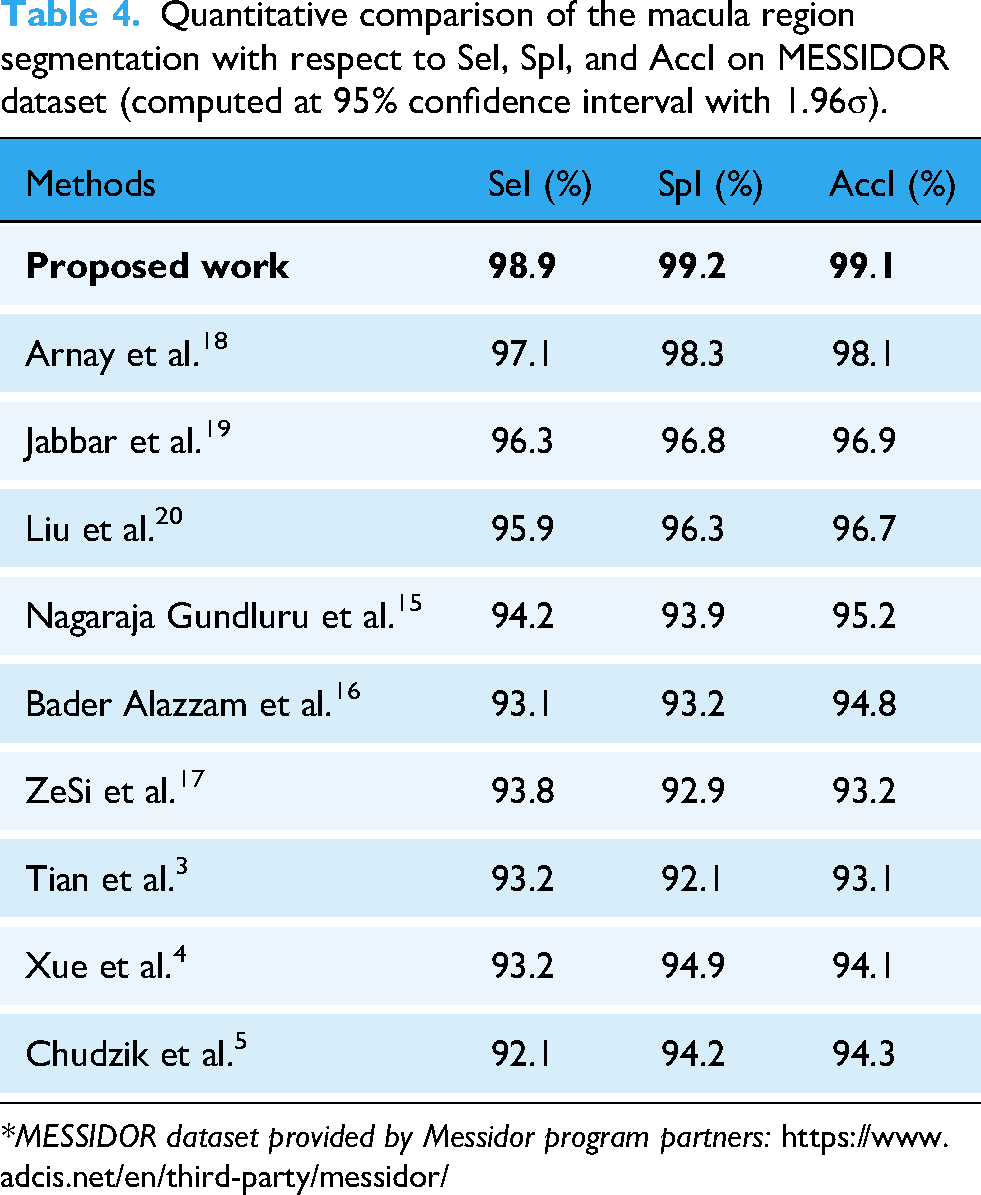
The quantitative evaluation details of macular segmentation are provided in Table 4 and Table 5 with respect to other state-of-the-art methods, such as Arnay et al.,18 Jabbar et al.,19 Liu et al.,20 Nagaraja Gundluru et al.,15 Bader Alazzam et al.,16 ZeSi et al.,17 Tian et al., Xue et al., and Chudzik et al., in terms of SeI, SpI, and AccI on the MESSIDOR and HRF datasets.
Quantitative comparison of the macula region segmentation with respect to SeI, SpI, and AccI on MESSIDOR dataset (computed at 95% confidence interval with 1.96σ).
*MESSIDOR dataset provided by Messidor program partners: https://www.adcis.net/en/third-party/messidor/
Quantitative comparison of the macula region segmentation with respect to SeI, SpI, and AccI on HRF dataset (computed at 95% confidence interval with 1.96σ).

*HRF dataset provided by Budai et al.18:
The proposed macula region segmentation method obtained higher segmentation results for the MESSIDOR dataset (Table 4-(on MESSIDOR dataset)), and it has been compared with the results of other similar macula segmentation models. The reason behind this optimum macula segmentation result is that it locates all the pixels using bit plane slicing method in the retinal image.
Arnay et al.18 obtained 97.1% SeI, 98.3% SpI, and 98.1% AccI for macula region segmentation, Jabbar et al.19 obtained 96.3% SeI, 96.8% SpI, and 96.9% AccI for macula region segmentation, Liu et al.20 obtained 95.9% SeI, 96.3% SpI, and 96.7% AccI for macula region segmentation, Nagaraja Gundluru et al. obtained 94.2% SeI, 93.9% SpI, and 95.2% AccI for macula region segmentation, Bader Alazzam et al. obtained 93.1% SeI, 93.2% SpI, and 94.8% AccI for macula region segmentation, ZeSi et al. obtained 93.8% SeI, 92.9% SpI, and 93.2% AccI for macula region segmentation, Tian et al. obtained 93.2% SeI, 92.1% SpI, and 93.1% AccI for macula region segmentation, Xue et al. obtained 93.2% SeI, 94.9% SpI, and 94.1% AccI for macula region segmentation, and Chudzik et al. obtained 92.1% SeI, 94.2% SpI, and 94.3% AccI for macula region segmentation on MESSIDOR dataset.
The quantitative evaluation details of macula segmentation are given in Table 5 (on HRF dataset) with respect to other state-of-the-art methods, such as Arnay et al.,18 Jabbar et al.,19 Liu et al.,20 Nagaraja Gundluru et al., Bader Alazzam et al., ZeSi et al., Tian et al., Xue et al., and Chudzik et al., in terms of SeI, SpI, and AccI on the HRF dataset.
Arnay et al.18 obtained 98.3% SeI, 98.1% SpI, and 98.4% AccI for macula region segmentation, Jabbar et al.19 obtained 98.1% SeI, 97.9% SpI, and 98.1% AccI for macula region segmentation, Liu et al.20 obtained 97.6% SeI, 97.9% SpI, and 98.1% AccI for macula region segmentation, Nagaraja Gundluru et al. obtained 94.3% SeI, 94.9% SpI, and 95.2% AccI for macula region segmentation, Bader Alazzam et al. obtained 95.2% SeI, 95.8% SpI, and 96.1% AccI for macula region segmentation, ZeSi et al. obtained 96.2% SeI, 96.9% SpI, and 96.1% AccI for macula region segmentation, Tian et al. obtained 95.9% SeI, 95.2% SpI, and 95.9% AccI for macula region segmentation, Xue et al. obtained 94.8% SeI, 94.2% SpI, and 94.8% AccI for macula region segmentation, and Chudzik et al. obtained 93.9% SeI, 93.1% SpI, and 93.2% AccI for macula region segmentation on HRF dataset.
Evaluation details of exudates segmentation
To evaluate the performance of the proposed exudate segmentation method, it was applied to a series of photographs from all open-access datasets. The segmentation results were then compared with the corresponding ground-truth images provided by the qualified ophthalmologists. The proposed method has been compared in terms of accuracy with other existing algorithms and has proven to be better for exudate segmentation results. The quantitative evaluation details of exudate pixel segmentation are given in Table 6 with respect to other state-of-the-art methods, such as Tian et al.,5 Xue et al.,6 and Chudzik et al.,7 Gundluru et al.,19 Bader Alazzam et al.,20 Ze Si et al.,21 in terms of SeI, SpI, and AccI on the MESSIDOR dataset. The proposed exudate segmentation method obtained 99.3% SeI, 99.2% SpI, and 99.2% AccI for the MESSIDOR dataset.
Quantitative comparison of the exudates segmentation with respect to SeI, SpI, and AccI on MESSIDOR dataset (computed at 97% confidence interval with 1.94σ).

Gundluru et al.19 obtained 95.9% SeI, 95.1% SpI, and 95.9% AccI for exudates lesions segmentation, Bader Alazzam et al.20 obtained 94.3% SeI, 94.9% SpI, and 94.7% AccI for exudates lesions segmentation, Ze Si et al.21 obtained 95.9% SeI, 94.2% SpI, and 93.2% AccI for exudates lesions segmentation, Tian et al.5 obtained 93.2% SeI, 93.9% SpI, and 93.2% AccI for exudates lesions segmentation, Xue et al.6 obtained 93.1% SeI, 93.1% SpI, and 92.8% AccI for exudates lesions segmentation, and Chudzik et al.7 obtained 92.9% SeI, 92.1% SpI, and 91.2% AccI for exudates lesions segmentation on MESSIDOR dataset.
The quantitative evaluation details of exudate pixel segmentation are given in Table 7 with respect to other state-of-the-art methods, such as Tian et al.,5 Xue et al.,6 and Chudzik et al.,7 Gundluru et al.,19 Bader Alazzam et al.,20 Ze Si et al.,21 in terms of SeI, SpI, and AccI on the HRF dataset. The proposed exudate segmentation method obtained 99.7% SeI, 99.3% SpI, and 99.1% AccI for the HRF dataset.
Quantitative comparison of the exudates segmentation with respect to SeI, SpI, and AccI on HRF dataset (computed at 97% confidence interval with 1.94σ).

Gundluru et al.19 obtained 94.9% SeI, 95.3% SpI, and 95.9% AccI for exudates lesions segmentation, Bader Alazzam et al.20 obtained 94.3% SeI, 95.9% SpI, and 95.8% AccI for exudates lesions segmentation, ZeSi et al.21 obtained 93.9% SeI, 93.7% SpI, and 93.7% AccI for exudates lesions segmentation, Tian et al.5 obtained 95.8% SeI, 95.9% SpI, and 96.2% AccI for exudates lesions segmentation, Xue et al.6 obtained 96.8% SeI, 95.8% SpI, and 95.1% AccI for exudates lesions segmentation, and Chudzik et al.7 obtained 95.3% SeI, 95.9% SpI, and 96.1% AccI for exudates lesions segmentation on HRF dataset.
Table 8 shows a quantitative comparison of exudate segmentation with respect to conventional machine learning classification methods on the MESSIDOR dataset. In this article, the proposed U-Net classifier for detecting and segmenting the exudates is compared with the machine learning methods SVM, Neural Networks (NN), Adaboost classifier, K-Nearest Network (KNN) classifier, Adaptive Neuro Fuzzy Inference System (ANFIS), and Co-Active Adaptive Neuro Fuzzy Inference (CANFIS) classification algorithms. The exudate detection system with the conventional SVM classifier obtained 90.2% SeI, 91.7% SpI, and 90.3% AccI; the NN classifier obtained 89.7% SeI, 88.9% SpI, and 88.4% AccI; the Adaboost classifier obtained 90.5% SeI, 90.1% SpI, and 90.3% AccI; the KNN classifier obtained 88.3% SeI, 88.2% SpI, and 85.6% AccI; the ANFIS classifier obtained 89.3% SeI, 89.2% SpI, and 90.1% AccI; and the CANFIS classifiers obtained 87.9% SeI, 88.3% SpI, and 87.9% AccI.
Quantitative comparison of the exudates segmentation with respect to conventional machine learning classification methods- MESSIDOR dataset (computed at 97% confidence interval with 1.94σ).

Table 9 presents a quantitative comparison between the traditional machine learning classification methods and exudate segmentation on the HRF dataset. In this article, the proposed U-Net classifier for detecting and segmenting the exudates is compared with the machine learning methods SVN, NN, Adaboost classifier, KNN classifier, ANFIS, and CANFIS classification algorithms. The exudate detection system with the conventional SVM classifier obtained 91.2% SeI, 91.6% SpI, and 91.3% AccI; the NN classifier obtained 90.8% SeI, 90.2% SpI, and 90.9% AccI; the Adaboost classifier obtained 87.3% SeI, 87.9% SpI, and 87.6% AccI; the KNN classifier obtained 91.7% SeI, 91.8% SpI, and 91.9% AccI; the ANFIS classifier obtained 86.9% SeI, 89.8% SpI, and 90.3% AccI; and the CANFIS classifier obtained 87.9% SeI, 88.3% SpI, and 89.6% AccI.
Quantitative comparison of the exudates segmentation with respect to conventional machine learning classification methods-HRF dataset (computed at 97% confidence interval with 1.94σ).
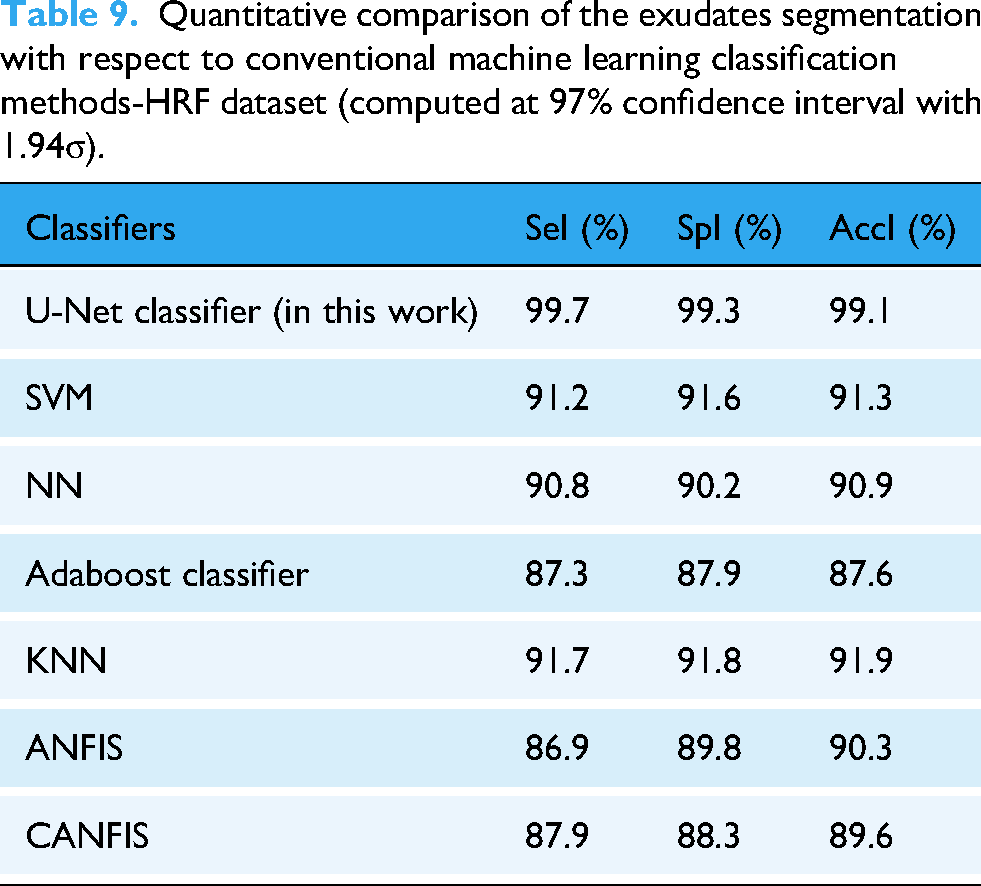
Table 10 presents a quantitative comparison of the exudate segmentation of the MESSIDOR dataset with that of the traditional deep-learning techniques. The conventional LeNet classifier obtained 93.9% SeI, 94.7% SpI, and 94.9% AccI; AlexNet-CNN obtained 94.8% SeI, 95.3% SpI, and 95.9% AccI; Inception-CNN obtained 95.2% SeI, 95.9% SpI, and 95.6% AccI; GoogleNet-CNN obtained 96.9% SeI, 96.5% SpI, and 96.6% AccI; and VGG obtained 96.6% SeI, 96.5% SpI, and 97.3% AccI.
Quantitative comparison of the exudates segmentation with respect to conventional deep learning methods-MESSIDOR dataset (computed at 97% confidence interval with 1.94σ).

Table 11 presents a quantitative comparison of exudate segmentation with respect to conventional deep-learning methods on the HRF dataset. The conventional LeNet classifier obtained 95.8% SeI, 95.9% SpI, and 96.1% AccI; AlexNet-CNN obtained 96.3% SeI, 96.9% SpI, and 96.3% AccI; Inception-CNN obtained 97.9% SeI, 97.3% SpI, and 97.1% AccI; GoogleNet-CNN obtained 97.3% SeI, 97.8% SpI, and 97.9% AccI; and VGG obtained 97.3% SeI, 97.5% SpI, and 97.6% AccI.
Quantitative comparison of the exudates segmentation with respect to conventional deep learning methods-HRF dataset (computed at 97% confidence interval with 1.94σ).
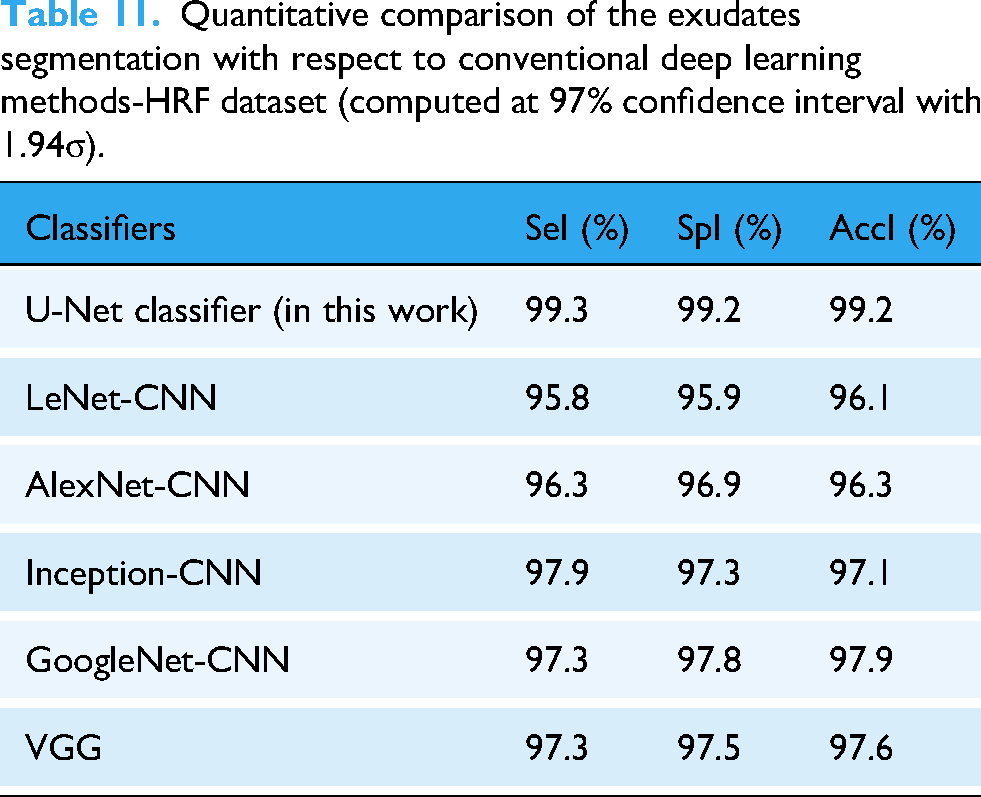
Figure 9 is the performance analysis of the proposed DR detection and grading system with respect to error rate and epochs. Here, the epoch ranges vary from 10 to 250. The epochs are inversely proportional to the error rate. Hence, the error rate of the proposed segmentation method is reduced when the epochs are increased. Figure 9(a) is the error rate graphical representation for MESSIDOR dataset, and Figure 9(b) is the error rate graphical representation for HRF dataset.
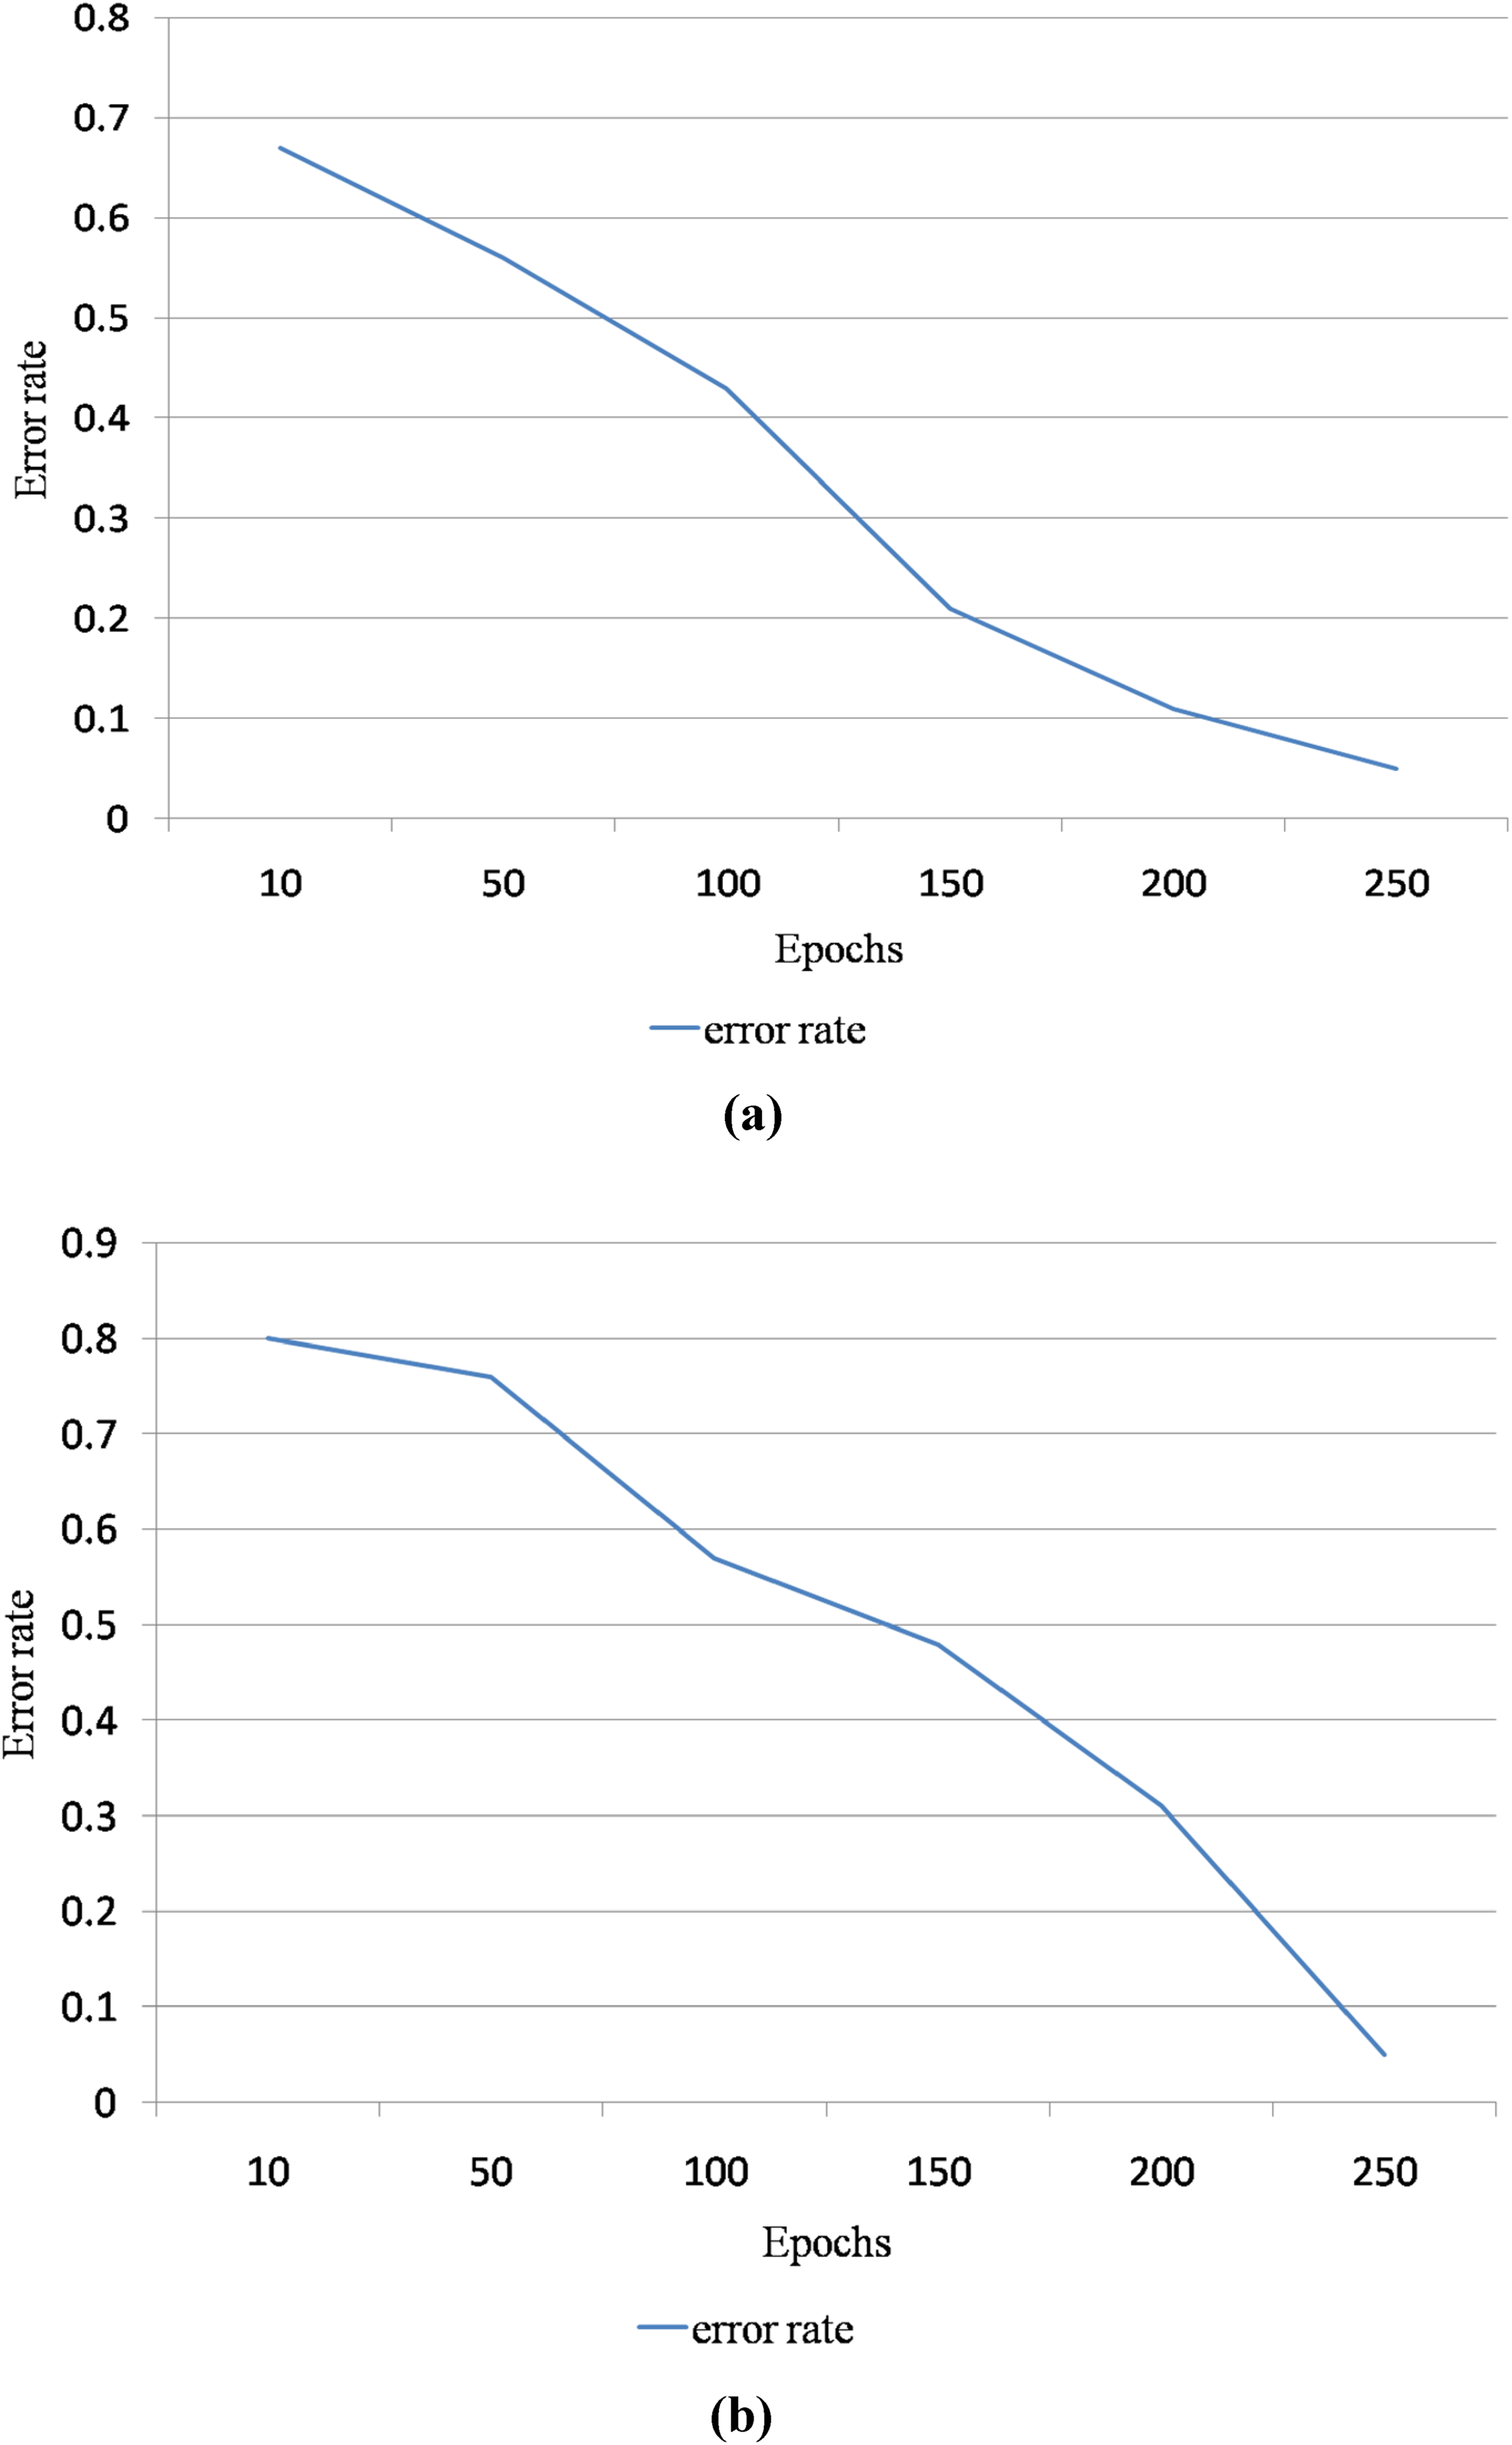
(a) Error rate graphical representation for Methods to Evaluate Segmentation and Indexing Techniques in the field of Retinal Ophthalmology (MESSIDOR) dataset with respect to epochs ranging from 10 to 250 (b) error rate graphical representation for High-Resolution Fundus (HRF) dataset with respect to epochs ranging from 10 to 250.
In order to strengthen the claims of generalizability of the proposed exudates and macula segmentation methods stated in the proposed method, the evaluations have been extended to few other retinal imaging datasets (Diabetic Retinopathy Database (DIARETDB1), FIRE, and RFMiD), as illustrated in Table 12 and Table 13.
Evaluation of proposed U-Net method on various fundus datasets (for the case of exudates segmentation).

*DIARETDB1 dataset provided by Kauppi et al.22: https://www.kaggle.com/datasets/nguyenhung1903/diaretdb1-v21
Evaluation of proposed bit-plane slicing method on various fundus datasets (for the case of macula segmentation).
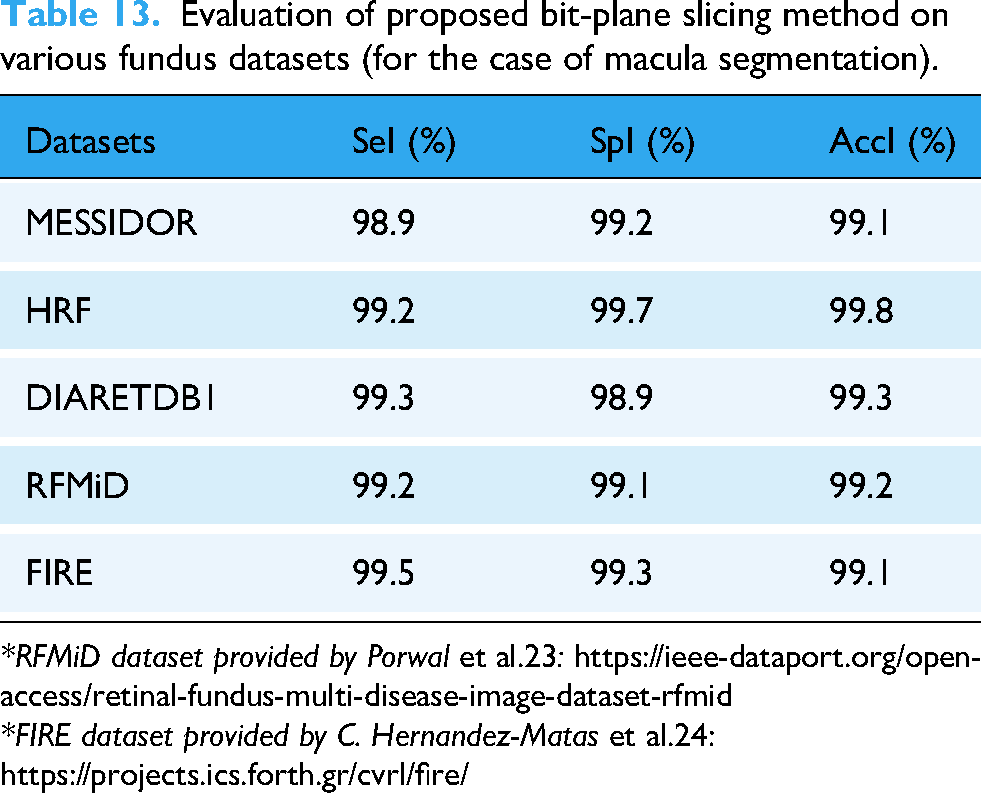
*RFMiD dataset provided by Porwal et al.23: https://ieee-dataport.org/open-access/retinal-fundus-multi-disease-image-dataset-rfmid
*FIRE dataset provided by C. Hernandez-Matas et al.24:
The Failure rate analysis of the proposed exudates segmentation is important to estimate its performance efficiency. In this paper, the false positive rate of each segmented exudate pixel is computed with respect to the ground truth retinal image (manually exudates segmented image by opthalmologist). Table 14 shows the failure rate analysis of the proposed exudates segmentation with respect to different retinal imaging datasets.
Failure rate analysis of the proposed exudates segmentation with respect to different retinal imaging datasets.

Diabetic retinopathy grading system
The severity of DR is categorized into five grades (No DR, Mild, Moderate, Severe, and Proliferative), based on the counts of exudates in the macula. A correlation between the macular region and exudate count was used in the early detection of DR. Severe DR is characterized by the formation of additional exudates in the macular region (covers more than 40% of the macular area), which results in severe blindness. For moderate DR conditions, the exudates cover 10%–40% of the macular region, which causes blindness. The proposed system achieved an average classification rate of 94% %for retinal images of the MESSIDOR dataset, as shown in Table 15.
Classification accuracy of DR diagnosis system in MESSIDOR dataset.

Table 15 shows the classification accuracy of the DR diagnosis system for the MESSIDOR dataset. The proposed DR diagnosis system stated in this work obtained a 94% classification rate for the normal category, 95% for the mild DR category, 96% for the moderate DR category, 91% for the severe DR category, and 100% for the Proliferative DR category. The average classification rate of the proposed DR diagnosis system was approximately 95.2% on the MESSIDOR dataset retinal images.
Table 16 shows the classification accuracy of the DR diagnosis system for the HRF dataset. The proposed DR diagnosis system achieved classification rates of 93.3% for the normal category, 87.5% for the mild DR category, 100% for the moderate DR category, and 100% for the severe DR categories and 100% for Proliferative DR category. The average classification rate of the proposed DR diagnosis system was approximately 96.1% for the HRF dataset retinal images.
Classification accuracy of DR diagnosis system in HRF dataset.

In this work, the computational time period and storage space have been evaluated for the proposed system and compared with other similar traditional systems on diverse datasets. Table 17 depicts the computational complexity analysis for DR diagnosis system.
Computational complexity analysis for DR diagnosis system.

Discussions
During the comparison stage, the same 60:40 training and testing ratio has been maintained for all state-of-the-art methods or algorithms. Hence, the experimental results of the proposed method can be compared with other state-of-the-art methods.
The segmentation and location determination of the macula region in the retinal images is quite complex task due to its low intensity region of pixels. Moreover, the difference of pixels in the macula region and its surrounding regions are having low intensity values. This proposed work has been tested on MESSIDOR dataset with respect to SeI, SpI, and AccI. These values are computed at 95% confidence interval with 1.96 standard deviation. From the detailed experimental analysis in Table 4, the proposed work has attained good resultant values when compared with the other similar conventional algorithms/methods on the same dataset retinal images at same confidence level. The purpose of testing the proposed work on this dataset is that the retinal images in this dataset are mostly belonging to the low-resolution category. If the proposed work resulted higher experimental values on the retinal images available in this dataset, it will surely give the best and stable experimental results on other higher resolution retinal imaging datasets. The reason behind this result achievement is that the proposed work used bit plane slicing algorithm combined with morphological process, which separates the bit planes of the retinal images and then locate the macula region of pixels using various dilation and erosion process. Moreover, the proposed macula region segmentation method obtained higher experimental results for the HRF dataset due to the implementation of bit plane slicing method on the region of pixels in the retinal image, as depicted in Table 5. The quantitative evaluation details of macula segmentation on both dataset retinal images are having higher experimental values and hence the proposed macula segmentation method through the bit plane slicing algorithm is most suitable for locating the macula region of pixels in all retinal images in both low- and high-resolution retinal imaging datasets.
Further, the segmentation of exudates in the retinal images is done through the U-Net CNN architecture. This proposed work has been tested on MESSIDOR and HRF datasets with respect to SeI, SpI, and AccI. These values are computed at 97% confidence interval with 1.94 standard deviation on both datasets. From the detailed experimental analysis in Table 6 (results of exudates segmentation on MESSIDOR dataset) and Table 7 (results of exudates segmentation on HRF dataset), the proposed work has attained good resultant values when compared with the other similar conventional algorithms/methods on the same dataset retinal images at same confidence level. Moreover, the performance of the exudates segmentation has been improved by properly tuned the hyper parameter values of the proposed U-Net CNN architecture in this work to reach the significant level of experimental values to detect the exudates pixels in the retinal images. The hyper parameter tuning along with more number of tunable and learning parameters improved the exudates detection accuracy on both retinal imaging datasets.
Though the proposed methodologies resulted higher experimental values for the detection and segmentation of both macula region and exudates, the obtained results must be verified and cross-validated by any statistical validation approach to verify its unbias condition with respect to different retinal imaging datasets.
The k-fold statistical validation test has been used in the proposed method to validate the experimental results of the proposed methodology on both dataset for DR grading system. In this work, 5-fold test has been carried out for evaluating the cross-validation of the obtained results for DR grading. Each fold contains 50 retinal images, and hence, 250 retinal images are validated through this method. The average classification rate obtained through this statistical validation test is around 94.1 for MESSIDOR dataset and average classification rate obtained through this statistical validation test is around 95.8 for MESSIDOR dataset. By comparing these results with the results in Table 10 and Table 11, the proposed system has been significantly validated.
However, the proposed exudates and macula region detection methods stated in this research work obtains higher segmentation result values, there are few limitations in this work and they are stated in the following points:
The DR can be graded in this work based on exudates formations in macula region of the retinal image. The other retinal abnormal lesions are not considered in this research work for DR detection and grading, as identified as the main limitation of this work. The retinal images which are used in this research work are obtained from high-resolution retinal imaging datasets. The low-resolution retinal imaging datasets are not considered in this research work. The resource utilization analysis has not been done in this research work.
Conclusions
A screening and diagnosis system for DR is proposed in this study to save vision over time. This disorder can be diagnosed by detecting exudates in retinal images and analyzing their relationship with the macular region. The proposed macula and exudate segmentation algorithms stated in this article were evaluated on the MESSIDOR and HRF datasets with ground truth images. Retinal blood vessels are not observed in the macular region. Hence, this segmented blood vessel and bit-plane morphological slicing technique was used to detect the macular region. Kirsch's edge detector and binary mathematical morphological operations were used to detect and extract exudates from the retinal images. The proposed macular region segmentation method obtained 98.9% SeI, 99.2% SpI, and 99.1% AccI for the MESSIDOR dataset. The proposed macular region segmentation method obtained 99.2% SeI, 99.7% SpI, and 99.8% AccI for the HRF dataset. The proposed exudate segmentation method obtained 99.3% SeI, 99.2% SpI, and 99.2% AccI for the MESSIDOR dataset. The proposed exudate segmentation method obtained 99.7% SeI, 99.3% SpI, and 99.1% AccI for the HRF dataset. Using the techniques suggested in this article, this study can be expanded to identify glaucoma by using retinal scans.
The ethical implications for the automated diagnosis in healthcare system are given in the following points.
Bias: The developed algorithms have been biased in accordance with the training of the classifier for producing the discriminatory results. Confidentiality: The developed algorithms do not display or store any personal information of the patient being inspected or screened for DR detection. Transparency: The bias of the proposed system will be failed due to the in transparency. Data storage: All acquired information of the patient details along with the grading levels of DR are stored in a system with two-step protection approach.
The future scopes of this research work are stated below.
The proposed DR detection and grading methods stated in this work will be implemented and tested on low-resolution retinal images in future in order to validate the bias condition.
The impact of the DR over Glaucoma will be analyzed in future. The experimental results of the proposed method will be improved by implementing advanced deep learning techniques in order to improve the segmentation results. The grading DR will be done by considering both soft and hard exudates along with the hemorrhage lesions in future implementation.
Footnotes
Acknowledgements
This study was funded in part by a Molloy University research grant. The authors would like to thank all our universities, institutes, and organizations for their time and support in this study.
Author's note
K. Martin Sagayam is also affiliated with Department of ECE, SRM TRP Engineering College, SRM Group of Institution, Trichy, India.
Contributorship
DR and HD conceived and designed the research, and DR, SK, KS, and HD wrote the first draft of the manuscript. DR and HD contributed significantly to the writing process. All the authors have revised the manuscript accordingly. All authors have read and approved the final version of the manuscript.
Funding
This study was funded in part by a Molloy University research grant. Molloy University, (grant number: 2025-2026).
Declaration of conflicting interests
The authors declared no potential conflicts of interest with respect to the research, authorship, and/or publication of this article.
Data availability
The data or images used in this study were obtained from the following links. MESSIDOR dataset, provided by the Messidor program partners: https://www.adcis.net/en/third-party/messidor/; HRF dataset provided by Budai et al.: https://www5.cs.fau.de/research/data/fundus-images/; DIARETDB1 dataset provided by Kauppi et al.: https://www.kaggle.com/datasets/nguyenhung1903/diaretdb1-v21; RFMiD dataset provided by Porwal et al.: https://ieee-dataport.org/open-access/retinal-fundus-multi-disease-image-dataset-rfmid; FIRE dataset provided by Hernandez-Matas et al.: ![]()
Guarantor
HD.