
Abstract
Objective
This study aimed to investigate the relationship between serum vitamin D (Vit D) levels and the risk of mortality among adults with H-type hypertension, a subtype of hypertension characterized by elevated homocysteine (Hcy) levels.
Methods
This retrospective analysis utilized NHANES 2001 to 2006 to examine associations of Vit D and Hcy with mortality in hypertensive adults overall (n=5459), followed by targeted analyses in H-type hypertension (n=2276). The primary endpoints of the study were all-cause mortality and cardiovascular disease mortality, with follow-up through 2019. Weighted multivariable Cox models, mediation analyses, restricted cubic splines, and machine-learning validation were conducted.
Results
In the overall hypertensive cohort, H-type hypertension had lower Vit D and higher mortality than non-H-type. Higher Vit D was inversely associated with mortality. Joint risk analysis showed greater risk reduction with Vit D>50 nmol/L and Hcy<10 μmol/L than with either factor alone. Hcy was a mediating factor in the relationship between Vit D and mortality. In H-type hypertension, Vit D showed a linear inverse association with mortality. Vit D was identified as an important variable through LASSO regression for feature selection. Five machine learning models were constructed, and three of them performed well in predicting mortality. Among Vit D-deficient individuals with H-type hypertension, engagement in moderate to vigorous activity was associated with a reduced risk of mortality.
Conclusion
Higher serum Vit D levels linked to lower mortality risk in hypertension patients, including H-type hypertension, with significantly higher risk in severe deficiency (<25 nmol/L).
Keywords
Introduction
Hypertension is a widespread cardiovascular disease (CVD) and a major contributor to the increasing morbidity and mortality rates globally. 1 Homocysteine (Hcy) is closely linked to the pathogenesis of various CVD, including atherosclerosis, hypertension, stroke, abdominal aortic aneurysm, and vascular calcification. 2 H-type hypertension is a distinct form of hypertension, diagnosed when serum Hcy levels exceed 10 µmol/L in hypertensive patients. 3 This type of hypertension not only shares the typical characteristics of hypertension but also increases the risk of cardiovascular and cerebrovascular events due to the elevated Hcy levels, presenting additional challenges in treatment and management due to its complex pathophysiological mechanisms. 3
Vitamin D (Vit D), a steroid hormone often referred to as the sunshine hormone, is estimated to be insufficient in 30–50% of the global population. 4 Vit D assumes a variety of critical functions within the cardiovascular system, and it has been well-established that its deficiency is associated with an array of cardiovascular risk factors, including diabetes mellitus (DM) and hypertension, as well as with serious CVD such as coronary heart disease (CHD) and heart failure (HF).5,6 By binding to the Vit D receptor (VDR), Vit D may confer cardiovascular protection. Mechanistically, it can lower Hcy through Nrf2-mediated activation of methionine synthase. 7 Existing evidence supports a clear association between Vit D deficiency and elevated Hcy. 8 However, most studies have examined Vit D with hypertension or Vit D with Hcy in isolation, so the triadic relationship among them remains insufficiently defined. Additionally, the potential of machine learning techniques in evaluating the relationship between Vit D and long-term mortality in the H-type hypertension population has yet to be fully explored.
The National Health and Nutrition Examination Survey (NHANES) is a comprehensive, longitudinal study that captures the health and nutritional status of the US population. Using data from the 2001–2006 cycles, we examined the baseline association between serum Vit D and Hcy and evaluated their respective relationships with all-cause and CVD mortality among adults with hypertension. We then focused on patients with H-type hypertension to assess the association between serum Vit D levels and prognosis and to test whether healthier lifestyles modify the relationship between Vit D deficiency and mortality. The findings of this study are anticipated to provide valuable insights for the prevention and treatment of CVD.
Materials and methods
Data source
This study was a retrospective observational study conducted in the United States. Data were derived from NHANES, conducted by the National Center for Health Statistics (NCHS) under the US Centers for Disease Control and Prevention (CDC). NHANES aims to provide a comprehensive assessment of the health and nutritional status of a representative sample of the US population. The survey utilized a multi-stage, stratified, and cluster sampling design, covering the civilian population. It includes detailed interviews, laboratory testing, and physical examinations. The NHANES protocol was approved by the NCHS Ethics Review Board, and all participants provided written informed consent. All NHANES data used in this study were publicly available and de-identified, and therefore no additional permission or institutional review board approval was required.
Study participants
The NHANES dataset includes participant information from 1999 to 2018. However, since records containing both Hcy and Vit D data are only available for the period between 2001 and 2006. Data for this study were collected from 2001 to 2006, and we integrated data from three NHANES cycles (N = 31509).
Hypertension was diagnosed based on self-reported physician diagnosis, with an average of three systolic blood pressure readings ≥ 140 mmHg or an average of three diastolic blood pressure readings ≥ 90 mmHg, and the patient was currently receiving antihypertensive medication. This study enrolled hypertensive participants aged ≥18 years and excluded non-hypertensive individuals and participants with missing Vit D, Hcy, or mortality data, yielding a final sample of 5459 hypertensive patients.
H-type hypertension was defined as hypertension with serum Hcy levels exceeding 10 µmol/L. 3 From the hypertensive cohort, we further identified 2276 participants with H-type hypertension. Supplemental Figure 1 illustrates the complete process of selecting the final study sample from the original dataset.
Vitamin D
Currently, there is no universally accepted standard for assessing Vit D status. The clinical practice guidelines of the Endocrine Society provide a classification system for serum Vit D levels, defining severe deficiency as less than 25.00 nmol/L, deficiency as 25.00–49.99 nmol/L, insufficiency as 50.00–74.99 nmol/L, and adequacy as 75.00 nmol/L or higher. 9
Study endpoints
The endpoints of this study include all-cause mortality and CVD mortality, with CVD mortality encompassing diseases of heart and cerebrovascular diseases. To assess mortality status in the follow-up population, the study used the NHANES public-use linked mortality files from 2001 to 2018. Participants’ survival status was tracked through 31 December 2019. The MORTSTAT variable was used to determine participants’ survival status. Mortality data for CVD were classified according to the International Classification of Diseases, 10th Revision (ICD-10) codes (I00-I09, I11, I13, I20-I51, I60-I69). Follow-up time was defined as the number of months from the examination at the Mobile Examination Center to the end of the all-cause mortality follow-up period (31 December 2019), as determined by the permth_exm variable.
Study covariates
This study included a range of demographic and clinical variables as covariates, including age, gender, race, education level, marital status, family income-to-poverty ratio (PIR), smoking status, alcohol consumption, moderate to vigorous activity (MVA), healthy eating index (HEI), body mass index (BMI), DM, dyslipidemia, HF, CHD, stroke, and serum levels of vitamin B12 and folate. The definitions of covariates are detailed in the Supplemental Methods.
Statistical analysis
Consistent with NHANES analytic guidelines addressing complex survey design, all analyses excluding machine learning-related components were weighted. According to the NHANES protocol, the data were weighted using the wtmec2yr variable. And missing values were imputed using the k-nearest neighbor (KNN) method.
Continuous variables were assessed for normality using the Lilliefors Test. Continuous variables were presented as means ± standard deviation (SD) for those with a normal distribution, or as medians and interquartile ranges (IQR) for those exhibiting a skewed distribution. Categorical variables were expressed as frequencies and percentages. For two-group comparisons, normally distributed continuous variables were analyzed with Student's t test, non-normally distributed continuous variables with the Mann–Whitney U test, and categorical variables with the chi-square test. For comparisons involving more than two groups, non-normally distributed continuous variables were analyzed with the Kruskal–Wallis test, normally distributed continuous variables with one-way analysis of variance, and categorical variables with the chi-square test.
Cox proportional hazards models were applied to estimate the hazard ratios (HRs) and 95% confidence intervals (CIs) for all-cause mortality and CVD mortality associated with serum Vit D levels in the hypertensive cohort. Three models were fitted. Model 1 was unadjusted. Model 2 adjusted for age, sex, and race. Model 3 additionally adjusted for education, PIR, marital status, smoking, alcohol use, MVA, HEI, BMI, diabetes, dyslipidemia, CHD, stroke, folate, and vitamin B12. To assess effect modification of the Hcy–mortality association by Vit D, participants were stratified by Vit D deficiency (<50 nmol/L) versus non-sufficiency (≥50 nmol/L) and by Hcy >10 μmol/L versus ≤10 μmol/L. The CMAverse R package was employed to conduct a regression-based causal mediation analysis, evaluating the potential mediating role of Hcy in the relationship between Vit D levels and mortality.
In the H-type hypertension cohort, Kaplan-Meier (KM) survival curves and log-rank tests were used to compare survival across Vit D categories. Associations between serum Vit D and mortality were estimated with Cox proportional hazards models. Non-linearity was assessed using restricted cubic splines (RCS) with three knots.
Two sensitivity analyses were performed. First, complete-case analyses were conducted to avoid imputation bias due to missing data. Second, subgroup analyses were performed according to age (≤ 60 years and >65 years), gender (male and female), race (non-Hispanic white, non-Hispanic black, Mexican American, and other races), education (less than high school, and high school graduate or higher education), PIR (< 1 and ≥ 1), marital status (married/cohabiting, and widowed/divorced/separated/never married), smoking status (never smoker, former smoker, and current smoker), alcohol consumption (non-drinker, former drinker, and current drinker), BMI (< 28 and ≥ 28), DM (yes/no), dyslipidemia (yes/no), HF (yes/no), CHD (yes/no), and stroke (yes/no). In addition, the multiplicative interaction was also evaluated by comparing the models with and without the cross-product interaction terms through the likelihood ratio test.
To further investigate, six prognostic models were developed to predict all-cause and CVD mortality in H-type hypertension patients, including a traditional Cox regression model and five machine learning models (Random Survival Forest [RSF], 10 Gradient Boosting Machine [GBM], 11 Survival Support Vector Machine [Survivalsvm], 12 Extreme Gradient Boosting [Xgboost], 13 Supervised Principal Components [Superpc]). 14 Hyperparameter details are provided in Supplemental Table 1. The dataset was randomly split into trainset (70%) and testset (30%). Data preprocessing included normalization and one-hot encoding. Least Absolute Shrinkage and Selection Operator (LASSO) regression was applied for feature selection. Time-dependent area under the receiver operating characteristic curve (t-AUC) evaluated discrimination ability, while the integrated Brier score (iBrier) assessed calibration. All metrics’ 95% confidence intervals (95% CIs) were calculated using 1000 bootstrap resampling iterations.
To assess the modifying effects of MVA and healthy diet (two components of Life's Essential 8 15 ) on the relationship of Vit D and mortality, participants were stratified by Vit D status and health behavior profiles. Sleep metrics were excluded from this analysis due to excessive missingness (>80%). Vit D status was dichotomized as deficient versus sufficient. The HEI was categorized using median cutoffs.
All statistical analyses were conducted using R software version 4.4.0, and a p-value of <0.05 was considered statistically significant.
Results
Association of serum vitamin D levels with mortality and homocysteine in hypertension participants
A total of 5459 patients with hypertension were included. Data were imputed using the KNN method, and there were no significant changes in the overall levels before and after imputation (all p > 0.05, Supplemental Table 2), indicating the effectiveness of the imputation method.
Participants were classified into non-H-type and H-type hypertension groups according to whether Hcy was >10 μmol/L. Baseline characteristics, presented in Supplemental Table 3, show that the H-type hypertension group had lower serum Vit D levels than the non-H-type group (p = 0.008).
Compared with the non-H-type group, patients with H-type hypertension had higher all-cause and CVD mortality (logRank p < 0.001, Supplemental Figure 2 and Supplemental Table 4). In the fully adjusted model, Hcy analyzed as a continuous variable was associated with all-cause mortality and CVD mortality. Compared with the non-H-type group, the H-type group had higher HRs for all-cause and CVD mortality (Supplemental Table 5). Similarly, when Vit D was modeled as a continuous variable, it was also associated with all-cause and CVD mortality. Relative to the Vit D severe deficiency group, the other three Vit D categories had lower HRs for all-cause and CVD mortality (Supplemental Table 6).
Building on these findings, we then conducted a joint risk analysis. Participants with H-type hypertension and Vit D deficiency were designated as the reference group and exhibited the highest mortality risk. Among participants with H-type hypertension but Vit D >50 nmol/L, HRs for mortality were significantly lower. Moreover, when both protective factors (Vit D >50 nmol/L and Hcy < 10 µmol/L) were present, the reduction in mortality risk was more pronounced than with either factor alone (Figure 1(A)).

The combined association of homocysteine (Hcy) and serum vitamin D (Vit D) with mortality. (A) The combined association of Hcy and Vit D with all-cause and cardiovascular disease (CVD) mortality. (B-C) The mediating proportion of Hcy on the associations between Vit D and all-cause (B) and CVD mortality (C).
Serum Vit D levels were significantly associated with Hcy concentrations (Supplemental Table 7). To further examine the potential mediating role of Hcy in the association between Vit D and mortality, we conducted causal mediation analyses. Hcy showed a significant mediating effect in the association between Vit D and all-cause mortality, with a proportion mediated of 6.0% (p < 0.001, Figure 1(B)), and in the association between Vit D and CVD mortality, with a proportion mediated of 3% (p < 0.001, Figure 1(C)).
Baseline characteristics of participants with H-type hypertension
We further focused the analysis on patients with H-type hypertension to evaluate the impact of Vit D. A total of 2276 patients with H-type hypertension were included in this analysis. The average age of participants was 63.3 ± 15.0 years, with 55% of the participants being male (n = 1321). In the higher Vit D groups, participants were more likely to be male, non-Hispanic White, non-smokers, non-obese, and individuals with MVA (all p < 0.05, Table 1). They tended to have higher educational attainments, higher income levels, and were more likely to be married or living with a partner (all p < 0.05, Table 1). Furthermore, their HEI and serum folate levels were higher (all p < 0.05, Table 1). Notably, patients with higher Vit D levels had a lower prevalence of HF (p < 0.05, Table 1). However, there were no significant differences between the four groups in terms of age, alcohol consumption, DM, dyslipidemia, CHD, or stroke (all p > 0.05, Table 1).
Baseline characteristics of participants with H-type hypertension according to serum vitamin D concentrations.

N Missing (unweighted).
Mean ± SD; n (unweighted) (%); Median (Q1, Q3).
PIR: family income-to-poverty ratio; MVA: moderate to vigorous activity; HEI: healthy eating index; BMI: body mass index; DM: diabetes mellitus; CHD: coronary heart disease; HF: heart failure.
Association of serum vitamin D with mortality among participants with H-type hypertension
During a median follow-up of 163 (90, 194) months of 2276 patients with H-type hypertension, a total of 1423 patients (52%) died, including 515 (18%) from cardiovascular causes (Table 2). KM survival curves showed that patients with higher Vit D levels had a lower all-cause mortality rate (logRank p = 0.018, Figure 2(A)). Compared to patients with severe Vit D deficiency, those in other Vit D groups appeared to have lower CVD mortality, but the difference was not statistically significant (logRank p = 0.053, Figure 2(B)).

Kaplan-Meier survival curve according to serum vitamin D (Vit D) concentrations. (A) Kaplan-Meier survival curve for all-cause mortality. (B) Kaplan-Meier survival curve for cardiovascular disease (CVD) mortality.
Prognostic information of participants with H-type hypertension according to serum vitamin D concentrations.

Median (Q1, Q3); n (unweighted) (%).
CVD: cardiovascular disease.
When Vit D was treated as a continuous variable, it was associated with both all-cause mortality and CVD mortality. After multivariable adjustment in Model 3, the HRs and 95% CIs for all-cause mortality across increasing serum Vit D categories (<25.00, 25.00–49.99, 50.00–74.99, and ≥75.00 nmol/L) were 1.00 (reference), 0.768 (0.580, 1.017), 0.647 (0.481, 0.870), and 0.597 (0.425, 0.839), respectively (p for trend = 0.004). For CVD mortality, the HRs were 1.00 (reference), 0.694 (0.483, 0.998), 0.594 (0.405, 0.871), and 0.515 (0.336, 0.789), respectively (p for trend = 0.015).
The results of the RCS analysis based on multivariable-adjusted model 3 showed no nonlinear relationship between Vit D and all-cause or CVD mortality in patients with H-type hypertension (Figure 3). Low Vit D levels were associated with an increased risk of both all-cause and CVD mortality in this population, which was consistent with the results from the weighted Cox regression analysis.

Association between vitamin D (Vit D) concentration and all-cause (A) and cardiovascular disease (CVD) mortality (B) in patients with H-type hypertension based on multivariable-adjusted model 3.
To comprehensively explore the robustness of the relationship between Vit D levels and the prognosis of patients with H-type hypertension, we conducted a complete-case analysis after excluding participants with missing data. Similar results were observed among the 1639 participants included (Supplemental Table 8).
In addition, we conducted subgroup analyses to sensitivity validation. Subgroup analysis based on multivariable-adjusted Model 3 revealed that serum Vit D was significantly associated with all-cause mortality or CVD mortality in most subgroups. Notably, the interaction between serum Vit D and HF was significant (p for interaction = 0.006, Supplemental Figure 3), suggesting that HF may modulate the effect of serum Vit D on survival in patients with H-type hypertension. Further analysis revealed a differential effect of serum Vit D levels on CVD mortality between the HF and non-HF subgroups (p for interaction = 0.042, Supplemental Figure 4). It is also noteworthy that the interaction between age and serum Vit D in relation to CVD mortality was statistically significant (p for interaction = 0.038, Supplemental Figure 4), suggesting that age and HF may be important factors influencing the relationship between serum Vit D and CVD mortality.
Construction of survival-related machine learning models among participants with H-type hypertension
Feature selection via LASSO regression in the trainset identified 12 predictive variables for model construction, including serum Vit D concentration (Supplemental Table 9 and Supplemental Figure 5). Figure 4(A) demonstrates the AUC values of five machine learning models in the trainset, while Figure 4(B) presents corresponding validation set performance (Table 3). Both all-cause and CVD mortality prediction achieved clinically significant accuracy, with Cox, RSF, GBM, and Xgboost models maintaining AUC >0.8 and iBrier scores <0.2 across temporal evaluations (Table 4 and Supplemental Tables 10–17).
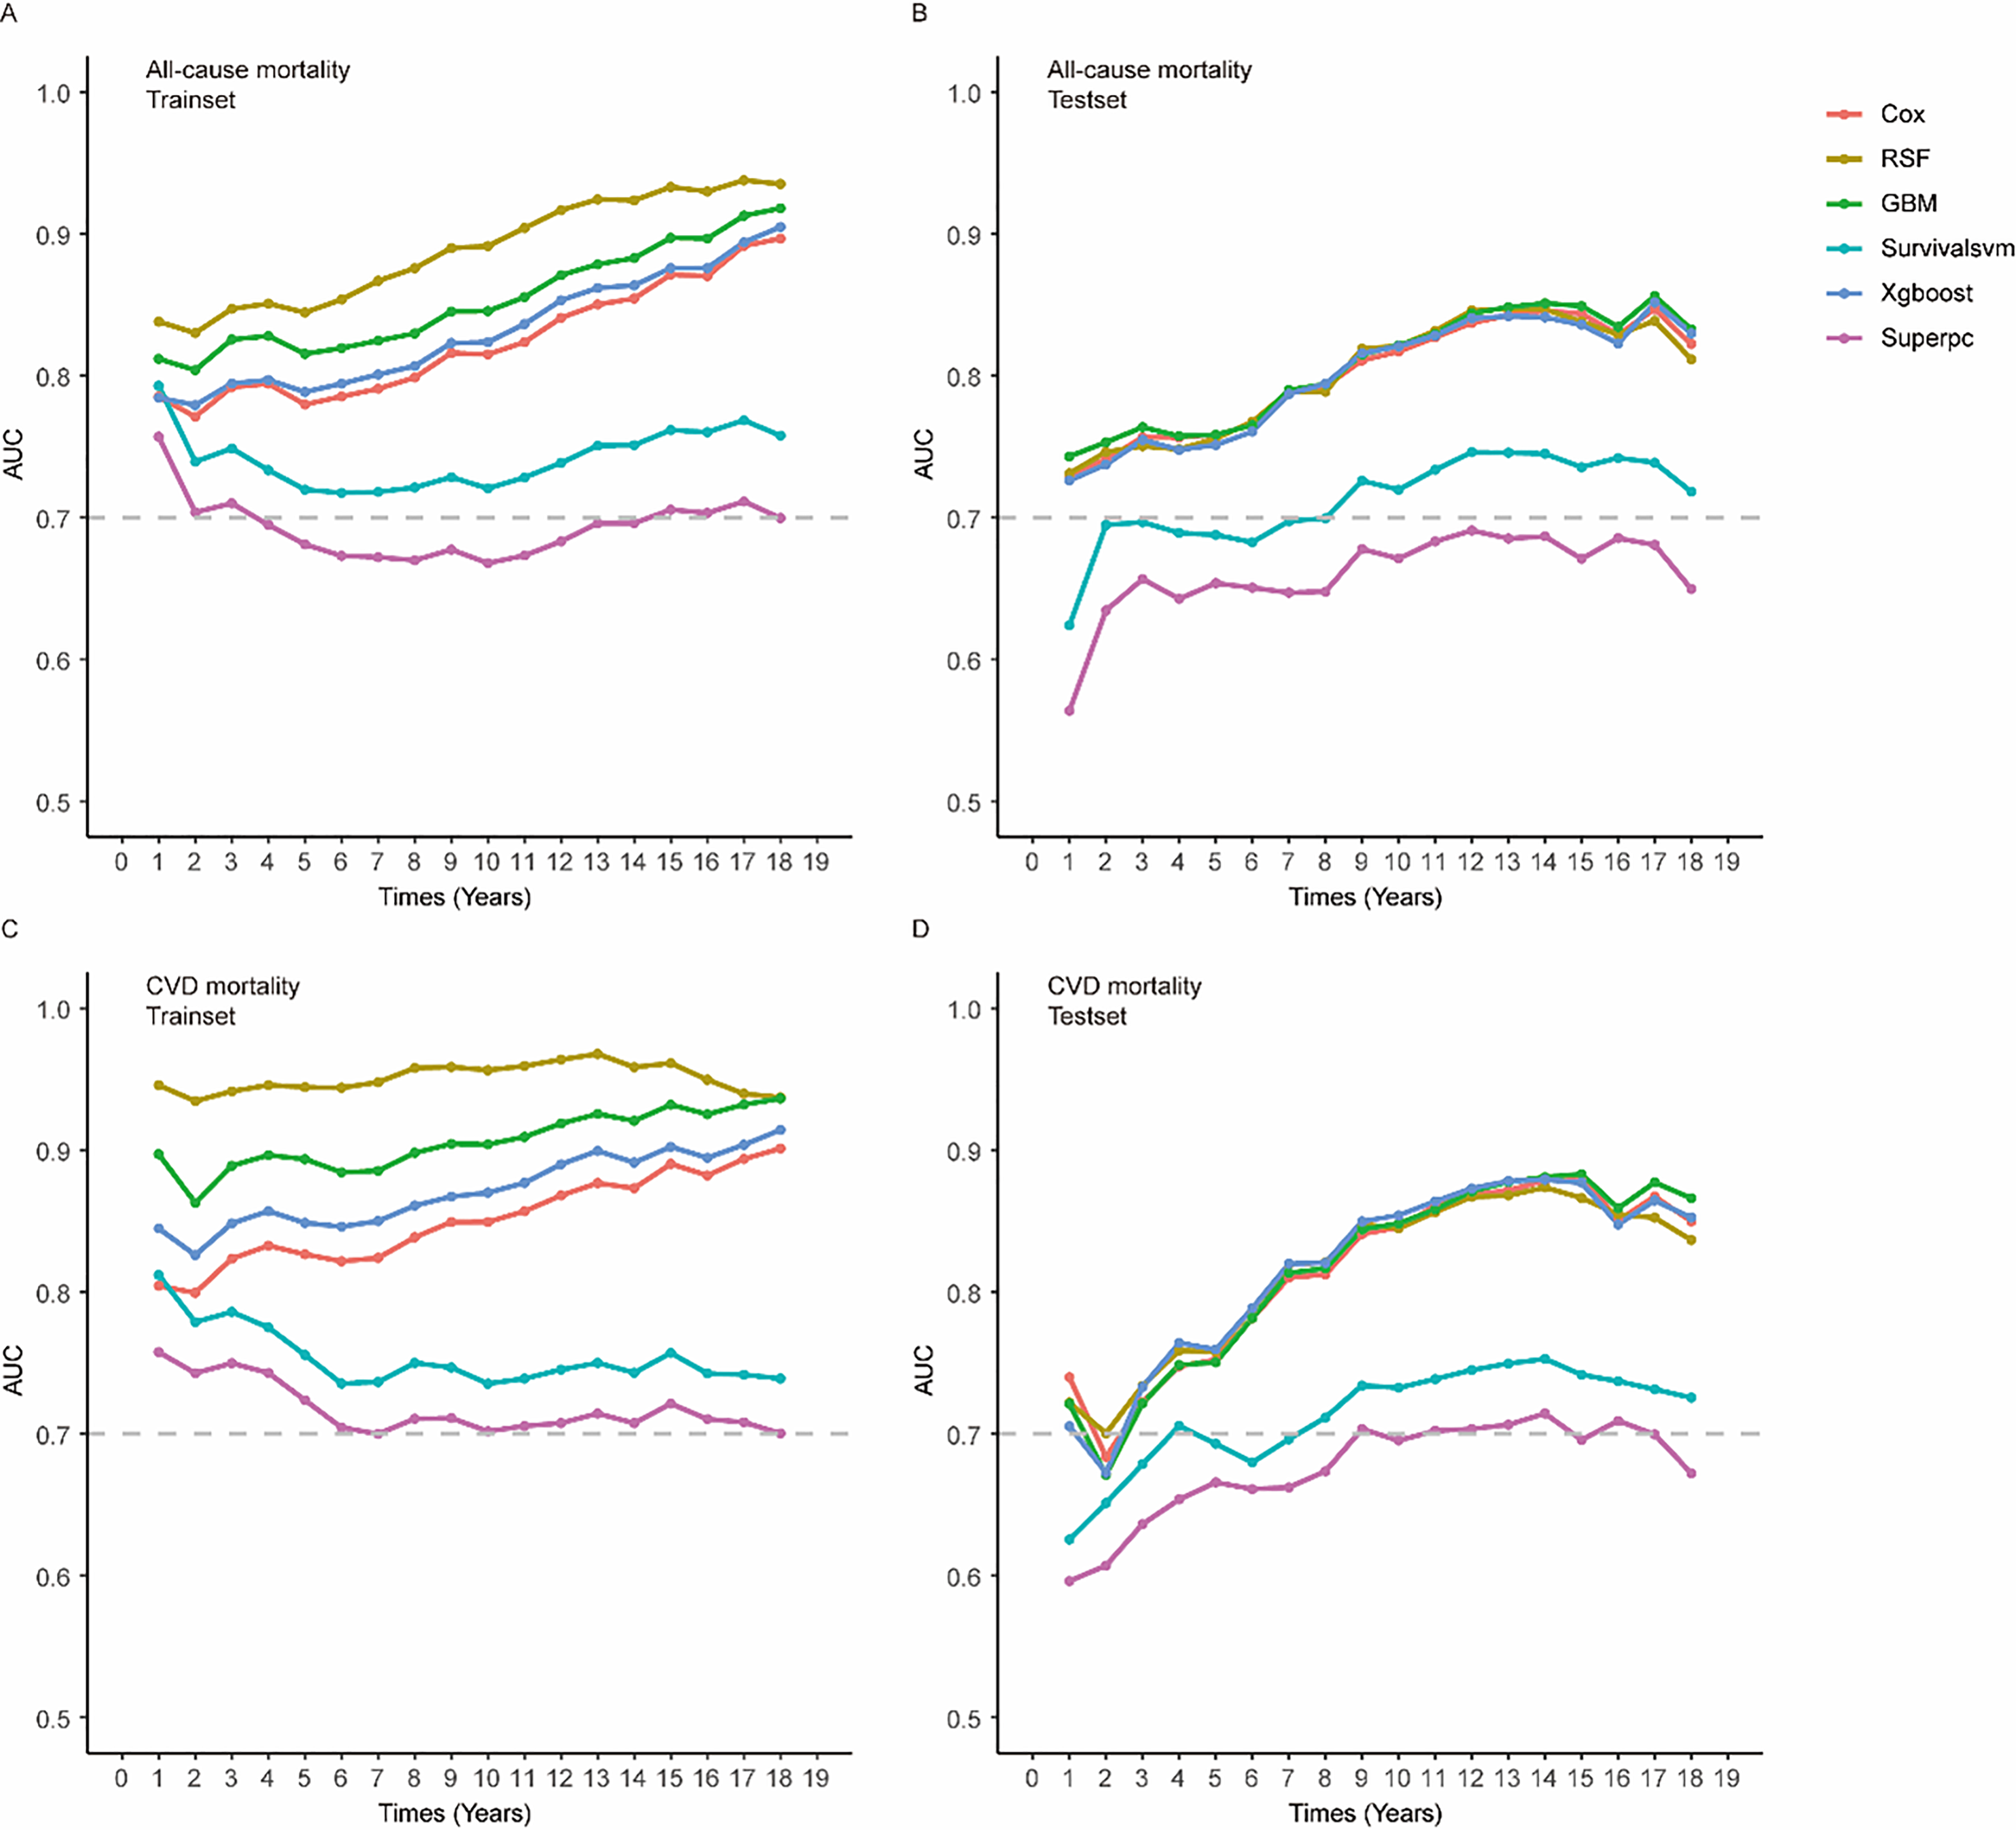
The time-dependent area under the receiver operating characteristic curve (t-AUC) for predicting all-cause and cardiovascular disease (CVD) mortality of various models in trainset and testset. (A) t-AUC for predicting all-cause mortality of various models in trainset. (B) t-AUC for predicting all-cause mortality of various models in testset. (C) t-AUC for predicting CVD mortality of various models in trainset. (D) t-AUC for predicting CVD mortality of various models in testset.
HRs (95% CIs) for mortality according to serum vitamin D concentrations among participants with H-type hypertension.

Model 1 was unadjusted for any covariates.
Model 2 was adjusted for age, gender, and race.
Model 3 was further adjusted for education levels, family income-to-poverty ratio, marital status, smoke status, alcohol consumption, moderate to vigorous activity, healthy eating index, body mass index, diabetes mellitus, dyslipidemia, coronary heart disease, and stroke, folate, and vitamin B12.
Vit D: vitamin D; CVD: cardiovascular disease.
Overall survival prediction performance.

CVD: cardiovascular disease.
Moderate to vigorous activity modifying the vitamin D deficiency–mortality association among participants with H-type hypertension
Participants with Vit D deficiency and unhealthy behaviors exhibited the highest all-cause mortality risk (reference group). Those with Vit D deficiency engaging in MVA showed a significantly attenuated hazard ratio (HR=0.744, 95% CI: 0.592–0.936). In contrast, no significant risk reduction was observed in Vit D-deficient individuals with higher HEI scores (Figure 5). Neither MVA participation nor elevated HEI significantly attenuated cardiovascular mortality risk in Vit D-insufficient populations.

The combined association of health behaviors and serum vitamin D (Vit D) with mortality. (A) The combined association of healthy eating index and Vit D with all-cause and cardiovascular disease (CVD) mortality. (B) The combined association of moderate to vigorous activity (MVA) and Vit D with all-cause and CVD mortality.
Discussion
In our study, we utilized data from NHANES (a nationally representative sample of the US population) to examine the relationship between serum Vit D and Hcy, and assessed their associations with long-term mortality among individuals with hypertension, with a particular focus on the high-risk subtype of H-type hypertension. The results indicate that patients with H-type hypertension had significantly lower serum Vit D levels and higher risks of all-cause and CVD mortality. In stratified analyses restricted to H-type hypertension, higher serum Vit D levels were linearly and inversely associated with both all-cause and CVD mortality, and the highest risk was observed among those with Vit D severe deficiency (<25.00 nmol/L).
In this cohort, Vit D concentrations were notably lower in H-type hypertension. Prior research has demonstrated that Vit D deficiency is associated with elevated Hcy levels, 8 providing a rationale to explore their potential joint impact. Our analyses further showed that both Hcy and Vit D independently predicted prognosis in individuals with hypertension, consistent with earlier findings that elevated Hcy aggravates vascular injury16,17 and that Vit D deficiency worsens outcomes in hypertension.18,19
In the joint risk analysis, the H-type hypertension plus Vit D deficiency group was the reference and had the highest mortality risk. Among patients with H-type hypertension, Vit D >50 nmol/L was associated with a significantly lower mortality hazard. Moreover, the combination of Vit D >50 nmol/L and Hcy <10 μmol/L conferred greater risk reduction than either factor alone, indicating a joint protective effect. Serum Vit D levels were significantly correlated with Hcy concentrations, and mediation analysis indicated that Hcy partially mediated the association between Vit D and mortality. Mechanistically, Vit D may bind to the VDR and activate Nrf2-mediated methionine synthase activity, thereby promoting Hcy metabolism and, in part, lowering mortality risk. 7
Further investigation in this specific population is warranted. Our study found that compared to patients with H-type hypertension whose serum Vit D levels were <25.00 nmol/L, those with higher serum Vit D levels exhibited significantly lower all-cause and CVD mortality. This finding aligns with the results of studies investigating the relationship between Vit D and mortality in patients with hypertension.18,19 Moreover, similar findings have been reported in other high-risk populations, such as postmenopausal women, osteoarthritis patients, and individuals with DM, indicating that lower Vit D levels are associated with higher mortality risk.20–22 It is noteworthy that existing randomized controlled trials (RCTs) of Vit D supplementation have primarily enrolled general hypertensive populations or participants without severe Vit D deficiency and, overall, have not demonstrated reductions in all-cause or CVD mortality.23,24 Against this background, our findings emphasize the importance of focusing on Vit D severe deficiency and on the H-type hypertension subtype, which has been insufficiently investigated in prior RCTs.
A previous study has demonstrated a linear inverse association between serum Vit D levels and all-cause/CVD mortality in diabetic populations in diabetic populations, 20 while others have reported nonlinear dose-response relationships.21,22 Notably, research in the hypertensive population indicated that lower serum Vit D concentrations were associated with an increased risk of all-cause mortality, with an apparent threshold effect. 18 These findings partially diverge from our current results, which demonstrate a linear relationship between serum Vit D levels and both all-cause and CVD mortality in patients with H-type hypertension. This divergence may originate from population heterogeneity, specifically the influence of Hcy levels.
Identifying populations at high risk of mortality is of critical importance for public health. Our subgroup analysis revealed that in patients with both H-type hypertension and HF, those with higher Vit D levels had lower all-cause and CVD mortality. Furthermore, our study also identified an interaction between age and Vit D regarding CVD mortality, particularly in patients with H-type hypertension aged 60 years or younger, where serum Vit D levels were more significantly associated with reduced CVD mortality. A review comparing the relationship between Vit D supplementation and mortality across different disease states indicated that the effects of Vit D supplementation vary depending on specific diseases and patient outcomes. 25 In managing patients with H-type hypertension, it may be advisable to monitor Vit D levels during clinical assessments and to supplement Vit D as needed, especially in those who are under 60 years of age or have comorbid HF.
In subgroup and complete-case analyses, we observed that Vit D could reduce all-cause and CVD mortality risk. Additionally, machine learning models including Cox, RSF, GBM, and Xgboost, which incorporated Vit D as one of the feature variables, also maintained comparable predictive accuracy in the test set. This further illustrates the robustness of the association between Vit D and the prognosis of patients with H-type hypertension.
We further discovered that among individuals with Vit D deficiency, regular engagement in MVA was associated with a significantly lower risk of all-cause mortality compared with those without MVA. Vit D deficiency and absence of MVA demonstrated a clear additive risk pattern. When both risk factors co-occurred, the risk of all-cause mortality was highest. Previous studies have indicated that there is a significant independent association between Vit D and the deceleration of phenotypic age (PhenoAge). When combined with physical activity, its protective effect can be significantly enhanced. 26 These findings highlight the importance of Vit D and physical activity in improving patient prognosis, which may have significant public health implications.
Our study has several limitations. Firstly, due to the nature of observational research, we are unable to establish causal relationships between Vit D concentrations and all-cause mortality among patients with H-type hypertension from the data. Future RCTs related to Vit D supplementation focused on patients with H-type hypertension hold significant value, with particular focus on Vit D severe deficient patients with H-type hypertension. Secondly, due to the absence of repeated measurements of Vit D levels, we are unable to ascertain the relationship between the dynamic changes in Vit D levels and mortality. Lastly, we cannot fully discount residual or unknown confounding effects attributable to measurement errors and unmeasurable variables, such as psychological stress and genetic susceptibility.
Conclusions
Among patients with hypertension, those with H-type hypertension had significantly lower serum Vit D levels and higher risks of all-cause and CVD mortality. In H-type hypertension, serum Vit D concentrations were linearly and inversely associated with both all-cause and CVD mortality, with the highest risk observed in those with severe deficiency (<25.00 nmol/L). Lower Vit D concentrations were more strongly associated with elevated mortality risk in patients aged 60 or younger and in those with comorbid HF.
Supplemental Material
sj-docx-1-dhj-10.1177_20552076251408527 - Supplemental material for Association of serum vitamin D levels with mortality in adults with H-type hypertension: Results from the NHANES database with traditional and machine learning approaches
Supplemental material, sj-docx-1-dhj-10.1177_20552076251408527 for Association of serum vitamin D levels with mortality in adults with H-type hypertension: Results from the NHANES database with traditional and machine learning approaches by Shuling Chen, Jiaxing Ke, Lingjia Li, Chenxin Liao, Feng Peng, Dajun Chai and Jinxiu Lin in DIGITAL HEALTH
Footnotes
Abbreviations
Acknowledgements
The author acknowledges the valuable contributions made by the participants in the National Health and Nutrition Examination Survey in the United States and the survey staff.
Ethical considerations
Informed consent
NCHS has received the written informed consent forms from each participant. Detailed information can be obtained at the following websites: https://wwwn.cdc.gov/nchs/nhanes/continuousnhanes/documents.aspx?BeginYear=2001, https://wwwn.cdc.gov/nchs/nhanes/continuousnhanes/default.aspx?BeginYear=2003, and ![]() .
.
Author contributions
JL and JK designed research. SC, JK, and CL conducted research and analyzed data. SC, JK, and LL wrote paper. JL, FP, and DC had primary responsibility for final content. All authors read and approved the final manuscript.
Funding
The authors disclosed receipt of the following financial support for the research, authorship, and/or publication of this article: This study was supported by Medical Innovation Project of Fujian Province, China, Grant No. 2019Y9127 (JL) and Grant No. 2021Y9153 (SC).
Declaration of conflicting interests
The authors declared no potential conflicts of interest with respect to the research, authorship, and/or publication of this article.
Data availability
Guarantor
JL
Supplemental material
Supplemental material for this article is available online.
References
Supplementary Material
Please find the following supplemental material available below.
For Open Access articles published under a Creative Commons License, all supplemental material carries the same license as the article it is associated with.
For non-Open Access articles published, all supplemental material carries a non-exclusive license, and permission requests for re-use of supplemental material or any part of supplemental material shall be sent directly to the copyright owner as specified in the copyright notice associated with the article.