
Abstract
Background
Early detection of postsurgical complications is critical for improving surgical outcomes, yet current monitoring methods are invasive, time-consuming, and may delay intervention. Advances in machine learning (ML) and artificial intelligence (AI) enable using real-time data, such as accelerometer-derived physical activity, as potential early warning signs. This exploratory study evaluated whether activity trends can predict postsurgical complications in oncology patients using ML models.
Methods
Usual care data from a surgical oncology ward (October 2020–December 2024) were analyzed. Three classifiers were evaluated—Random Forest (RF), eXtreme Gradient Boosting (XGB), and Logistic Regression (LR)—within a nested cross-validation framework. Two modeling strategies were compared: (1) training/testing without undersampling and (2) training with undersampling at varying factors to balance complication versus noncomplication days. Models were assessed for next-day complication prediction using area under the ROC curve (AUC), precision, recall, and F1-score with bootstrap confidence intervals.
Results
Data were collected from 965 patients, of whom 189 were included. The best performance for RF was observed at an undersampling factor of 1 (AUC = 0.66, 95% confidence interval (CI) 0.64–0.67; recall = 0.63, 95% CI 0.27–0.91; precision = 0.05, 95% CI 0.03–0.07). LR achieved its highest AUC without undersampling (0.68, 95% CI 0.67–0.69), while XGB performed consistently lower (AUC ≈ 0.63–0.64).
Conclusions
This exploratory study showed that postoperative activity trends alone were insufficient to predict complications after major oncological surgery. Combining accelerometer, physiological, and laboratory data may improve predictive accuracy and overall clinical value in perioperative care.
Introduction
Despite significant surgical advances in recent decades, complications after oncological surgery remain highly prevalent, with rates ranging from approximately 20% to 50% depending on the anatomical site and procedure type.1–4 These complications lead to extended hospital stays, impose an emotional burden on the patient and increase costs for the hospital.5,6 The current process of predicting postsurgical complications is complex and multifactorial. 7 Current Early Warning Signs (EWS) used in postoperative care are based on immunological markers, vital signs, and haematological samples. 8 Unfortunately, these EWS are often collected by invasive methods which can be time-consuming, leading to delayed interpretation by healthcare practitioners.8–10
Technological evolution, developments in artificial intelligence and advances in data processing and analysis, open new windows for the use of real-time data and progressing toward data-driven clinical decision making.11–13 Clinical Decision Support Systems (CDSS) use healthcare data for descriptive and diagnostic purposes, toward predictive and prescriptive analyses and treatments.11,14 Currently we have the possibility of gathering and analyzing continuous inpatient data.14–17
One type of data that is easy to gather and analyze and does not involve invasive methods is physical activity data recorded through an accelerometer. 18 Physical activity data provide insights into a patient's movement pattern, helping clinicians assess the patient's functional recovery after surgery.19–21 This data, obtained with a simple device worn on the trunk, wrist or ankle, provides a wealth of information on when and how much the patient has moved during admission.22–24
Recently, scientific research has focused on monitoring perioperative physical activity using accelerometer data.15,23,25–27 In addition, studies have also explored the use of machine learning (ML) and wearable data to detect early signs of clinical deterioration. For example, a recent pilot study showed that accelerometer-derived heart rate data combined with ML algorithms could predict postoperative events before the onset of clinical symptoms. 28 Similarly, another study applied ML models to wearable data from postoperative patients and found that changes in activity and heart rate patterns were associated with emerging complications after discharge. 29 These recent research shows how the integration of accelerometers into usual care has grown, improving the access to physical activity data for clinicians and researchers. Current studies using physical activity data have shown that changes in physical activity levels in the days immediately after surgery could be used to predict complications in patients after liver hepatectomy surgery. 30 A sudden drop-in activity following a steady increase may signal to clinicians that a complication has occurred, is developing, or is likely to occur.30–32 This suggests that physical activity data could be helpful for clinicians as an additional EWS after oncological surgery.
Therefore, the primary objective of this exploratory study was to assess whether trends in usual-care physical activity data could serve as early indicators of complications after major gastrointestinal and bladder surgery in oncology patients.
Methods
Study design and population
A retrospective observational cohort study was conducted at the University Medical Center Utrecht (the Netherlands). Usual care data from the surgical oncology ward, gathered between October 2020 and December 2024 were used. No informed consent was given for the use of the data, as the data were collected as part of usual care. This study was not subject to the Dutch Medical Research Involving Human Subjects Act (WMO) and did not require ethics committee approval. At UMC Utrecht, an independent review confirmed compliance with legal and ethical standards, and permission was granted after review of the protocol: 24U-0064- MAVS.
Surgical, demographic, and accelerometer data were obtained from patients of the surgical oncology ward. At the surgical oncology ward in UMC Utrecht, physical activity data are recorded as part of usual care. Every patient admitted to the ward with an expected admission longer than 3 days receives an accelerometer. However, patients are not obliged to wear the accelerometer and can choose to decline to wear it. Inclusion criteria for the current study were the following: (1) patients underwent major gastrointestinal and bladder surgery for cancer (bladder, esophagus, stomach, liver, or colon) and (2) the patients had at least three consecutive wearing days during hospital stay (excluding admission and discharge date). A wearing day was considered as a day where the patient at least had 5 minutes of physical activity. If the value was below 5 minutes, it was considered a nonwearing day. This criterion was deliberately applied to ensure inclusion of patients with sufficiently reliable data. Because this was an exploratory study, the focus was on assessing predictive potential under suboptimal but realistic conditions—specifically, among patients who actually wore the accelerometer consistently during their postoperative period. Prediction started only after the patient satisfied the second criterion. Verification was performed to ensure that all patients met this requirement.
Outcome measures
Physical activity
Physical activity levels were measured with an accelerometer. The accelerometer that was used is the Physical Activity Monitor (PAM) version AM400. Output of the PAM AM400 is the total active minutes. Agreement with the well-established accelerometer Actigraph (wGT3X-Bt) showed a strong Intraclass Correlation Coefficient of 0.955 in patients from different wards of the University Medical Centre Utrecht. 33
Postoperative complications
Demographical and clinical data from the patient were obtained from the electronic health records (HER). These data consisted of age, gender, body mass index (BMI), comorbidities, the American Society of Anaesthesiologists (ASA classification), type of surgery, length of admission, and discharge destination. Race and ethnicity data were not included, as they were not consistently recorded in the Electronic Health Record (EHR)
Postoperative complications were extracted from Dutch Institute for Clinical Auditing (DICA) databases, including the DCRA, DUCA, and DHBA, each covering a major abdominal surgery group. For cystectomy patients, complications were retrieved from an internal database (UMC Utrecht). As definitions varied and lacked description; complication details and dates were manually extracted from the EHR.
Statistical analyses
All analyses were conducted in Python (v3.11.9). Baseline demographic and clinical variables were summarized separately for patients with and without complications. Numerical variables (e.g. age, BMI, and ASA score) were tested for normality using the Shapiro–Wilk test. Normally distributed variables were reported as means (SD) and compared using independent t-tests; skewed variables were reported as medians (interquartile range, IQR) and compared using Mann–Whitney U tests. A Bonferroni correction was applied, adjusting significance to p < 0.007 for multiple comparisons.
Categorical variables (e.g. hypertension, diabetes, and kidney dysfunction) were analyzed as binary (yes/no), summarized as proportions, and compared using Chi-squared tests. Surgical type and discharge destination were also compared between groups using Chi-squared tests, with the same Bonferroni-adjusted threshold.
To assess physical activity trajectories, total daily activity was compared between groups across the first seven postoperative days (PODs) using the Mann–Whitney U test. Due to repeated testing across days, a Bonferroni correction was applied (p < 0.007).
Daily physical activity trend-related features were calculated using the daily total activity minutes per patient. These features aim to capture the dynamic trends of the patient physical activity patterns. The following features were calculated from the activity data, for each day of each patient: Kendall's tau and p-value from the Mann–Kendall test, the intercept, slope, and R-squared values from a linear regression model fit to this data, the trend direction and p-value from the Cox-Stuart test, and the intercept and slope from Sen's slope method. These features were selected because of their potential information about the trends and changes in physical activity levels over admission.
The calculated trend features were used to train three ML classifiers: RF, XGB, and LR. These were selected to represent a range of modeling approaches: LR (interpretable linear baseline), RF (robust nonparametric ensemble), and XGB (high-performance gradient boosting model). The prediction target for all models was a binary indicator of next-day complication, defined as the presence or absence of a complication recorded the following day, irrespective of clinical subtype. Each patient contributed one admission episode, starting at surgery, and ending at either the first recorded complication or discharge. Thus, each patient had daily total activity values from which trend features were calculated. Supplemental material A provides a step-by-step description of data processing up to feature calculation. This includes procedures for data aggregation, wear-time validation, episode construction, and integration with HER data. No additional preprocessing or signal filtering was required, as the PAM accelerometer directly outputs aggregated daily activity summaries.
Given the expected class imbalance, two modeling strategies were compared: (1) training/testing on the original imbalanced dataset and (2) training with undersampling of noncomplication days within training folds to achieve specified ratios (factors = 0, 1, 1.5, 2, 4, and 6). Test sets were never altered to ensure fair comparison.
Model development followed a fully nested cross-validation design to prevent data leakage. Each iterations used 200 repeated stratified 70/30 train–test splits (outer loop), within which hyperparameters were optimized via grid search in a five-fold stratified cross-validation (inner loop). The inner loop was confined to the training data of each outer iteration, ensuring that feature selection, scaling, and resampling were applied only to training folds.
To reduce overfitting risk, we implemented a scikit-learn pipeline including univariate feature selection (SelectKBest, analysis of variance (ANOVA) F-test, k = 3, 5, or all), and model fitting. Standardization (StandardScaler) was applied only for logistic regression models. The hyperparameter search spaces for all models (RF, XGB, and LR) are reported in Supplemental material B. The primary performance metric was the area under the receiver operating characteristic curve (AUC), aggregated across all outer test splits and reported with 95% confidence intervals obtained via cluster bootstrapping (B = 2000). Secondary metrics—precision, recall, and F1-score—were averaged across outer splits using a fixed decision threshold of 0.5.
Results
Patient characteristics
Of the 965 patients initially screened, 621 (64.4%) underwent major surgical procedures. Among these, 582 (93.7%) had complete accelerometer measurements during admission. After restricting the dataset to measurements strictly between admission and discharge, 500 patients (85.9%) remained. Applying the predefined data quality criterion—requiring at least three consecutive days with ≥5 minutes of total activity, resulted in a final cohort of 189 patients (19.6% of the total cohort). The reasons for exclusion and flow chart of participants are shown in Figure 1. Of the included patients, 36 patients had a complication recorded during hospital stay (19.8%) and 153 did not (80.2%). Description and type of complications are shown in Supplemental material C. The patients with and without a complication were comparable regarding sex, age, weight, height, BMI, and ASA scores (Table 1).

Flowchart of included patients. “n” indicates the total number of patients; “C” refers to those with a recorded complication in the specified complication databases; and “NC” indicates patients without recorded complications.
Baseline demographic and clinical characteristics of patients stratified by complication group.
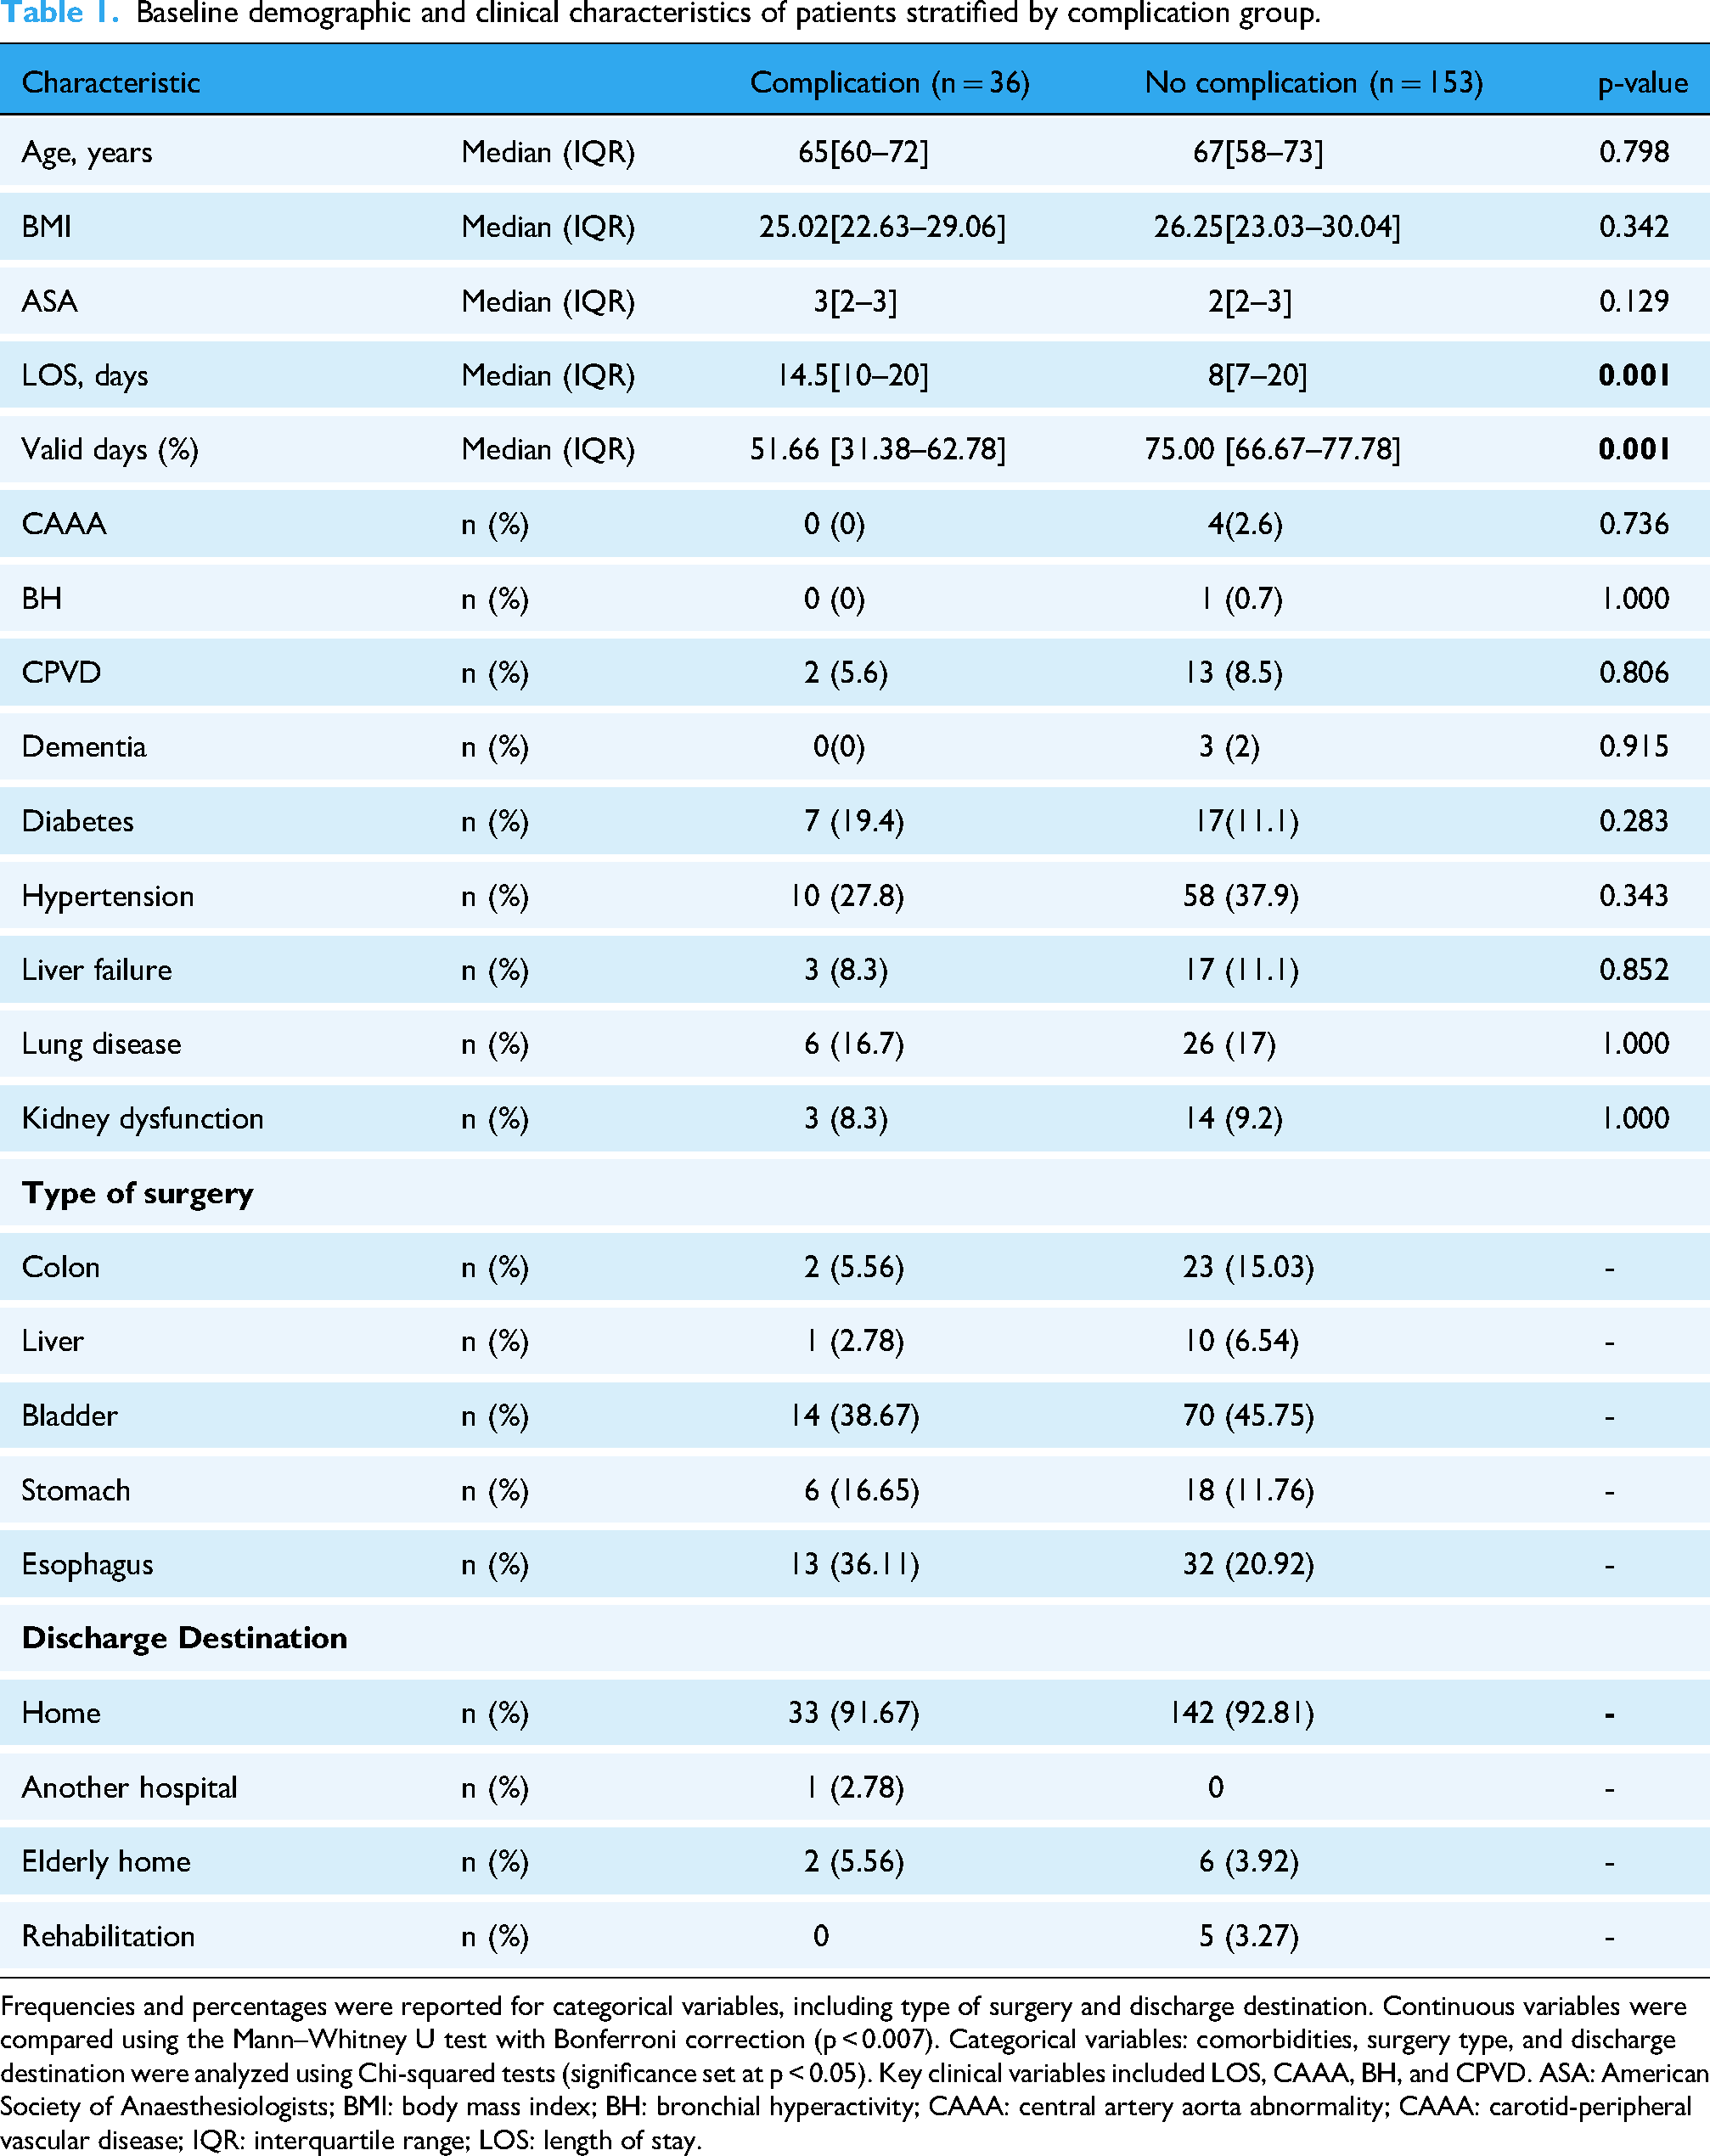
Frequencies and percentages were reported for categorical variables, including type of surgery and discharge destination. Continuous variables were compared using the Mann–Whitney U test with Bonferroni correction (p < 0.007). Categorical variables: comorbidities, surgery type, and discharge destination were analyzed using Chi-squared tests (significance set at p < 0.05). Key clinical variables included LOS, CAAA, BH, and CPVD. ASA: American Society of Anaesthesiologists; BMI: body mass index; BH: bronchial hyperactivity; CAAA: central artery aorta abnormality; CAAA: carotid-peripheral vascular disease; IQR: interquartile range; LOS: length of stay.
There was a statistically significant difference in the percentage of valid days between the complication and noncomplication groups (p < 0.001). Participants with complications had a lower percentage of valid days (median = 51.66%, IQR: 31.38–62.78%) compared with those without complications (median = 75.00%, IQR: 66.67–77.78%).
There was a statistically significant difference in the length of stay between patients with and without complications (p = 0.007). Patients with complications had a longer hospital stay (median = 14.5 days, IQR = 10–20) compared with those without complications (median = 8 days, IQR = 7–20). Regarding comorbidities, no significant differences were found between the groups. No statistically significant differences in complication rates were observed across surgical groups (p = 0.173) or discharge locations (p = 0.132) based on Chi-squared tests of independence. Complete categorical outcomes are shown in Table 1.
No significant differences in physical activity were found between patients with and without complications during the first seven postoperative days (all p > 0.25). Physical activity during the first seven postoperative days, along with statistical comparisons between groups is shown in the Supplemental material D. Example of individual postoperative physical activity trends showing values of daily total activity across postoperative days its shown Figure 2.

Example of individual postoperative physical activity trends. Each point represents daily total activity (minutes) across postoperative days (POD). The line shows the fitted activity trend (slope) used for feature extraction. The blue marker indicates the day the complication occurred. The trend before the complication illustrates the change in activity preceding the event.
Prediction of complications
Modeling without undersampling
In the first strategy, where models were trained and tested on the original imbalanced dataset, discrimination was modest across the three models. LR achieved the highest performance with an AUC of 0.683 (95% CI 0.674–0.692), followed by RF (0.653, 95% CI 0.643–0.663) and XGB (0.624, 95% CI 0.613–0.635). Per-split AUC estimates were consistent, ranging between 0.655 and 0.697 (95% CI boundaries: 0.526–0.806). RF achieved a recall of 0.01 (0.00–0.09) and an F1-score of 0.01 (0.00–0.17), while XGB failed to identify positive cases (recall = 0.00 [0.00–0.00]; F1 = 0.00 [0.00–0.00]). LR performed similar, with recall = 0.02 (0.00–0.09) and F1 = 0.03 (0.00–0.17). Precision remained low across all models (≤ 0.16). ROC curves for the three models without undersampling are shown in Figure 3.

Receiver operating characteristic (ROC) curves for Logistic Regression (LR), Random Forest (RF), and XGBoost (XGB) models using the original imbalanced dataset (UF = 0). Curves represent the model performance obtained from a single stratified train–test split, with 95% bootstrap confidence intervals shown as shaded regions. The diagonal line indicates chance-level performance. UF: undersampling factor.
Modeling with undersampling
In the second modeling strategy, model performance varied modestly across undersampling factors (Table 2). Across all undersampling factors, AUC values ranged from 0.62 to 0.68 (95% CI 0.61–0.69). LR remained relatively stable across all factors (AUC ≈0.65–0.67, 95% CI 0.64–0.68). RF showed slight improvement with undersampling, increasing from 0.65 (95% CI 0.64–0.66) to 0.67 (95% CI 0.66–0.68) at higher factors, while XGB consistently yielded lower AUCs around 0.63–0.64 (95% CI 0.62–0.65).
Model performance across undersampling factors.

UF refers to the controlled reduction of the majority class (noncomplication days) in the training data to mitigate class imbalance. UF = 0 represents the original imbalanced dataset (no undersampling). Increasing UF values indicate progressively stronger undersampling, where the number of noncomplication observations is reduced to achieve approximate class ratios ranging from 1:1 (UF = 1) to 6:1 (UF = 6). Bolded values indicate the highest performance per metric within each model.
AUC: area under the receiver operating characteristic curve; CI: confidence interval; LR: logistic regression; ML: machine learning; RF: Random Forest; UF: undersampling factor; XGB: eXtreme Gradient Boosting.
Recall improved markedly for RF and XGB when undersampling was applied. For RF, recall increased from 0.01 (95% CI 0.00–0.09) at UF = 0 to a peak of 0.63 (95% CI 0.27–0.91) at UF = 1, after which it progressively declined with higher undersampling levels (e.g. 0.35 [95% CI 0.09–0.73] at UF = 2 and 0.04 [95% CI 0.00–0.18] at UF = 6). XGB showed a similar trend, with recall improving from 0.00 (95% CI 0.00–0.00) to 0.62 (95% CI 0.36–0.91) at UF = 1, followed by a gradual decline at higher undersampling levels. LR exhibited less pronounced changes, maintaining low recall values across all factors (0.02–0.17, 95% CI 0.00–0.55). Precision and F1-scores remained consistently low across all models and undersampling factors. RF and XGB showed slight improvement at moderate undersampling (UF = 1–2; precision ≈ 0.05–0.07 [95% CI 0.03–0.09]; F1 ≈ 0.09 [95% CI 0.05–0.15]), while LR demonstrated similar values with small variation. At higher undersampling levels, both precision and F1 decreased, indicating reduced reliability of positive predictions despite marginal gains in recall. ROC curves for UF = 0 and UF = 1 are shown for all models (Figure 4), including 95% bootstrap confidence bands. A complementary view, displaying the three models compared within each undersampling factor, has been added to Supplemental material E. Corresponding confusion matrices for each model (UF = 0 and UF = 1) are included in the Supplemental material F.

ROC curves comparing model performance with and without undersampling.(A) Random Forest, (B) XGBoost, and (C) Logistic Regression ROC curves are shown for UF = 0 (no undersampling) and UF = 1. Shaded areas represent 95% bootstrap confidence intervals. AUC values with corresponding 95% confidence intervals are reported in each panel's legend. Across all three models, undersampling (UF = 1) increased sensitivity but did not improve discriminative performance, resulting in only modest improvements in recall and similar AUC values. AUC: area under the ROC; UF: undersampling factor; ROC: receiver operating characteristic.
Discussion
Our study aimed to explore the potential use of physical activity trends data from usual care to predict complications after major oncological surgery. We used two different modeling strategies (unaltered data and undersampled data) on the physical activity trends data. Metrics were calculated for each of these models. The objective of these metrics was to show the ability of these models to detect if oncological surgery patients will have a complication in the following days after surgery.
For the first modeling strategy, the best predictive performance was achieved by the LR model, with an AUC of 0.68 when trained on the original, imbalanced dataset. The RF and XGB models performed similarly, both showing moderate discrimination. Compared to established clinical baselines such as the ASA score, our results are very similar. In a recent study by Xing et al., 34 the ASA classification alone achieved an AUC of 0.636 (95% CI 0.578–0.691) for predicting postoperative systemic complications in elective gastrointestinal surgery. The ASA score, however, is not originally intended to predict postoperative complications but rather to assess the patient's preoperative frailty and overall physical status. Still, when comparing our nonundersampled results to ASA-only results, the performance is comparable. Although Xing et al. included a larger sample size (n = 294), the similarity in AUC values suggests that our model's discriminative ability is comparable with the ASA score used as a single predictor.
For the second modeling strategy, model performance improved with moderate undersampling (factors 1–2) for the RF and XGB models compared to the original imbalanced dataset. This trend was not observed for the LR model, which achieved its best performance without undersampling. The RF model reached an AUC of up to 0.67 under moderate undersampling (factors 3–4), showing comparable performance to LR without undersampling. In contrast, XGB consistently showed lower discrimination, with AUC values around 0.63 to 0.64 and was less sensitive to changes in class balance. This pattern likely reflects how each model handles class imbalance. Moderate undersampling helped RF and XGB by giving the minority class (complications) more weight, reducing their bias toward noncomplication days. However, higher undersampling factors removed valuable information and reduced performance. In contrast, LR performed better on the unaltered complete dataset because, as a simpler linear model, it relies on having more data to estimate stable coefficients and is less affected by class imbalance.
From a multimetric perspective, improvements in sensitivity came at the cost of lower precision, and no single model consistently outperformed others across all criteria. Recall improved most at an undersampling factor of 1 across all three models, where the dataset was balanced between complication and noncomplication. At this level, the RF model achieved the highest recall [0.63 (0.27–0.91)] correctly identifying nearly two-thirds of the days on which complications occurred. However, precision remained low [0.05 (0.03–0.07)] meaning most predicted complication days were false positives. From a clinical perspective, false positives would translate into unnecessary alerts and additional patient assessments. On the other hand, false negatives could mean missed opportunities to detect early signs of complications, which carry higher clinical risk. Understanding and managing these trade-offs is key to achieving clinical performance and implementation. In postoperative care, prioritizing sensitivity may be more appropriate, as identifying at-risk patients early could outweigh the burden of extra monitoring and assistance. Similarly, the low F1-scores reinforce that the models struggled to balance sensitivity and specificity. This likely happened because changes in physical activity before complications are subtle and nonspecific. Patients naturally have fluctuations in movement due to pain, fatigue, or usual care treatments. This can happen despite the onset of complications, which ultimately might lead to false positives. In addition, the strong class imbalance, with far fewer complication days, also made it complex for the models to learn accurate patterns in the data. Since complications often result from physiological changes not always reflected in movement, activity data alone might not capture the full picture of a patient's functional condition. At last, although undersampling was used to balance the training data, the low number of complication cases (n = 36) constrained the sampling process. Hence, even after undersampling, the dataset remained imbalanced because the majority class could not be reduced beyond the number of available minority instances without severely limiting model training. Undersampling was constrained by the limited number of complication cases, resulting in residual class imbalance.
In a recent study from Iida et al. 30 a visual analysis of the physical activity trends of patients after hepatectomy surgery was performed. They classified patients according to the shape of their physical activity trend in the following days after surgery. These physical activity shapes were “Flat” (no changes in activity), “Bell Curve” (rising activity and then falling), or “Upward slope” (rising only). In the patients from the “Bell Curve” group, Lida et al. 30 observed that there were significantly more complications in the Bell curve and Flat group. Additionally, a considerable drop in physical activity levels 1 or 2 days before the complication was observed in the Bell curve group. These findings served as an inspiration for our study but in our case, we used a data driven approach to predict complications. Visual analysis might be more intuitive and interpretable for clinicians, offering transparency and immediate understanding. However, such interpretation can be subjective and prone to variability between observers. In contrast, data-driven mechanisms such as the described ML models we used, offer objective, reproducible outputs. These can be applied to create consistent thresholds to automatically flag patients at-risk and ultimately develop an EWS system. Still, ML models are often viewed as “black boxes,” lacking the interpretability that clinicians may require to completely trust or decide on their predictions. Ideally, combining both approaches could enhance clinical decision making by integrating intuitive understanding with data-driven systems.
To our knowledge, this is the first study that uses physical activity trends integrated in an ML model to predict postsurgical complications in major oncological surgery.18,35,36 Previous studies have used multiple clinical features. For example, Soguero-Ruiz et al. 37 investigated both linear and nonlinear kernel methods to predict anastomotic leakage in colorectal surgery patients, achieving promising results using features derived from vital signs and blood test markers. Similarly, Thottakkara et al. 38 evaluated multiple risk prediction models for postoperative sepsis and acute kidney injury in a large cohort of over 50,000 surgical patients. Their models integrated a set of clinical features, including comorbidities, medications, lifestyle factors, and preoperative clinical metrics, achieving high predictive performance with AUCs of 0.89 and 0.93, respectively. As previously mentioned, a recent study 28 applied a similar ML framework using wearable-derived resting heart rate data combined with EHR variables to detect postoperative events. In that study, the algorithm achieved a sensitivity of 81% and a specificity of 75% for postoperative event detection. Regarding their results, postoperative complications that occurred before discharge were excluded, and the model relied on multimodal data integration rather than physical activity alone, hence, the result are not directly comparable. As shown in the studies references above, combining multiple types of clinical and physiological data often leads to improved model performance and higher predictive accuracy. This high predictive accuracy is key for developing robust CDSS.12,36 Including a broader range of features in a ML model generally improves its predictive performance by capturing a more comprehensive representation of the patient health status. In the context of CDSS, this translates to more reliable and actionable predictions.11,26 In contrast, our model was developed using features derived solely from physical activity data which may not capture enough clinical information to predict complications at the same level of accuracy. While this study explored the potential of using a single data source for prediction, it also highlights a possible direction for future research. This direction could involve combining physical activity trends with clinical data like EHRs, vital signs, and lab results to improve prediction.
Our research has several strengths. We compared three ML models using both imbalanced and undersampled training strategies to explore the most effective setup for predicting complications in real clinical practice. In addition, we used routinely collected data which reflects actual clinical practice and provides a realistic and practical view of patient behavior and outcomes on the ward.
On the other hand, this study had several limitations
Our findings indicate that physical activity trends alone are insufficient for predicting postoperative complications after oncological surgery. To implement these models in current perioperative care, higher sensitivity and specificity would be required to ensure clinicians’ trust and practical usefulness. Future improvements in predictive accuracy, particularly through multimodal data integration, by the combination of physical activity data with other clinical data, could enable the development of a clinically viable CDSS to assist perioperative care in early identification and management of postoperative complications during hospitalization.
Supplemental Material
sj-docx-1-dhj-10.1177_20552076251408520 - Supplemental material for Physical activity trends as predictors of postoperative complications in oncology patients: A machine learning approach
Supplemental material, sj-docx-1-dhj-10.1177_20552076251408520 for Physical activity trends as predictors of postoperative complications in oncology patients: A machine learning approach by Carlos de Miguel Llorente, Sjoerd de Vries, Petra Bor, Laura Veerhoek, Jan Willem Van de Berg, Richard Meijer, Cindy Veenhof and Karin Valkenet in DIGITAL HEALTH
Footnotes
Acknowledgements
The authors thank the hospital healthcare professionals working at the surgical oncology ward and the Data Management Team at the UMC Utrecht.
Ethical approval
This study did not fall under the scope of the Dutch Medical Research Involving Human Subjects Act (WMO). It therefore did not require permission from an accredited medical ethics committee in the Netherlands. However, in the UMC Utrecht, an independent quality check was conducted to ensure compliance with legislation and regulations (regarding Informed Consent procedure, data management, privacy aspects, and legal aspects). Permission was given after review of the protocol: 24U-0064- MAVS.
Informed consent
Usual care data from the surgical oncology ward, gathered between October 2020 and December 2024 were used. No informed consent was given for the use of the data, as the data were collected as part of usual patient care.
Contributorship
CML, KV, SV, LV, and CV were involved in conceptualization of the work; CML, SV, and LV in formal analysis and methodology; CML and KV in project administration; PB, JWB, and RM in resources; CML and SV in software; CML, KV, and PB in writing original draft; and CML, KV, SV, LV, CV, PB, JWB, and RM in review and editing. All authors approved of the final version of the manuscript.
Funding
The authors received no financial support for the research, authorship, and/or publication of this article.
Declaration of conflicting interests
The authors declared no potential conflicts of interest with respect to the research, authorship, and/or publication of this article.
Data availability statement
The data that support the findings of this study are available from the corresponding author upon reasonable request. Access to raw patient data is restricted due to ethical and privacy considerations.
Guarantor
CML.
Peer review
XXX.
Supplemental material
Supplemental material for this article is available online.
References
Supplementary Material
Please find the following supplemental material available below.
For Open Access articles published under a Creative Commons License, all supplemental material carries the same license as the article it is associated with.
For non-Open Access articles published, all supplemental material carries a non-exclusive license, and permission requests for re-use of supplemental material or any part of supplemental material shall be sent directly to the copyright owner as specified in the copyright notice associated with the article.